Journal of Power and Energy Engineering
Vol.04 No.03(2016), Article ID:65222,14 pages
10.4236/jpee.2016.43005
A SVM Based Condition Monitoring of Transmission Line Insulators Using PMU for Smart Grid Environment
Kailasam Saranya, Chinnusamy Muniraj
Electrical and Electronics Engineering, K.S. Rangasamy College of Technology, Thiruchengode, India

Copyright © 2016 by authors and Scientific Research Publishing Inc.
This work is licensed under the Creative Commons Attribution International License (CC BY).
http://creativecommons.org/licenses/by/4.0/


Received 20 February 2016; accepted 28 March 2016; published 31 March 2016
ABSTRACT
A new methodology for the detection and identification of insulator arc faults for the smart grid environment based on phasor angle measurements is presented in this study and the real time phase angle data are collected using Phasor Measurement Units (PMU). Detection of insulator arcing faults is based on feature extraction and frequency component analysis. The proposed methodology pertains to the identification of various stages of insulator arcing faults in transmission lines network based on leakage current, frequency characteristics and synchronous phasor measurements of voltage. The methodology is evaluated for IEEE 14 standard bus system by modeling the PMU and insulator arc faults using MATLAB/Simulink. The classification of insulator arcs is done using Support Vector Machine (SVM) technique to avoid empirical risk. The proposed methodology using phasor angle measurements employing PMU is used for fault detection/classifi- cation of insulator arcing which further helps in efficient protection of the system and its stable operation. In addition, the methodology is suitable for wide area condition monitoring of smart grid rather than end to end transmission lines.
Keywords:
Phasor Measurement Units, Insulator Arc, Feature Extraction, Synchronous Phasor Measurements, Leakage Current, Support Vector Machine

1. Introduction
Smart Grid is considered as a future of power grid which is able to cater the production, transmission and distribution of generated electricity by modern technology to resolve many issues in modern power grid. The permanent and temporary transmission line faults can have huge impact on operational stability of Smart Grid such that these faults lead to the islanding of faulted system [1] . During recent years, the development of various intelligent techniques and algorithms for the identifying and classifying transmission line faults in Smart Grid has received a lot of research interest [2] .
Majority of investigations focuses on detection/classification of permanent faults which include symmetric and asymmetric faults [3] . These studies rely on asynchronous measurement of voltage and current which is used to locate the fault but failed to classify the faults accurately [4] . Recently, the scope of investigation moved to synchronous measurement approach for detection, classification and location of faults [5] . The existing synchronous measurement approach also classifies the faults in a single transmission line but not for the entire grid [6] [7] . Many of the literature surveys show various methods for fault detection or classification excluding insulator arcing faults [8] . However, the temporary faults such as insulator arcing faults, etc. also contribute to a significant role in most of the faults on extremely high voltage (EHV)/ultra-high voltage (UHV) overhead transmission lines [9] [10] . The study which focused on arc discrimination based on synchronous measurements has not thrown enough light on insulator arcs [11] . The literature survey shows that both contamination and wetting of insulator surfaces initiate the flow of leakage current, which in turn causes insulator flashover [12] . Based on the intensity of arc, its creepage distance and leakage current, the flashover has extensive stages of development, which differ in magnitude. Hence the system voltage and current get disturbed due to such insulator flashover which is supposed to be monitored for proper operation of the power system [12] . In contrast, it is necessary to propose a methodology for the identification of insulator arcing faults for the entire grid.
Considering these facts, the paper work deals with a new methodology for the detection and classification of insulator arcing faults for the smart grid environment based on phasor angle measurements. The research work includes the following aspects: Section 2 describes about insulator arc modeling at dynamic conditions. Phasor Measurement Technology and the real time phasor angle estimation using Phasor Measurement Units (PMU) are dealt in Section 3. In Section 4, the detection and classification of insulator arc faults in smart grid network are based on feature extraction of frequency components using IEEE 14 bus; and in Section 5, SVM technique used for classification of insulator arc faults is explained. Finally verification of simulation results for insulator arc faults for smart grid IEEE 14 bus using SVM is done using MATLAB/Simulink.
2. Dynamic Arc Modeling of Insulator Flashover
A theory which converts flashover mechanism to measurable parameters accounting the instantaneous changes of an arc suitable for flashover prediction is developed in this section. The leakage current during an arc is pre-do- minantly random in nature in any insulator and their dynamic properties are evaluated in terms of this leakage current. Surface discharges in the form of intermittent arcs, sustained arcs, etc. precede contamination flashover and it is mandatory to develop a computer model of the arc which could aid in understanding of the flashover process. For a given insulator profile (supply voltage pollution severity and arc length), the model estimates the voltage drop induced by the arc, arc resistance, etc.
A dynamic arc model devised from the external electric circuit which has an arc resistance in series with a pollution resistance, is supplied by a sinusoidal voltage. The arc is a single dominant sinusoidal voltage and the pollution resistance represents the pollution layer of the unbridged portion of the insulator. The assumptions made are such that source impedance is neglected, arc appears only along the surface of the insulator and the pollution layer is uniform [13] .
Figure 1 depicts the polluted insulator along with its dry band arc. During the arcing period the leakage current can be calculated using the model proposed by Obenaus and mathematically developed by Rizk [14] [15] . This model contains arcs and surface resistance connected in series. The equation for the sinusoidal supply voltage V(t) and arc voltage is given by:
 (1)
(1)
 (2)
(2)
The arc resistance per unit length is obtained dynamically from Mayr’s equation. The developed arc model with analytically calculated parameters given in Table 1 is validated based on the experimental results given by F. Amarh [15] [16] .
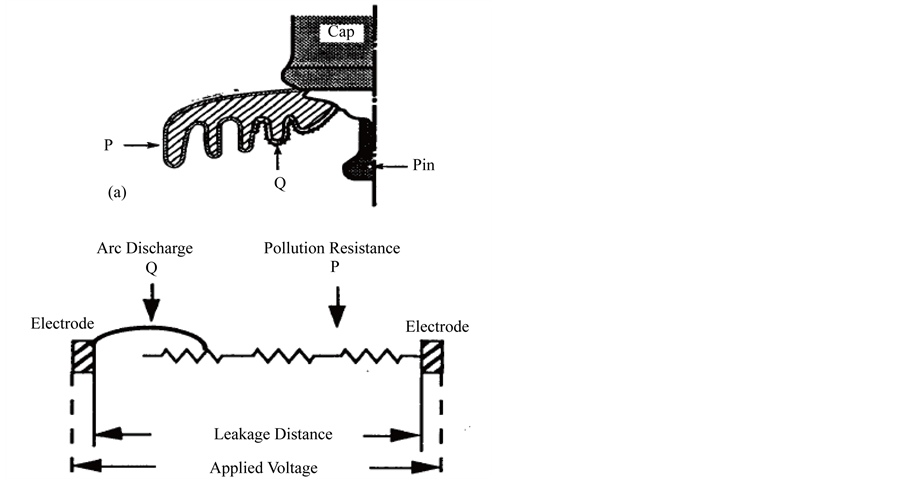
Figure 1. Circuit model of an arc-arc resistance in series with pollution resistance.

Table 1. Arc model parameters.
The arc conductance and Equivalent Salt Deposition Density (ESDD) can be given by (3)
 (3)
(3)
where σs is the arc conductance in Siemens [17] . The simulation results of leakage current based on Obenaus model [18] for normal operating conditions, sustained arc and flashover condition is presented in Figures 2-4.
3. Synchronous Phasor Estimation and PMU Modeling
A pure sinusoidal waveform can be represented by a complex number which is known as a phasor. Consider a sinusoidal signal
 (4)
(4)
 (5)
(5)
The magnitude is the rms value of the sinusoid  and its phase angle is ϕ of the sinusoidal signal in (4). The sinusoidal signal and its phasor representation given by (4) and (5) are illustrated in Figure 5.
However for any computational purpose, a unified reference signal of considerable accuracy is required from which the relative phase angles can be determined. This is because to make the phasor quantities to be made com- parable with other quantities measured at various locations around the network. Phasor estimation is initiated with sampling of original input signal at a rate of N-samples per cycle which constitutes a sample window. In order to achieve the phasor (magnitude and angle) of the input signal, Discrete Fourier Transform (DFT) is applied on the

Figure 2. Leakage current during normal operating conditions.
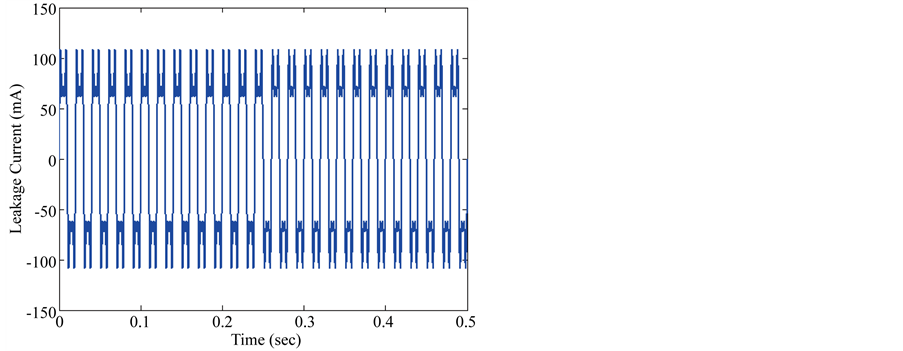
Figure 3. Leakage current during sustained arc condition.
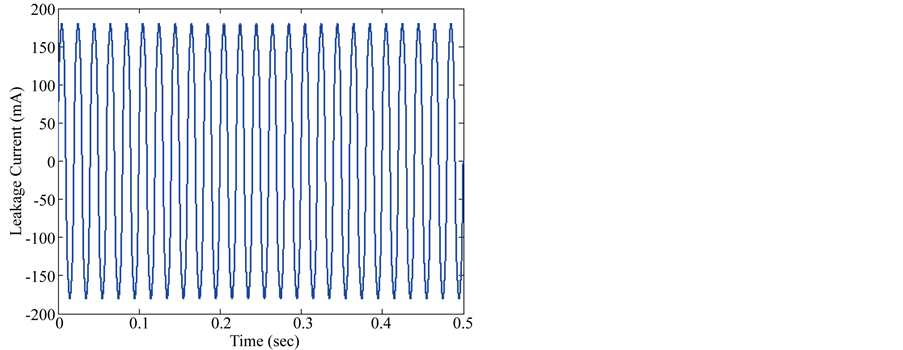
Figure 4. Leakage current during insulator flashover condition.
above sample window.
The dynamics of equivalent power factor angle (EPFA) at the time of any disturbance can be achieved only by rotating phasor, which is not the case of commercial PMUs [6] - [8] . In this methodology, to achieve a rotating phasor, sample windows starting from Window-1 to Window N-1 are utilized as represented in Figure 6.

Figure 5. Phasor representation of a sinusoidal signal. (a) Sinusoidal signal; (b) Phasor representation.

Figure 6. Sampling windows for phasor estimation.
At nominal frequency of the grid, the mapping of three phase synchronous voltage and current measurements to a rotating reference frame is done to estimate three phase equivalent voltage and current phasors. Using Park’s Transformation, These three phase quantities are mapped to two phase orthogonal quantities which can be given by (6)-(9), where Vd0 and Vq0 stand for direct and quadrature axes voltage, Id0 and Iq0 stand for current in rotating reference frame.
 (6)
(6)
 (7)
(7)
 (8)
(8)
 (9)
(9)
During normal operating conditions, VRN, VYN and VBN, the peak values of phase voltage are equal to each other whereas IRN, IYN and IBN are peak values of three-phase line current respectively. The power factor angle between line voltage and current is termed as ϕ. The frequency of three-phase voltage and rotating reference frame are termed as ω and  respectively which are in radians. The axes d0 and q0 represent the rotating reference frame rotating in anti-clockwise direction at nominal frequency of the grid which makes the reference frame to remain constant with respect to changes in voltage or current phasors.
The equivalent voltage phasor (V0) and current phasor (I0) form angles γ and η, respectively, with rotating axes d and q, which can be calculated as
 (10)
(10)
 (11)
(11)
The equivalent phase angle waveforms are then analyzed although FFT over a time span of (1/f) to estimate the frequency coefficients. The frequency coefficients corresponding to 0 Hz of equivalent voltage and current phase angle variations are represented by αγ and αη respectively which is shown in (12) and (13) as
 (12)
(12)
 (13)
(13)
For achieving the dynamics of these angles, voltage and current phasor have to be estimated for every sample window that consists of N number of samples of the original waveform. In MATLAB tool, the tangent operation can be performed by using trigonometric functions block. Major advantage of this transformation for classification problem is that only two-phase data are required to process for analyzing three-phase system. In addition, for identification of temporary faults such arcs, insulator discharge, etc. this transformation provides most promising results and the same can be observed in the simulation results.
4. Proposed Condition Monitoring Technique
Formulation of the proposed insulator arc identification and classification methodology based on phase angle oscillations of equivalent voltage and current phasor values is presented here.
4.1. Proposed Methodology
PMU installed at generator bus estimates the voltage and current phasors from measurements from capacitor voltage transformer (CVT) and current transformer (CT) whose schematic diagram is shown in Figure 7. Once

Figure 7. Schematic diagram of insulator arc detection methodology.
the arc is initiated at various instants, the sinusoidal supply voltage V(t) is injected into the system bus. The equivalent voltage and current phasors are measured by modeled PMU. The frequency coefficients are extracted by FFT analysis. It is observed from extensive case studies that FFT spectrum consists of frequency coefficients corresponding to 0 Hz only and all other frequency coefficients remain at zero during normal operating conditions.
However, during fault conditions frequency coefficients corresponding to 0 and 100 Hz have severe dependency on the type of insulator arc. So from FFT analysis, the percentage magnitude of harmonics at various frequencies are noted and analysed.
4.2. Implementation in IEEE 14 Bus System
Figure 8 shows the system considered for study which is IEEE 14 bus with PMU installed at generator G2 at bus-2 and the arc initiation is done on the line between 4 and 5. The simulation is done using MATLAB/Simu- link. Detection of faults can be done directly from the frequency coefficients “α” and “β” of equivalent voltage and current phase angle variations of generator G2 at bus-2.
4.3. Types of System Considered for Study
The above methodology is implemented in the IEEE 14 bus system with inducing the modeled arc in the trans- mission line between 4 and 5. The analysis is done for four different cases
1) System under normal condition
Under normal conditions, the leakage current across the insulators are almost zero and the system operates under stable condition.
2) System under sustained arc condition
The sustained arc is characterized by a leakage current magnitude of about 100 mA as shown in Figure 3.
3) System under insulator flashover condition
The insulator flashover is characterized by a leakage current magnitude of about 200 mA as shown in Figure 4. The insulator flashover is preceded by the sustained arcs and creates disturbances in the stable operation, sometimes interruption to the supply.
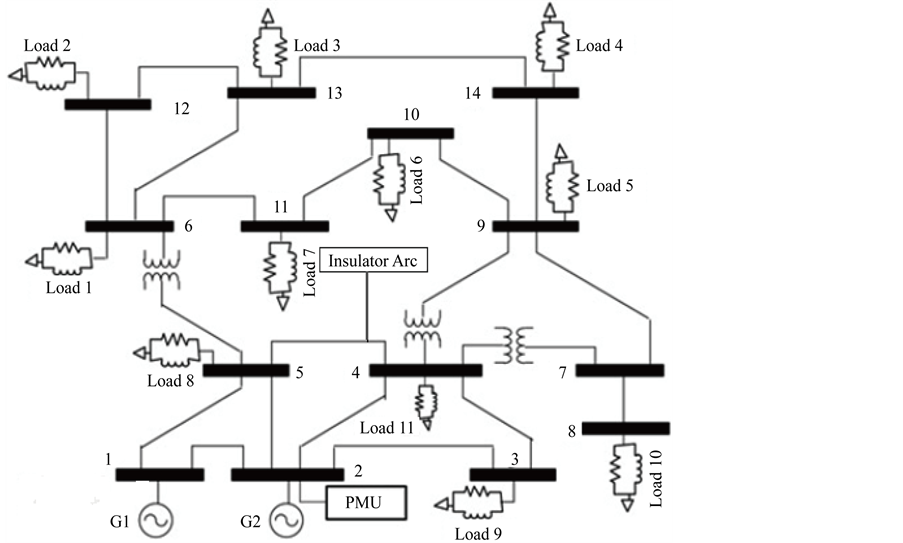
Figure 8. Schematic diagram of IEEE 14 bus employed for Insulator arc detection.
5. SVM Based Classification
SVM is one of the predominant machine intelligence techniques for fault classification in power systems which have less empirical risk [19] [20] . SVM involving non separable data without a separating hyper plane has been deployed in this paper for classifying the arc faults from frequency coefficients of equivalent phase angle variations and Total Harmonic Index (THD). The classification problem can be represented as (14)
 (14)
(14)
with following constraints (15)

 (15)
(15)
The Kernel function used is radial basis function which is given as
 (16)
(16)
σ is a positive integer.
The training data (xi, yi) have been categorized with sustained arc, flashover or normal condition labels. The set of equivalent phase angle coefficients (αγ and αη) and normalised three-phase voltage coefficients and total harmonic index forms the input data set for SVM classifier. The labeled fault type data corresponding to each set of values in input data set constitutes the output data set for SVM classifier. SVM classifier is trained with 1000 data sets to frame boundary for arc fault classification. The input data sets are generated for voltage and current phasor angle at 0 Hz, voltage and current phasor angle at 100 Hz and total harmonic index for synchronous voltage.
The proposed fault classification methodology has been implemented in MATLAB/SIMULINK environment for SVM training and classification. Radial basis function has been utilized as the kernel function which is defined as (16) [18] - [21] . Kernel parameter “σ” has been computed using optimum grid search method based on the training data.
6. Results and Discussion
The results of dq0 voltage, equivalent voltage phasor angle and FFT analysis for normal operation of the system, sustained arc and during insulator flashover are shown. The frequency analysis characteristics are tabulated at the end of the detection section. In addition, the SVM classification results of insulator arcs based on their frequency coefficients are discussed in this section.
6.1. Detection of Arc Based on Feature Extraction
The synchronous dq0 voltage, equivalent voltage phasor angle is computed using Park’s transformation. The input data for this computation is produced from the modeled PMU installed at generator bus 2 in IEEE 14 bus system. From the synchronous voltage, FFT analysis tool in MATLAB/Simulink is used for estimating total harmonic index. The modeled insulator arcs such as sustained arc and insulator flashover is induced in the transmission line insulators between bus 4 and bus 5 in the IEEE 14 bus system.
Figures 9(a)-(c) shows the synchronous dq0 voltage with respect to reference axes, estimated equivalent voltage phasor angle and FFT analysis results for the system under normal condition. The total harmonic index is 3.83% which is very well less than 5%. The results give a clear idea that for the stable operation of the system.
During sustained arc condition, the insulator arc remains from 0.18 to 0.42 seconds, whose dq0 voltage is shown in Figure 10(a). The equivalent phasor angle and FFT analysis results are shown in Figure 10(b) and Figure 10(c) respectively. The total harmonic index of synchronous voltage is steeped to 70.76% under this sustained arc condition.
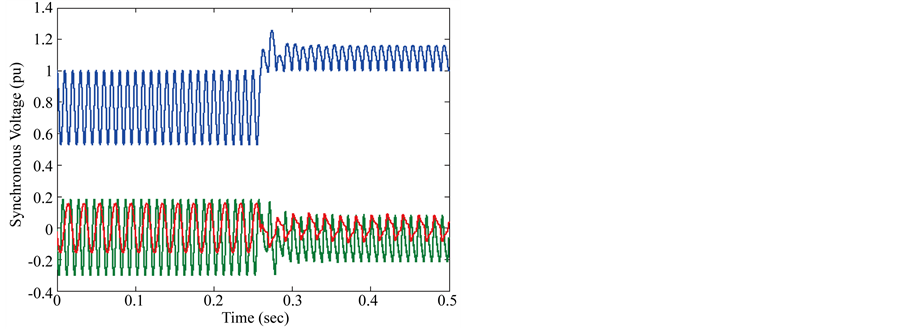
The insulator flashover occurs at 0.26 seconds and thus the dq0 voltage under this condition gets increased from 1 pu to 1.2 pu as shown in Figure 11(a). The FFT analysis result shows that the total harmonic index is in
 (a)
(a)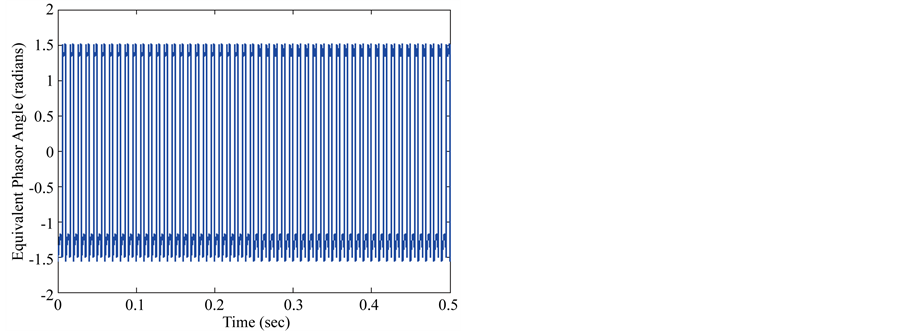 (b)
(b) (c)
(c)
Figure 9. Analysis of system under normal conditions. (a) Synchronous voltage of the system under normal condition; (b) Equivalent phasor angle of synchronous voltage; (c) FFT analysis of synchronous voltage.
 (a)
(a) (b)
(b)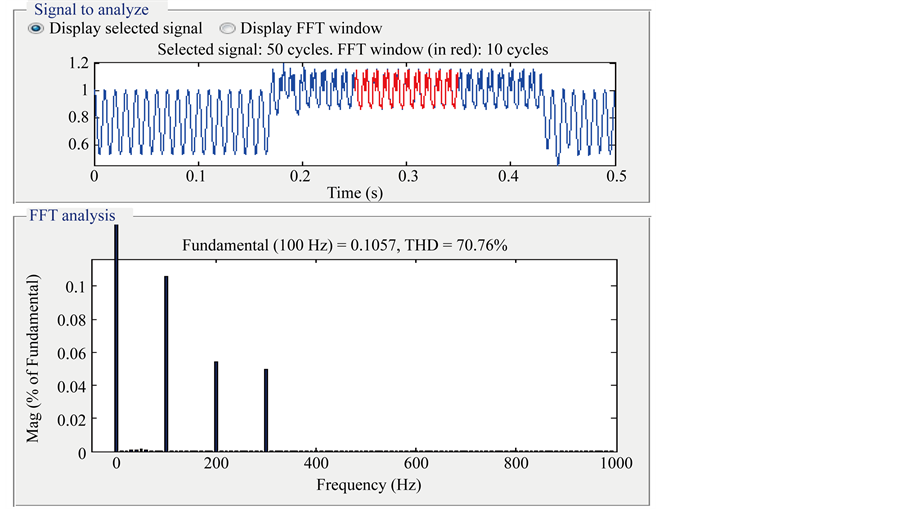 (c)
(c)
Figure 10. Analysis of system during sustained arc. (a) Synchronous voltage of the system; (b) Equivalent phasor angle of synchronous voltage; (c) FFT analysis of synchronous voltage.
 (a)
(a) (b)
(b) (c)
(c)
Figure 11. Analysis of system during insulator flashover. (a) Synchronous voltage of the system; (b) Equivalent phasor angle of synchronous voltage; (c) FFT analysis of synchronous voltage.
the range of 29% as in Figure 11(c). Figure 11(b) shows the equivalent phasor angle variation during flashover condition.
The results for first order, third order and DC component values for all the discussed cases are tabulated in Table 2. The %THD values gives a clear picture that for normal conditions, the value does not exceed 5%. But for sustained arc and insulator flashover conditions, the values vary up to 70% and 30% respectively.
6.2. Classification of Arc Based on SVM Results
The synchronous voltage and current phasor angle along with THD values of synchronous voltage has higher impact on the arc characteristics. So these values are chosen as input data for SVM training and classification. The synchronous phasor angle ranges from 0.36% to 0.5% for sustained arc condition whereas for normal condition, the variation is around 0.25% which is shown from the vector machines in Figure 12(a). Similarly support vectors for THD value for the sustained condition are 65% to 80% as shown in Figure 12(b).
Table 2. Harmonics index.

Figure 12. Support vectors for normal and sustained arc condition. (a) Results based on equivalent voltage and current phasor angle; (b) Results based on total harmonic index.
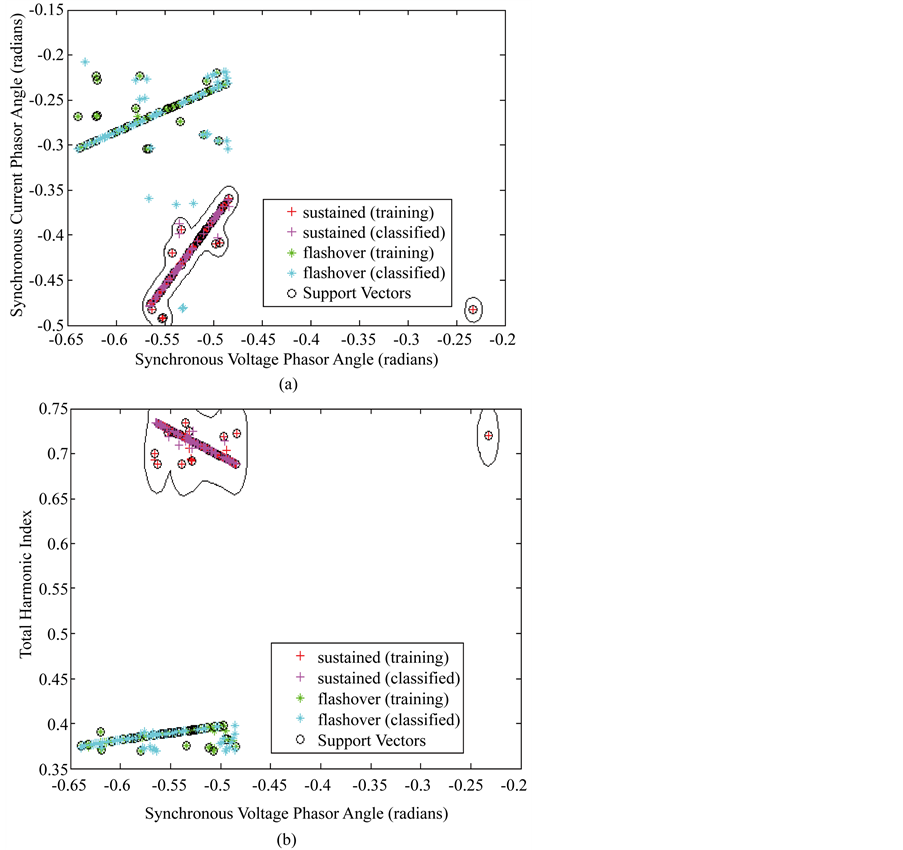
Figure 13. Support vectors for sustained arc and insulator flashover. (a) Results based on equivalent voltage and current phasor angle; (b) Results based on total harmonic index.
The synchronous phasor value for flashover condition ranges from 0.2% to 0.3% which is evident from support vectors shown in Figure 13(a). The THD values for insulator flashover condition are found to be around 30% to 35% whose support vectors are shown in Figure 13(b).
7. Conclusion
This paper proposes a real time insulator arc identification and detection methodology which paves a better way for condition monitoring of transmission line insulators of smart grid system. The major contribution of this work is PMUs installed in the smart grid for the measurement purposes could also be optimally used for monitoring the transmission line insulators and special devices or sensors are hardly required for the insulator condition monitoring. In addition, the methodology can be utilized for the purpose of scheduling preventive maintenance of insulators before any approaching insulator damage. Hence the significance of the work is to assist the wide area protection scheme of the Smart Grid systems with synchro phasor measurements done by PMU installed at the generator bus. Here the methodology to identify the location of insulator arc fault is not included which can be considered for future work.
Cite this paper
Kailasam Saranya,Chinnusamy Muniraj, (2016) A SVM Based Condition Monitoring of Transmission Line Insulators Using PMU for Smart Grid Environment. Journal of Power and Energy Engineering,04,47-60. doi: 10.4236/jpee.2016.43005
References
- 1. Garcia-Valle, R., da Silva, L.C.P., Xu, Z. and Ostergaard, J. (2009) Smart Demand for Improving Short-Term Voltage Control on Distribution Networks. IET Generation, Transmission & Distribution, 3, 724-732.
http://dx.doi.org/10.1049/iet-gtd.2008.0621 - 2. Kezunovic, M. (2011) Smart Fault Location for Smart Grids. IEEE Transactions on Smart Grid, 2, 11-22.
http://dx.doi.org/10.1109/TSG.2011.2118774 - 3. Azizi, S., Gharehpetian, G.B. and Dobakhshari, A.S. (2013) Optimal Integration of Phasor Measurement Units in Power Systems Considering Conventional Measurements. IEEE Transactions on Smart Grid, 4, 1113-1121.
http://dx.doi.org/10.1109/TSG.2012.2213279 - 4. Dobakhshari, A.S. and Ranjbar, A.M. (2015) A Novel Method for Fault Location of Transmission Lines by Wide-Area Voltage Measurements Considering Measurement Errors. IEEE Transactions on Smart Grid, 6, 874-884.
http://dx.doi.org/10.1109/TSG.2014.2322977 - 5. Elkalashy, N.I., Lehtonen, M., Darwish, H.A., Izzularab, M.A. and Taalab, A.M.I. (2007) Modeling and Experimental Verification of High Impedance Arcing Fault in Medium Voltage Networks. IEEE Transactions on Dielectrics and Electrical Insulation, 14, 375-383.
http://dx.doi.org/10.1109/TDEI.2007.344617 - 6. Guan, H.X., Hao, G.G. and Zhao, Y. (2014) A Novel Fault Diagnosis Method for Smart Grid Based on Data Drive Theory. Advanced Science and Technology Letters, 73, 67-74.
- 7. Jiang, H.G., Zhang, J.J., Gao, W.Z. and Wu, Z.P. (2014) Fault Detection, Identification, and Location in Smart Grid Based on Data-Driven Computational Methods. IEEE Transactions on Smart Grid, 5, 2947-2956.
http://dx.doi.org/10.1109/TSG.2014.2330624 - 8. Gopakumar, P., Reddy, M.J.B. and Mohanta, D.K. (2015) Adaptive Fault Identification and Classification Methodology for Smart Power Grids Using Synchronous Phasor Angle Measurements. IET Generation, Transmission & Distribution, 9, 133-145.
http://dx.doi.org/10.1049/iet-gtd.2014.0024 - 9. Schavemaker, P.H. and Van der Slui, L. (2000) An Improved Mayr-Type Arc Model based on Current-Zero Measurements [Circuit Breakers]. IEEE Transactions on Power Delivery, 15, 580-584.
http://dx.doi.org/10.1109/61.852988 - 10. Terzija, V., Radojevic, Z.M. and Preston, G. (2015) Flexible Synchronized Measurement Technology-Based Fault Locator. IEEE Transactions on Smart Grid, 6, 866-873.
http://dx.doi.org/10.1109/TSG.2014.2367820 - 11. Lin, Y.-H., Liu, C.-W. and Chen, C.-S. (2004) A New PMU-Based Fault Detection/Location Technique for Transmission Lines with Consideration of Arcing Fault Discrimination—Part I: Performance Evaluation. IEEE Transactions on Power Delivery, 19, 1594-1601.
http://dx.doi.org/10.1109/TPWRD.2004.835276 - 12. Phadke, G., Thorp, J.S. and Adamiak, M.G. (1983) A New Measurement Technique for Tracking Voltage Phasors, Local System Frequency and Rate of Change of Frequency. IEEE Transactions on Power Apparatus and Systems, 5, 1025-1038.
http://dx.doi.org/10.1109/TPAS.1983.318043 - 13. Hampton, B. (1964) Flashover Mechanisms of Polluted Insulation. IEEE Proceedings, 111, 985-990.
- 14. Karady, G.G. (1999) Flashover Mechanism of Non-Ceramic Insulators. IEEE Transactions on Dielectrics and Electrical Insulation, 6, 718-723.
http://dx.doi.org/10.1109/94.798128 - 15. Rizk, F.A.M. (1981) Mathematical Models for Pollution Flashover. Electra, 78, 71-103.
- 16. Amarh, F. (2004) Electrical Transmission Line Flashover Prediction. Ph.D. Thesis Report, Power Systems Engineering Research Centre, Arizona State University.
http://www.pserc.wisc.edu - 17. Dhahbi-Megriche, N. and Beroual, A. (2000) Flashover Dynamic Model of Polluted Insulators under AC Voltage. IEEE Transactions on Dielectrics and Electrical Insulation, 7, 283-289.
http://dx.doi.org/10.1109/94.841822 - 18. Vapnik, V. (1998) Statistical Learning Theory. Wiley, New York.
- 19. Salat, R. and Osowski, S. (2004) Accurate Fault Location in the Power Transmission Line Using Support Vector Machine Approach. IEEE Transactions on Power Apparatus and Systems, 19, 979-986.
http://dx.doi.org/10.1109/TPWRS.2004.825883 - 20. Dash, P., Samantaray, S. and Panda, G. (2007) Fault Classification and Section Identification of an Advanced Series-Compensated Transmission Line Using Support Vector Machine. IEEE Transactions on Power Delivery, 22, 67-73.
http://dx.doi.org/10.1109/TPWRD.2006.876695 - 21. Mangasarian, O.L. and Lagrangian, P. (2001) Support Vector Machines. Journal of Machine Learning Research, 1, 161-177.