Journal of Power and Energy Engineering
Vol.03 No.09(2015), Article ID:60037,10 pages
10.4236/jpee.2015.39005
Optimal Design of a Multibody Self-Referencing Attenuator
Dongmei Zhou, Jennifer A. Eden
Department of Mechanical Engineering, California State University, Sacramento, CA, USA
Email: zhoud@ecs.csus.edu
Copyright © 2015 by authors and Scientific Research Publishing Inc.
This work is licensed under the Creative Commons Attribution International License (CC BY).
http://creativecommons.org/licenses/by/4.0/


Received 9 August 2015; accepted 26 September 2015; published 29 September 2015
ABSTRACT
The purpose of this paper is to determine the optimal size and number of tubes for a generic attenuator that is similar to Pelamis P2, the wave energy converter. Simulations using ANSYS Workbench, Design Modeler, and AQWA are performed to study the energy absorption at the nodes between the tubes. The analysis is limited to linearized hydrodynamic fluid waves loading on floating bodies by employing three-dimensional radiation/diffraction theory in regular waves in the frequency domain. Three sets of tests are conducted by varying total tube number, each tube length and the order of tubes with different lengths. After a systematic study in the frequency domain, the optimal size and number of the genetic attenuator is recommended.
Keywords:
Attenuator, Pelamis, Extraction Efficiency & Power, Numerical Simulation, Parametric Study

1. Introduction
Hydrokinetic wave energy is interchanging potential and kinetic energy, carried by the wave away from its origin as wave travels through space in time. Wind, creates the most common waves, surface wave and then sea swells. In order to convert the constant motion of ocean waves into usable energy such as electricity, the wave energy converter (WEC) must survive the hostile environment at extreme sea states, absorb the maximum wave power, and be cost-effective for commercial market. Considerable research and effort continue to focus on the following aspects: 1) design new wave energy converter [1] ; 2) create generic mode like wind energy [2] ; 3) conduct numerical benchmarking [3] [4] ; and 4) improve the design to be more cost-effective [5] . Excellent literature reviews on WEC systems can be found in the book edited by Cruz [6] and in the reviews on WEC technology by Falcão [7] , on hydrodynamic modeling methods by Ye and Yu [8] , and on numerical modeling of WEC arrays by Folley et al. [9] . This paper concentrates on the optimal design to improve cost efficiency of a generic attenuator that is similar to the wave energy converter, Pelamis.
The Pelamis is a particular type of ocean attenuator consisting of either four (P1 model) or five (P2 model) cylindrical sections linked together by universal joints that allow for motion with four degrees of freedom, as seen in Figure 1. The Pelamis faces the direction of the waves. As the waves pass down the machine, the sections bend. It is this bending movement that converts the energy from the waves into electricity by hydraulic jack systems housed at each joint. The P1 model was the world’s first full-scale offshore WEC to generate electricity and the first wave energy farm to successfully supply electricity to the national grid. The new P2 model has five tube sections with the power conversion modules integrated into them and it has an overall length of 180 m and a diameter of 4 m; each joint has four hydraulic motors. Both P1 and P2 models create the same amount of electricity, 750 kW.
Pelamis Wave Power Corporation has published several papers [10] -[14] , reporting the development progress from numerical modeling, experimental test to grid connection. The Pelamis Wave Power Corporation conducted their own in-house simulations using their own proprietary software to analyze various aspects of the structure in both linear and non-linear hydrodynamics. Yet, limited data on optimization from numerical modeling has been published. Most studies in other papers have comprised of performance comparisons between different types of WECs. It was found by O’Connor et al. [15] and Rusu et al. [16] that the Pelamis devices had the highest energy and economic returns at high resource locations but produced poor results at poor resource locations; therefore the location determines which WEC is the best option. The impact of electricity from the Portugal Pelamis Farm on current market prices was found to be negligible for wholesale electricity prices [17] . There was also research [18] done to create an optimum model for the hydraulic power take-off system of the Pelamis, yet no research has been done into optimizing the attenuator Pelamis device. This lack of knowledge and research, along with the excitement of a new technology lead to this paper.
The objective of this study is to determine the optimal design of a multibody self-referencing attenuator that is similar to the wave energy converter Pelamis P2. The software programs, ANSYS Workbench, Design Modeler, and AQWA [19] are used to determine the optimal length, diameter, and number of individual tubes for the attenuator based on parametric study. The analysis is limited to linearized hydrodynamic fluid waves loading on floating bodies by employing three-dimensional radiation/diffraction theory in regular waves in the frequency domain. Not only will this analysis provide the model with the overall highest energy extraction, it will also provide the model with the greatest efficiency over the range of frequencies experienced off the coast of Scotland.
2. Numerical Method
The development of a WEC starts from concept and design, then numerical modeling, model testing in wave basin, testing under real sea conditions, and finally to commercial stage. It is a long, difficult, and expensive process. Numerical modeling has the advantage of providing quick and inexpensive evaluation and optimization
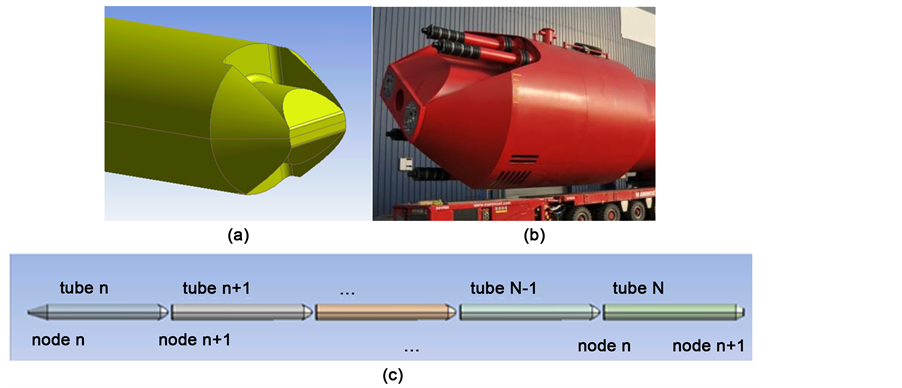
Figure 1. Attenuator view: (a) created simulation model; (b) actual device; (c) control model.
of designs. In this study, ANSYS AQWA, an industry standard hydrodynamic software package, is employed to capture the behavior of the attenuator by simulating the interaction between waves, the WEC device and the power take-off mechanism. The software ANSYS AQWQ can simulate linearized hydrodynamic fluid wave loading on floating bodies by employing three-dimensional radiation/diffraction theory in regular waves in the frequency domain. Frequency domain analysis is the first step in the hydrodynamic modeling process by assuming everything is linear. This analysis is especially useful in geometry optimization routines and thus it is employed in this paper. However, it should be fully aware the limitations of this analysis method compared to realistic conditions.
2.1. Linear (Airy) Theory and Wave Data
The resource, surface gravity waves can be linearized if a/λ << 1 and a/H << 1, where the variable, a, is the wave amplitude (m), λ is the wavelength (m) and H is the uniform water depth (m). Typically the surface gravity waves of oceans have wavelengths between 30 - 40 m, enabling the water surface tension to be neglected as it pertains to wavelengths of less than 5 - 10 cm. As the attenuator is deployed at water depths greater than 50 m it is classified as a deep-water device due to H > λ/3. It is also noted that as the frequency is much larger than the Coriolis frequency, the wave motion is unaffected by Earth’s rotation. Assumptions made here are that 1) the water is incompressible (constant density) and irrotational; 2) gravity is the only external force; and 3) viscosity can be neglected. For the regular wave based on linear theory, the power obtained from ocean per meter of wave front is the total energy of the system (kinetic plus potential) per unit horizontal area multiplied by the phase speed to yield the following relation:
 (1)
(1)
where, Pt is power per unit length of wave front (W/m), ρ is density of seawater (kg/m3), g is gravity (m/s2), a is the wave amplitude (m), and ω is angular frequency (rad/s).
The European Marine Energy Center (EMEC) [20] compiled the wave data from three data-well directional waverider buoys. The EMEC determines the instantaneous data for the maximum wave height, the significant wave height, the maximum wave period, and the significant wave period. It also provides a graph for a 24 hour time period and this data can be used to determine the current energy production of the device. As the actual attenuator Pelamis P2 is located off the west coast of Orkney, Scotland, according to the Scottish Government website [21] the annual mean wave height for the region is 2.0 - 2.4 m; therefore from here on, a significant wave height of 2.2 m, resulting in an amplitude a of 1.1 m, is used in the simulations.
2.2. Evaluation of Pelamis Performance
The multibody self-referencing attenuator generates electricity based on the relative motion between its tubes. The attenuator moves with two degrees of freedom to capture energy: pitch and heave, given that this study is restricted to the case in the x-z plane, with z as the vertical axis and x as the axis passing through the head and tail of a tube. Thus for each tube there are two dynamic equations, one for moment due to pitch and one for force due to heave. In order to find the potential power output from the attenuator, the forces and moments acting on the attenuator tube need to be defined. As shown in Figure 2, the vertical hydrodynamic force, Fn, on tube n is a resultant force of wave pressure. The pressure can be resolved from the Bernoulli’s equation after the velocity potential is determined. The reaction force, Rn, exerted on node n represents the power take-off mechanism. The hydrodynamic moment, Mn, about the midpoint of tube n can be expressed in terms of the angular displacement, Θn.
In rotational systems, the power is derived as the product of angular velocity and torque, or in our case the product of angular frequency ω and the moment Mn. Thus the power absorbed by attenuator at hinge n is the product of the extraction rate at node n and the angular displacement of tubes n and n − 1. The time averaged power extraction derived by Flanes [22] and Mei et al. [23] , is the product of the angular displacement squared divided by two, the extraction rate and the real portion of the angular rotation squared as:
 (2)
(2)
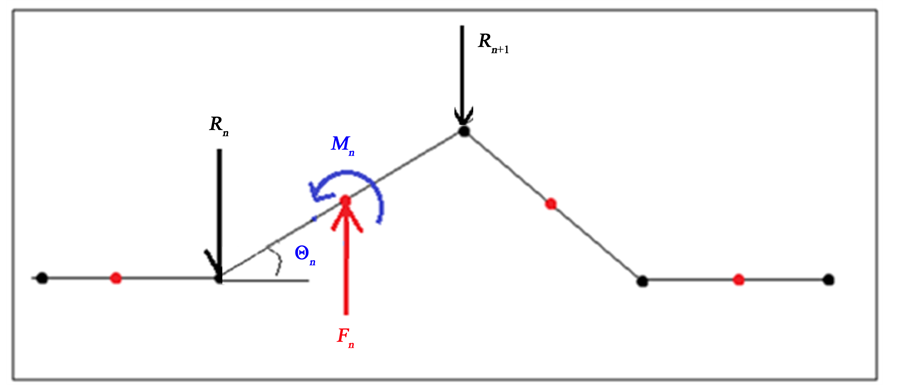
Figure 2. Illustration for force Fn; moment Mn; reaction force Rn; angular displacement Θn.
where  in the unit of Nm/(m/s) is the extraction rate between tubes and Bn/Ln(m/m) is the tube amplitude. The extraction rate
  is equivalent to the amount of radiation damping in the global x-direction. The overall efficiency of the system at a particular frequency is defined as the mean power Pn that is extracted at a node from Equation (2) divided by the total power of the system Pt that is defined in Equation (1), yielding
 (3)
(3)
2.3. Modeling Using ANSYS AQWA and Validation
In the simulation process using computer software ANSYS AWQA, a computer model of attenuator is first created by use of the ANSYS Design Modeler software to generate three-dimensional tubes as shown in Figure 1. This model is then fed to the hydrodynamics package. Next, the hydrodynamics package is applied and numerical simulations are performed. Finally, Excel is used to post process the data provided by ANSYS AQWA software. A summary of input parameters to calculate the power, Pn, extracted from the attenuator using Equation (2) and the efficiency, eff, using Equation (3) is displayed in Table 1. The extractions rates  are determined from the ANSYS AQWA software via the Radiation Damping. The ratios of amplitude of the center of mass for tube n (midpoint of the tube) to the length of tube n, Bn/Ln, are also determined from the ANSYS AQWA software via the RAOs (Response Amplitude Operators); the results are generated in terms of m/m. A large enough range for the frequency f is selected to encompass the range of efficient energy capture for all design models of attenuator.
To validate the numerical model, ANSYS AQWA is applied to the control model T5L36D4, an attenuator with 5 tubes, a 36 m tube length, and a 4 m tube diameter as defined in Table 3. The actual Pelamis P2 currently in production off the west coast of Scotland at a frequency of 0.15 Hz. Pelamis Wave Power [24] states that the actual Pelamis P2 model experiences efficiencies around 70% in all sea states. The validation here is to examine how varying the mesh selection affects the efficiency value of the WEC system. It should be noted that the ANSYS program demands the default tolerance be no greater than 0.6 times the maximum element size. The validation results are presented in Table 2, and it can be observed that the efficiencies are all within 2.5% of one another and in agreement with the measured efficiency data 70%. The amount of difference appears to relate with the difference between the maximum element size and the default tolerance; the closer the maximum element size and the default tolerance values are, the larger the change in efficiency is. Figure 3 shows the effect of altering mesh size on the efficiency eff (%) of the attenuator at different frequencies. From Figure 3, it can be seen that the shape of the curves is consistent because they all appear to overlap one another. As the efficiency curves do not change and 2.5% difference in efficiency is such a small value, it is concluded that the numerical simulation results are independent of the mesh size.

Table 1. Input parameters to calculate overall efficiency.
Table 2. Validation results with altering mesh size at frequency f = 0.15 Hz.
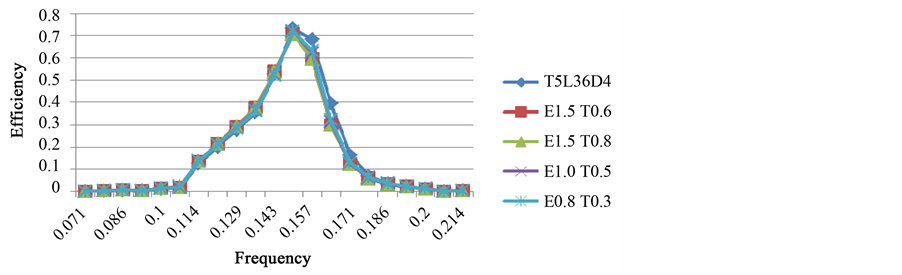
Figure 3. Effect of altering mesh size on efficiency of attenuator at different frequencies.
3. Results and Discussion
3.1. Test Models of Attenuator Design
The attenuator uses resonance to increase power capture of small waves. The default setting of the attenuator is non-resonant, allowing it to withstand large swells. However, the joints can be actively controlled by its power take off system to create a cross-coupled resonant response. Optimal design of attenuator is based on such a principle that the device must be designed to operate efficiently within the frequency range and power level. In an attempt to standardize the amount of raw materials required for each model, the overall length of 180 m and weight of 1350 tons are chosen to maintain the same overall length and weight as the current Pelamis P2 model.
A summary of all test models is provided in Table 3. The first set of test models varies the number of tubes for each structure while maintaining a diameter of 4 m. The second set of test models uses the same number of tubes and lengths as the first set, but it varies the tube diameter. The third set of models takes the most efficient model from sets one and two, which is the model T6L30D5 as shown later, and then determines how altering the length of each tube affects the efficiency. The third set contains the model T6D5 Increasing, where the tubes increase in length (L1 < L2 < L3 < L4 < L5 < L6) and the model T6D5 Decreasing, where the tubes decrease in length (L6 < L5 < L4 < L3 < L2 < L1). For these two models (T6D5 Increasing and Decreasing), the ratio of 1:2:3:4:5:6 with a total of 21 units, does not divide evenly into the total length of the structure (180 m), resulting in 8 - 12/21. To overcome this, this remainder of 12 in 8 - 12/21 is split evenly amongst the six tubes. Thus, the length of each tube in meter is 10:18:26:34:42:50 for model T6D5 Increasing and 50:42:34:26:18:10 for model T6D5 Decreasing. The model T6D5 SBS has the end tubes that are longer than the center tubes (L1 > L2 > L3 = L4 < L5 < L6) and the model T6D5 BSB has the middle tubes that are longer than the end tubes (L1 < L2 < L3 =
Table 3. Summary of three sets of test models including control model T5L36D4.
L4 > L5 > L6). For these two models (T6D5 SBS and BSB), the ratio of 1:2:3:3:2:1 with a total of 12 units does divide evenly into the total length, resulting in the lengths of each tube to be, in meters, 15:30:45:45:30:15 for the model T6D5 SBS and 45:30:15:15:30:45 for the model T6D5 BSB.
3.2. Test Set One Results
Test set one models vary the number of tubes for each structure while maintaining a diameter of 4 m. The peak efficiencies for each model, along with the corresponding frequencies are provided in Table 4. The efficiency of the actual Pelamis P2 model has been stated to be around 70%. The maximum efficiency for the control model of our attenuator is calculated to be 73.27%. This is the theoretical maximum of the device and does not account for additional efficiency losses generated by the conversion of mechanical work to electrical work. With the exception of model T8L22.5D4, the efficiency for every other model is lower than that of the control model. As shown in Table 4 and Figure 4, as the tube length increases (i.e., decrease in tube number), the efficiency of the system drastically decreased. The results do not show any correlation for the decrease in tube length (or increase in tube number) and efficiency; the efficiency of T6L30D4 is slightly lower than that of control model T5L3D4, while the efficiency of T8L22.5D4 is slightly higher than that of control model by 1.88%. Also of note is that the frequency corresponding to the peak efficiency gradually increases for the first four models, and decreases slightly for the last model. As is evident in Figure 4 that the range of frequency for available energy capture is widest for models T4L45D4, T5L36D4, and T6L30D4.
Given the restrictions of maintaining the overall length and weight of the attenuator structure, the efficiencies are highest with a smaller tube length (i.e., larger number of tubes). The T8L22.5D4 model would be the best choice from this test set at 1.88% more efficient than the control model. However, devices with more moving parts require more maintenance and can experience a greater loss in efficiency due to friction when converting the mechanical energy to electrical energy, therefore it may not be cost effective from this perspective to increase the amount of moving parts associated with additional nodes while only achieving a 1.88% increase in
Table 4. Test set-one: maximum efficiencies and corresponding frequency for attenuators with 4 m diameter.
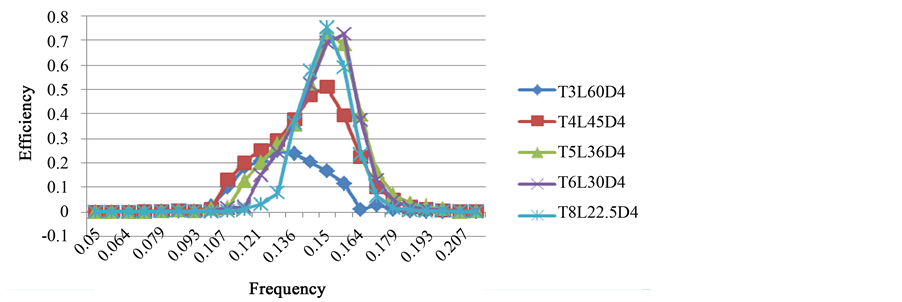
Figure 4. Test set one: efficiency curves for attenuators with 4 m diameter (T = tube number, L = tube length).
efficiency from the control model.
3.3. Test Set Two Results
Test set two demonstrates the effects of tube length at different diameter of the structures. The peak efficiencies for each model, along with the corresponding frequencies are provided in Table 5. For the set of models with a 3 m diameter, there is a direct correlation between the tube length and the maximum efficiency; as the tube length decreases (i.e., increase in tube number) the efficiency increases. Yet all these values are significantly lower than those seen in Test Set One. By observing Table 5 and Figure 5, no direct correlation is found between tube length and the frequency where maximum efficiency occurs; T4L45D3, T5L36D3, and T6L30D3 occur at the same frequency of 0.143 Hz, while T3L60D3 and T8L22.5D3 occur the same (but higher) frequency of 0.163 Hz.
For the set of models with a diameter of 5 m, the model with tube length of 30 m (six tubes, model T6L30D5) has the highest efficiency. It is interesting to note that the efficiencies for T3L60D5, T4L45D5, and T5L36D5 are lower than their counterparts in Test Set One, yet the efficiencies for T6L30D5 and T8L22.5D5 are higher than those in Test Set One, by 6.39% and 2.80% respectively. Therefore, additional models are created for tube lengths of 30 m and 22.5 m to have a diameter of 6 m; these efficiencies are lower than those of the 5 m diameter models. From Table 5 and Figure 6, it is observed that as the tube length decreases (i.e., the tube number increases) at the same diameter 5 m, the frequency where the maximum efficiency occurs, increases for the first two models and then holds at the same value of 0.157 Hz.
For the effect of tube diameter, it is observed that for a given tube length, there is an optimum tube diameter. By making the structure narrower, the tube slices through the oncoming waves rather than the wave lifting the tubes to create sufficient angular rotation about the hinges. The narrower models experience less hull pressure from the water, and thus it creates less of a hydrodynamic moment and therefore it absorbs less energy. This is the same principle used when oceangoing vessels are designed for speed. The reason that an increase in diameter reduces the efficiency of the system is theorized here that the first tube(s) does experience a higher vertical pressure but then it experiences an effect called “slamming” [25] , wherein the tubes experience a large force upon impact with the water surface. This slamming would then result in the generation of a large amount of radiation waves, thereby taking the structure out of resonance and decreasing its overall efficiency.
3.4. Test Three Results
Based solely on maximum efficiency, from Test Set One and Test Set Two, the model T6L30D5 with 6 tubes, a
Table 5. Test set two: maximum efficiencies and corresponding frequency for attenuators at different tube diameters.
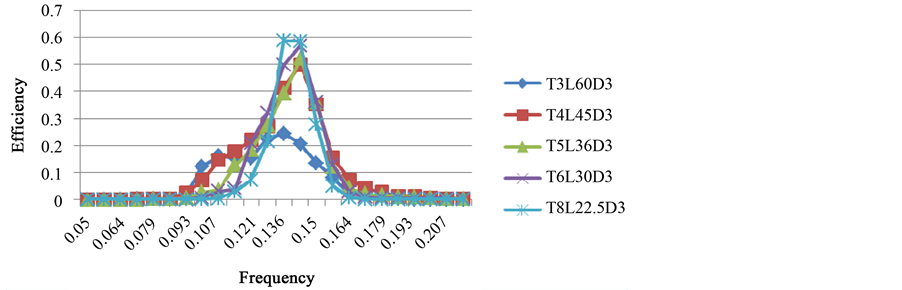
Figure 5. Test set two: efficiency curves for attenuators with 3 m diameter (T = tube number, L = tube length).
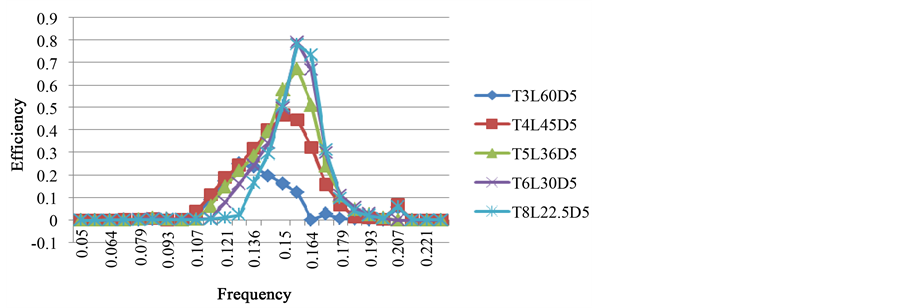
Figure 6. Test set two: efficiency curves for attenuators with 5 m diameter (T = tube number, L = tube length).
30 m tube length, and a 5 m tube diameter, is the highest performer with an efficiency of 78.905% and is used for Test Set Three. As shown in Table 6 and Figure 7 in all four cases for test set three, the maximum efficiency is greater than that of constant tube length model T6L3D5. The T6D5 SBS model (middle tubes longer than the end ones) is the highest performer, 94.72%, followed by the T6D5 Increasing model, 85.41%, which in turn is closely followed by the T6D5 BSB model, 85.10%; the T6D5 Decreasing model was only slightly more efficient than the T6L30D5 model. The two models with the highest efficiency occur at the same frequency of
Table 6. Test set three: maximum efficiencies and corresponding frequency for attenuators at different tube arrangements.
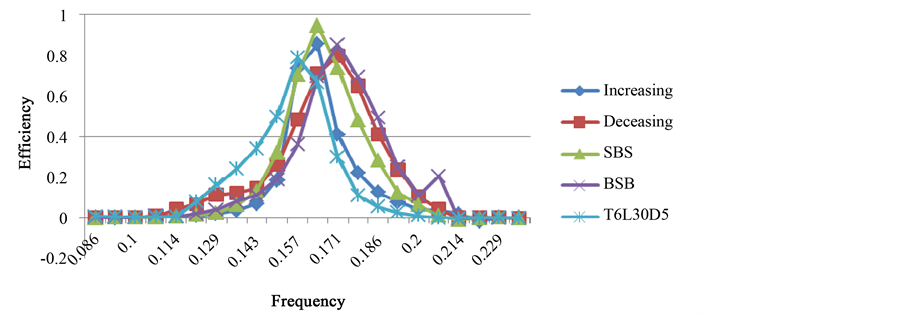
Figure 7. Test set three: T6D5 series of efficiency curves.
0.164 Hz and the two with the lower efficiencies occur at the same frequency of 0.171 Hz, yet all four models experienced peak efficiencies at higher frequencies compared to the model T6L3D5 with consistent tube lengths, f = 0.156 Hz.
While the short end tubes of the T6D5 SBS model have a low damping value, the middle tubes act as sort of vertical mooring structure that allow for these shorter end tubes to generate large vertical elevation which increase the angular rotation at the hinges, resulting in larger power generation and higher efficiency. The model T6D5 BSB operates on an opposing principle; there is an even balance of high damping and low elevation with low damping and high elevation. The large end tubes create a large amount of damping and experience slight elevation, while the smaller tubes connected to them are able to increase their elevation and angular rotation, resulting in high power generation and efficiency values. The model T6D5 Decreasing has its largest tubes at the head of the structure; this causes a greater amount of wave damping, leaving less wave height available for energy extraction at later hinges. The very opposite of this principle leads to the model T6D5 Increasing absorbing a larger amount of energy, as the smaller front tubes create less wave damping and hence leave more of the wave to be extracted at later hinges.
Thusly, out of all three test sets, the best model simulation based solely on maximum efficiency would be the model T6D5 SBS, having six tubes, a diameter of five meters, and the tubes varying in size, with the middle tubes longer than the end tubes (L1 < L2 < L3 = L4 > L5 > L6). However, selecting a model based on overall maximum efficiency is not always the best decision. It is important to create the model with the characteristics of the environment in mind, specifically by knowing what frequency range is experienced at the proposed location.
3.5. Effect of Frequency and a Case of Application
Ocean locations have energy distributed over a range of wave heights and periods, or frequencies. Off the coast of Scotland where the actual Pelamis P2 model resides, the ocean state experiences a mean wave period between 8.1 s in winter and 6.3 s in summer which corresponds to frequencies of 0.123 Hz and 0.159 Hz, respectively, [26] . With this in mind, the optimal design of the attenuator for this site needs to capture the most energy over that entire range. While all models (diameters 3 m to 5 m) have their peak efficiency within that range, the efficiency of the three-meter diameter models is too small for these devices to be considered viable; when the diameter is increased the frequency is increased as well to be on the edge of the frequency range observed off the coast of Scotland. The six-meter diameter models are out of the range altogether. Therefore, the four-meter diameter models are the best fit for these constraints. Of these five models, the T3L60D4 and T4L45D4 models produced significantly less efficiencies and will be excluded from consideration. While it has the higher efficiency, the T8D22.5L4 model also has a narrower frequency range and it would not produce any viable energy during the winter months. The T8D22.5L4 mode is therefore excluded from consideration. Between the remaining models, T5L36D4 and T6L30D4, the control model T5L36D4 has the higher efficiency and it absorbs viable energy over greater frequency range that includes the frequencies off the coast of Scotland. By combining this with the results from Test Set Three, the optimal design of the attenuator that is being deployed off the coast of Scotland would be the model T5D4 SBS model, a device containing five tubes with four-meter diameters whose tube lengths increase then decrease (L1 < L2 < L3 > L4 > L5), given the restrictions of 180 m overall length and 1350 tons overall weight.
4. Conclusions
In this study, the wave energy converter, amultibody self-referencing attenuator that is similar to the actual Pelamis P2 is studied using numerical modeling to determine the optimal size and number of the attenuator structure. Three sets of tests are conducted by varying total tube number, each tube length and the order of each tube with different length. The analysis is based pm linearized hydrodynamic fluid waves loading on a floating body by employing three-dimensional radiation/diffraction theory in regular waves in the frequency domainand the conclusion is drawn as follows.
1) Given the restrictions of maintaining the overall length and weight of the attenuator structure, the efficiencies are highest with a smaller tube length (i.e., larger number of tubes).
2) For a given tube length, there is an optimum tube diameter corresponding to the maximum efficiency.
3) Out of all three test sets, the best model simulation based solely on maximum efficiency of 94.74% would be the model T6D5 SBS with six tubes, a 5 m diameter, and the tubes varying in size, with the middle tubes longer than the end tubes (L1 < L2 < L3 = L4 > L5 > L6).
4) Given the restrictions of 180 m overall length and 1350 tons overall weight, the optimum design of the attenuator to be deployed off the coast of Scotland is the model T5D4 SBS with five tubes of four-meter diameters, whose tube lengths increase then decrease (L1 < L2 < L3 > L4 > L5).
The future work after this paper will be to credit the optimal design in the time-domain analysis by introducing nonlinearities and viscous effect with cost-effective in mind. It is expected that the extraction power and efficiency will be decreased by 3% - 5% after introducing nonlinearities and viscous effect. However, the results and conclusion should hold for irregular waves if the range of wave frequencies is appropriate.
Acknowledgements
The research project was partially supported by 2013-2014 Provost’s Research Fellow program and Provost’s Research Incentive Fund Summer 2014.
Cite this paper
DongmeiZhou,Jennifer A.Eden, (2015) Optimal Design of a Multibody Self-Referencing Attenuator. Journal of Power and Energy Engineering,03,59-69. doi: 10.4236/jpee.2015.39005
References
- 1. Leybourne, M., Bahaj, A.S., Minns, N. and O’Nians, J. (2014) Preliminary Design of the OWEL Wave Energy Converter Pre-Commercial Demonstrator. Renewable Energy, 61, 51-56.
http://dx.doi.org/10.1016/j.renene.2012.08.019 - 2. Ruehl, K., Brekken, T.A., Bosma, B. and Paasch, R. (2010) Large-Scale Ocean Wave Energy Plant Modeling. 2010 IEEE Conference on Innovative Technologies for an Efficient and Reliable Electricity Supply, Waltham, Massachusetts, 27-29 September 2010, 379-386.
http://dx.doi.org/10.1109/citres.2010.5619775 - 3. Babarita, A., Halsb, J., Muliawanb, M.J., Kurniawanb, A., Moanb, T. and Krokstadc, J. (2012) Numerical Benchmarking Study of a Selection of Wave Energy Converters. Renewable Energy, 41, 44-63.
http://dx.doi.org/10.1016/j.renene.2011.10.002 - 4. Silva, D., Rusu, E. and Soares, C.G. (2013) Evaluation of Various Technologies for Wave Energy Conversion in the Portuguese Nearshore. Energies, 6, 1344-1364.
http://dx.doi.org/10.3390/en6031344 - 5. Yu, Y.-H., Li, Y., Hallett, K. and Hotimsky, C. (2014) Design and Analysis for a Floating Oscillating Surge Wave Energy Converter. ASME 2014 33rd International Conference on Ocean, Offshore and Arctic Engineering, San Francisco, 8-13 June 2014, V09BT09A048.
http://dx.doi.org/10.1115/omae2014-24511 - 6. Cruz, J. (2008) Ocean Wave Energy. 1st Edition, Springer, Berlin.
http://dx.doi.org/10.1007/978-3-540-74895-3 - 7. Falcão, A.F.D.O. (2010) Wave Energy Utilization: A Review of the Technologies. Renewable and Sustainable Energy Reviews, 12, 899-918.
http://dx.doi.org/10.1016/j.rser.2009.11.003 - 8. Li, Y. and Yu, Y.-H. (2012) A Synthesis of Numerical Methods for Modeling Wave Energy Converter-Point Absorbers. Renewable and Sustainable Energy Reviews, 16, 4352-4364.
http://dx.doi.org/10.1016/j.rser.2011.11.008 - 9. Folley, M., Babarit, A., Child, B., Forehand, D., O’Boyle, L., Silverthorne, K., Spinneken, J., Stratigaki, V. and Troch, P. (2012) A Review of Numerical Modelling of Wave Energy Converter Arrays. ASME 2012 31st International Conference on Ocean, Offshore and Arctic Engineering, Vol. 7: Ocean Space Utilization; Ocean Renewable Energy, Rio de Janeiro, 1-6 July 2012, 535-545.
http://dx.doi.org/10.1115/omae2012-83807 - 10. Pizer, D.J., Retzler, C.H. and Yemm, R.W. (2000) The OPD Pelamis: Experimental and Numerical Results from the Hydro-Dynamic Work Program. 4th European Wave Energy Conference, Aalborg, 4-6 December, 2000, 227-234.
- 11. Retzler, C.H. and Pizer, D.J. (2001) The Hydrodynamics of the Pelamis Wave Energy Device: Experimental and Numerical Results. Proceedings of OMAE’01, 20th International Conference on Offshore Mechanics and Arctic Engineering, Rio de Janeiro, 3-8 June 2001, 31-35.
- 12. Carcas, M.C. (2003) The OPD Pelamis WEC: Current Status and Onward Programme. International Journal of Ambient Energy, 24, 21-28.
http://dx.doi.org/10.1080/01430750.2003.9674899 - 13. Henderson, R. (2008) Case Study: Pelamis. In: Cruz, J., Ed., Ocean Wave Energy, Springer, Berlin, 169-188.
- 14. Yemm, R.W., Pizer, D.J., Retzler, C.H. and Henderson, R. (2012) Pelamis: Experience from Concept to Connection. Philosophical Transactions of the Royal Society A, 370, 365-380.
http://dx.doi.org/10.1098/rsta.2011.0312 - 15. O’Connor, M., Lewis, T. and Dalton, G. (2013) Techno-Economic Performance of the Pelamis P1 and Wavestar at Different Ratings and Various Locations in Europe. Renewable Energy, 50, 889-900.
http://dx.doi.org/10.1016/j.renene.2012.08.009 - 16. Dunnett, D. and Wallace, J. (2009) Electricity Generation from Wave Power in Canada. Renewable Energy, 34, 179-195.
http://dx.doi.org/10.1016/j.renene.2008.04.034 - 17. Palha, A., Mendes, L., Fortes, C., Brito-Melo, A. and Sarmento, A. (2010) Modelling the Economic Impacts of 500 MW of Wave Power in Ireland. Renewable Energy, 25, 62-77.
http://dx.doi.org/10.1016/j.renene.2009.05.025 - 18. Henderson, R. (2006) Design, Simulation, and Testing of a Novel Hydraulic Power Take-Off System for the Pelamis Wave Energy Converter. Renewable Energy, 31, 271-283.
http://dx.doi.org/10.1016/j.renene.2005.08.021 - 19. ANSYS (2013) ANSYS AQWA.
https://support.ansys.com/portal/site/AnsysCustomerPortal/template.fss?file=/
prod_docu/15.0/Aqwa%20Users%20Manual.pdf - 20. EMEC10, Wave Data.
http://www.emec.org.uk/facilities/live-data/wave-data/ - 21. The Scottish Government (2010) 3.6 West of Shetland.
http://www.scotland.gov.uk/Publications/2010/09/17095123/14 - 22. Flanes, J. (2002) Ocean Waves and Oscillating Systems: Linear Interactions Including Wave-Energy Extraction. Cambridge University Press, Cambridge.
http://dx.doi.org/10.1017/CBO9780511754630 - 23. Mei, C., Stiassnie, M. and Yue, D. (2005) Theory and Application of Ocean Surface Waves, Part 1: Linear Aspects. World Scientific Publishing, Singapore.
- 24. Pelamis Wave Power, Scottish Power Renewables at EMEC.
http://www.pelamiswave.com/our-projects/project/2/ScottishPower-Renewables-at-EMEC - 25. Kim, S., Novak, D., Weems, K. and Chen, H. (2008) Slamming Impact Design Loads on Large High Speed Naval Craft. ABS Technical Papers.
- 26. The Scottish Government (2008) Chapter 2 Physical Characteristics and Modeling of the Marine Environment.
http://www.scotland.gov.uk/Publications/2008/04/03093608/13