Journal of Materials Science and Chemical Engineering
Vol.1 No.6(2013), Article ID:39493,8 pages DOI:10.4236/msce.2013.16005
Crystallographic Study of the TiO2 Obtained by Different Synthesis Methods
1División de Investigación y Posgrado, Facultad de Ingeniería, Universidad Autónoma de Querétaro, Querétaro, México
2Centro de Física Aplicada y Tecnología Avanzada, UNAM Campus Juriquilla, Querétaro, México
3CBTis 145, San Juan del Río, Querétaro, México
Email: *alejandro.cortez@uaq.mx
Copyright © 2013 Fidel Alejandro Cortez-Lorenzo et al. This is an open access article distributed under the Creative Commons Attribution License, which permits unrestricted use, distribution, and reproduction in any medium, provided the original work is properly cited.
Received August 7, 2013; revised September 7, 2013; accepted September 14, 2013
Keywords: Anatase; Sol-Gel; Hydrothermal Assisted Microwaves; Crystallization
ABSTRACT
In this work, the crystal structure of titanium dioxide was studied, and the effect of the different synthesis routes on the microstructure and morphology of the nanostructures was analyzed. Samples characterization was carried out by X-ray diffraction by powders (XRD) to determine the different crystalline phases contented in the samples and using scanning electron microscopy (SEM), the morphology and topology of all samples were studied. XRD results were analyzed through Eva provided by Bruker to determine the average crystallite size. The results portrayed here showed that all the synthesis process produced anatase nanostructures with an average crystallite size smaller than 27 nm. Synthesized powders presented similar morphologies in all cases and they were homogeneous in their chemical composition.
1. Introduction
The development of photocatalysis has been the focus of considerable attention in recent years with photocatalysis being used in a variety of products across a broad range of research areas, especially including environmental and energy-related fields [1,2]. According to Mo et al. (2009), the common photocatalysts are primarily metal oxides or sulphides and have been developed for various applications, including the degradation of volatile organic compounds (VOC’s). Metal oxides or sulfur are those listed as TiO2, ZnO, ZrO2, SnO2, WO3, CeO2, Fe2O3, Al2O3, ZnS y CdS [3]. One of the most useful is the TiO2 because it exhibits excellent optical, electrical, photocatalytic and thermal properties and also poses a relatively low cost [4]. Besides its application as a photocatalyst [1,2,5-7], TiO2 has been used as solar cells [8] and as functional biomaterials [9].
Regarding its preparation methods, TiO2 can be obtained through various chemical synthesis routes and different physicochemical properties and controlled morphology have been generated with several advantages. The methods used to obtain this catalyst are: Dip-coating, sol-gel, sputtering, chemical vapor deposition (CVD), hydrothermal [2] and others. In recent years, one modification of the hydrothermal method is the so called hydrothermal microwaves-assisted synthesis methods and its potential applications are been deeply investigated [4,5,7,10], because this new method allows a considerable reduction of the reaction time and as a consequence, an important decrease in the heat provided during the synthesis process. Moreover, the technology and devices required to carry out this synthesis methods is reasonably priced and relatively easy to use. Currently, there is a tendency to improve the synthesis conditions in order to manipulate the morphology, dimensions and crystalline preferential orientation of the synthesized nanomaterials [11-17] which have a direct impact on the properties of the products.
This work has been focused to analyze the effect of different synthesis methods on the crystal structure and morphology of TiO2 in its anatase phase; specifically, the sol-gel method, sol-gel method assisted by microwaves and the hydrothermal method assisted by microwaves.
2. Experimental Procedure
2.1. Synthesis through Sol-Gel Method
The synthesis of TiO2 by the sol-gel method was carried out using dissolution of titanium isopropoxide in isopropyl alcohol under an inert nitrogen atmosphere and mechanical stirring to obtain a sol; then, deionized water was added with continued stirring to obtain a suspension. The powders obtained were filtered, dried at room temperature, and then dried at 110˚C for 18 hours in a furnace and finally, calcinated at 550˚C for 4 hours.
2.2. Synthesis through Sol-Gel Method Assisted by Microwaves
The anatase synthes is by this method combines the solgel method with micro waves radiation as follows: first, develops the sol-gel method as mentioned above until the stage in which the suspension was obtained. This suspension was immediately put inside a microwave oven Synthos 3000, and the chemical reaction started. The energy required for the reactions was provided by the microwaves which were inducted with potency of 600 kW from 5 to 20 minutes to obtain anatase powders, and were subsequently dried at room temperature.
2.3. Synthesis through Hydrothermal Method Assisted by Microwaves
Anatase obtained by this means was made from the reaction of TiOCl2, which was obtained from TiCl4. TiOCl2 was mixed with urea in a molar ratio of 5:1; this mixture was exposed to the microwaves radiation using the microwave oven Synthos 3000 with a potency of 950 kW for various reaction times from 2 to 9 minutes. The powders obtained were filtered and washed using double distilled water and finally dried in a furnace for 12 h.
2.4. Labeling of the Samples
According to anatase quality, samples for each method of synthesis were selected and labeled as follows: sol-gel method (SG1), sol-gel method assisted by microwaves (SGMW1), (SGMW2), and hydrothermal method assisted by microwaves (MW6), (MW9).
2.5. Samples Characterization
All the samples obtained were characterized by means of X-ray diffraction by powders (XRD) using a diffractometer Bruker D8 Advance. For all the analyses, an accelerating voltage of 30 kV was used to produce the CuK α radiation of 1.5406 Å. The XRD analyses were performed in the 2θ range from10 to 80 degrees.
The morphology and particle size of the powder was observed by scanning electron microscopy (SEM) Philips model XL30ESEM. Besides, qualitative elemental microanalysis was performed by EDS. The samples were previously glued with a double-faced graphite tape and covered by a thin layer of Au deposited by sputtering.
3. Results and Discussion
The crystal structure of the samples obtained was analyzed using the technique of X-ray diffraction by powders. Diffractograms were obtained for each of the samples and they are portrayed in the figures from 1 through 5. In all cases, titanium oxide in the phase of anatase was identified using de ICDD power diffraction file (PDF) bank. The more relevant signals detected were at 25.3˚, 48.2˚ and 37.8˚ in 2θ related to the (101), (200) and (004) crystal planes respectively.
Figure 1 displays the diffractogram obtained of the sample made by the sol-gel method which presents signals well defined with a high intensity, a relatively flat baseline and narrow XRD signals which are indicative of small crystallites and a good crystalline quality. The determination of the crystallite size was done by the Scherrer formula. The Scherrer formula gives a correspondence between the crystallite size LC and the full width at half maximum FWHM
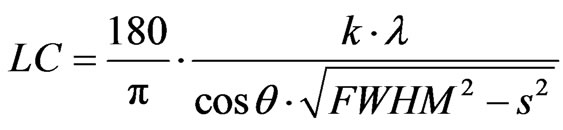 . (1)
. (1)
• 180/π converts the FWHM from degree to radian;
• λ is the wavelength of the radiation; it is expressed in angstrom, LC is thus also in angstrom;
• k is the Scherrer constant, a shape factor, the default value is 0.89;
• S is the instrumental broadening; default is 0.
All the XRD results were analyzed by the Eva computer program provided by Bruker to determine the average crystallite size. Calculation process of the average crystallite size made using the Eva program showed an average crystallite size of 26.53 nm.
The crystalline phase obtained was identified by comparison with the corresponding PDF 065-5714 anatase phase of titanium oxide. A small amount of rutile was also detected by the PDF 88-1953. The signals at 27.54˚ and 36.106˚ correspond to this crystal phase.
Figures 2 and 3 depict the diffractograms recorded of the samples made by the sol-gel method assisted by microwaves. The Figure 2 corresponds to SGMW1 and it showed aminor crystalline quality compared with that sample obtained by sol-gel. The intensity of the signals is quite lower, the XRD signal is significantly broader and the baseline is considerably irregular and tilted. This diffractogram could be the result of the combination of a crystalline phase with small crystallites and an amorphous phase. In the other hand, the diffractogram of
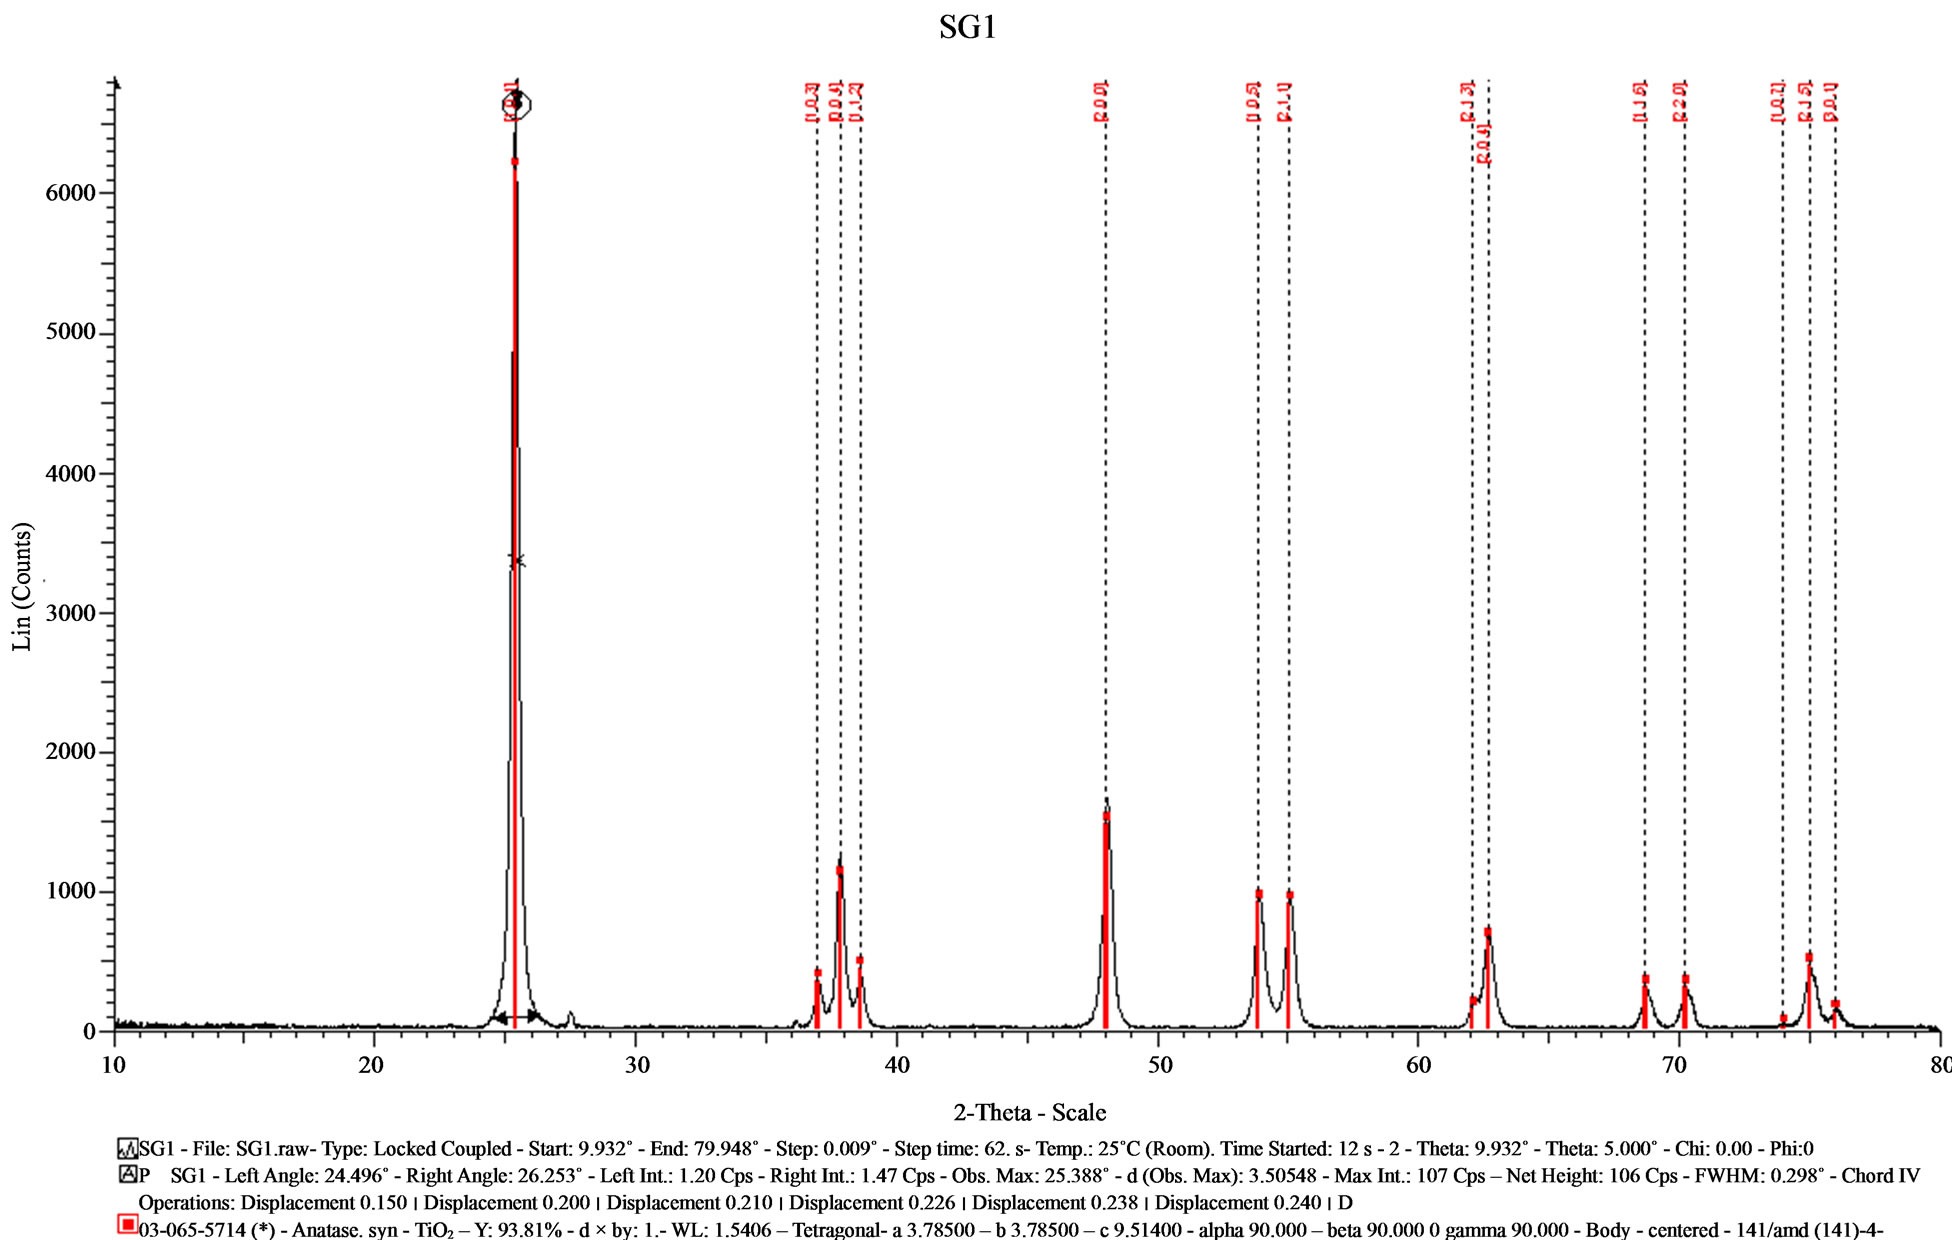
Figure 1. X-ray diffractogram of the sample (SG1) synthesized by the sol-gel method.
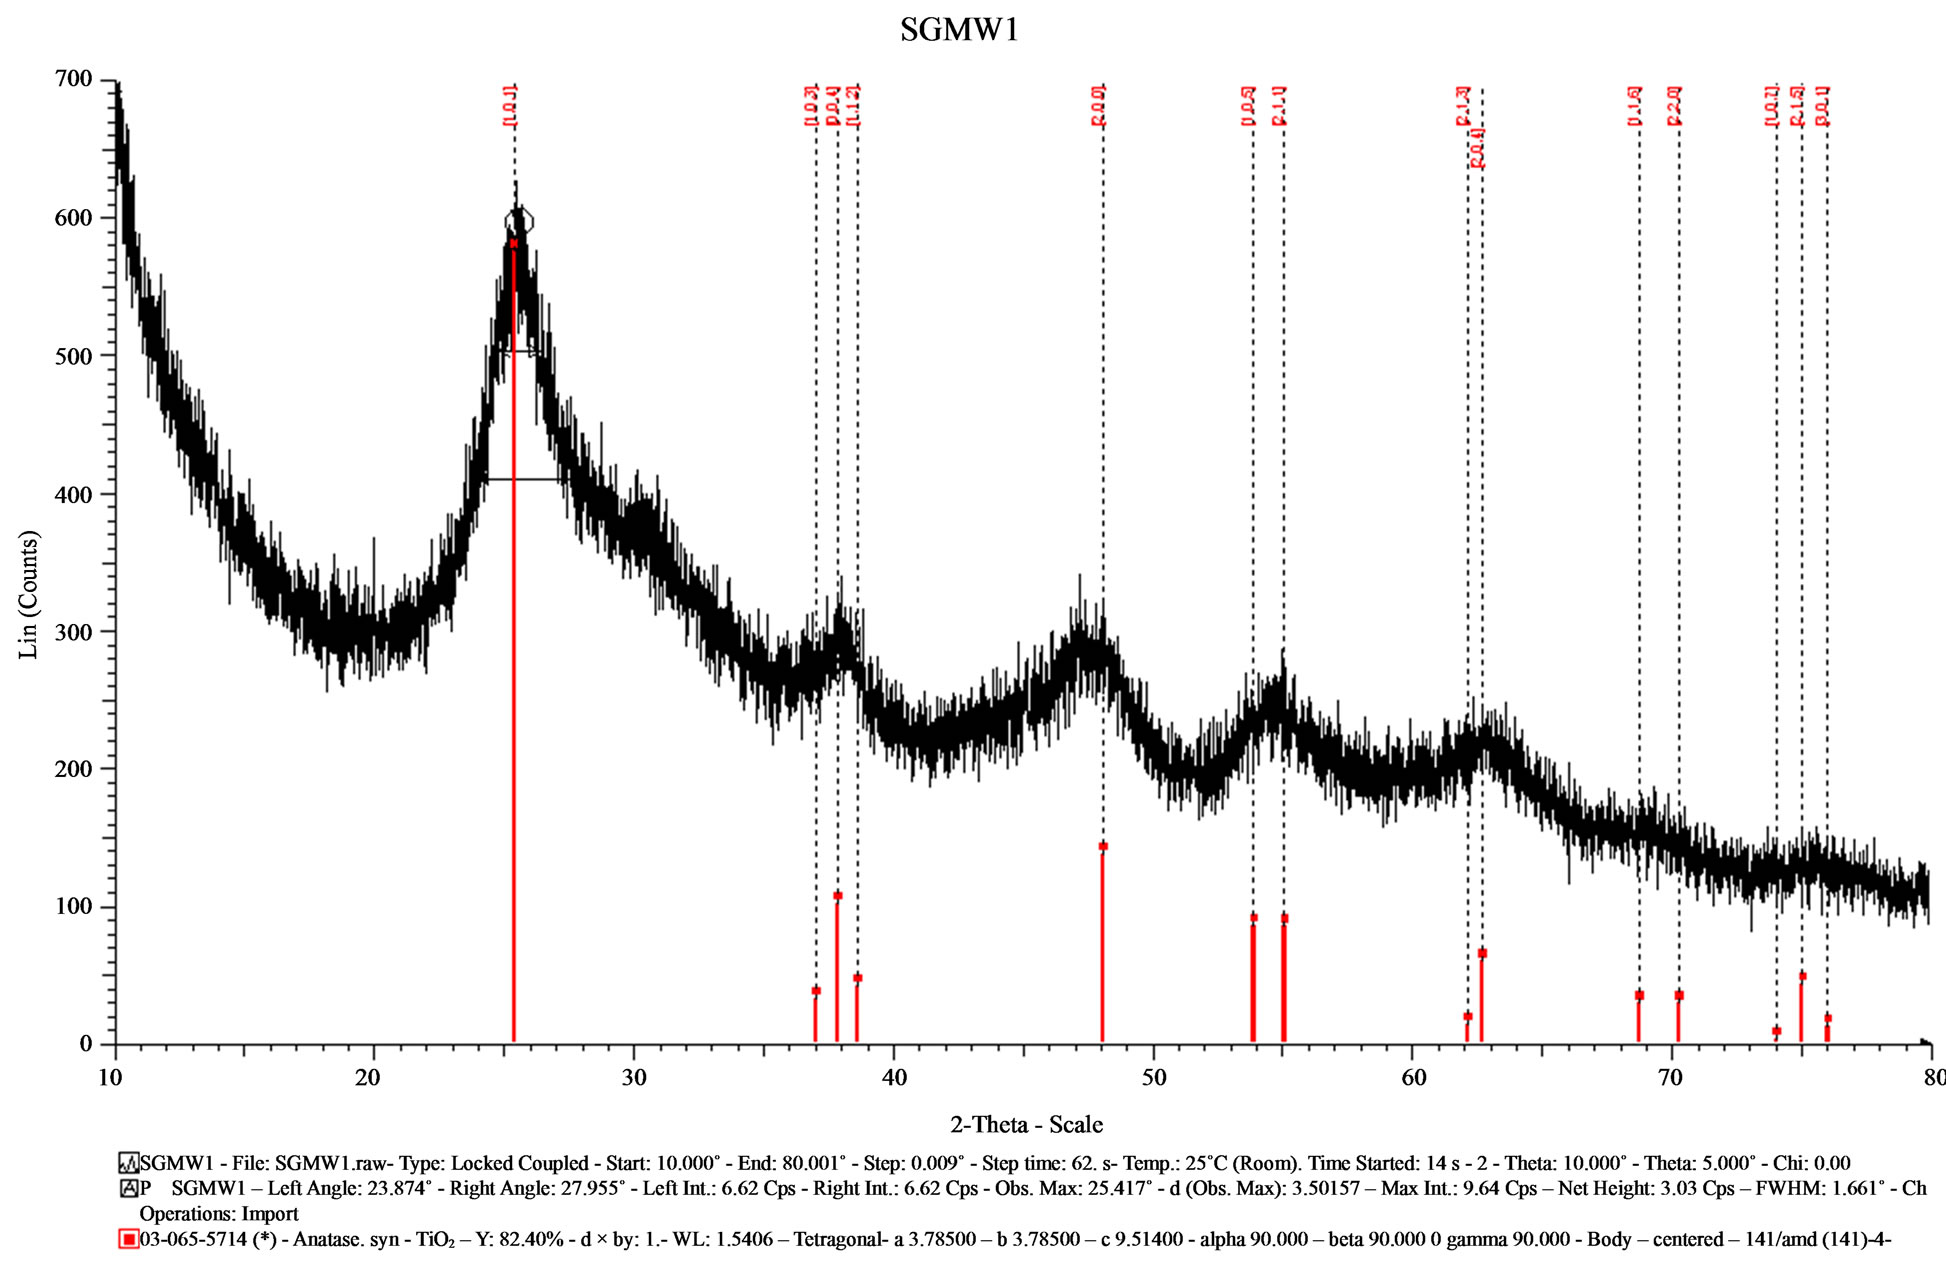
Figure 2. X-ray diffractogram of the sample (SGMW1) synthesized by the sol-gel method assisted by microwaves.
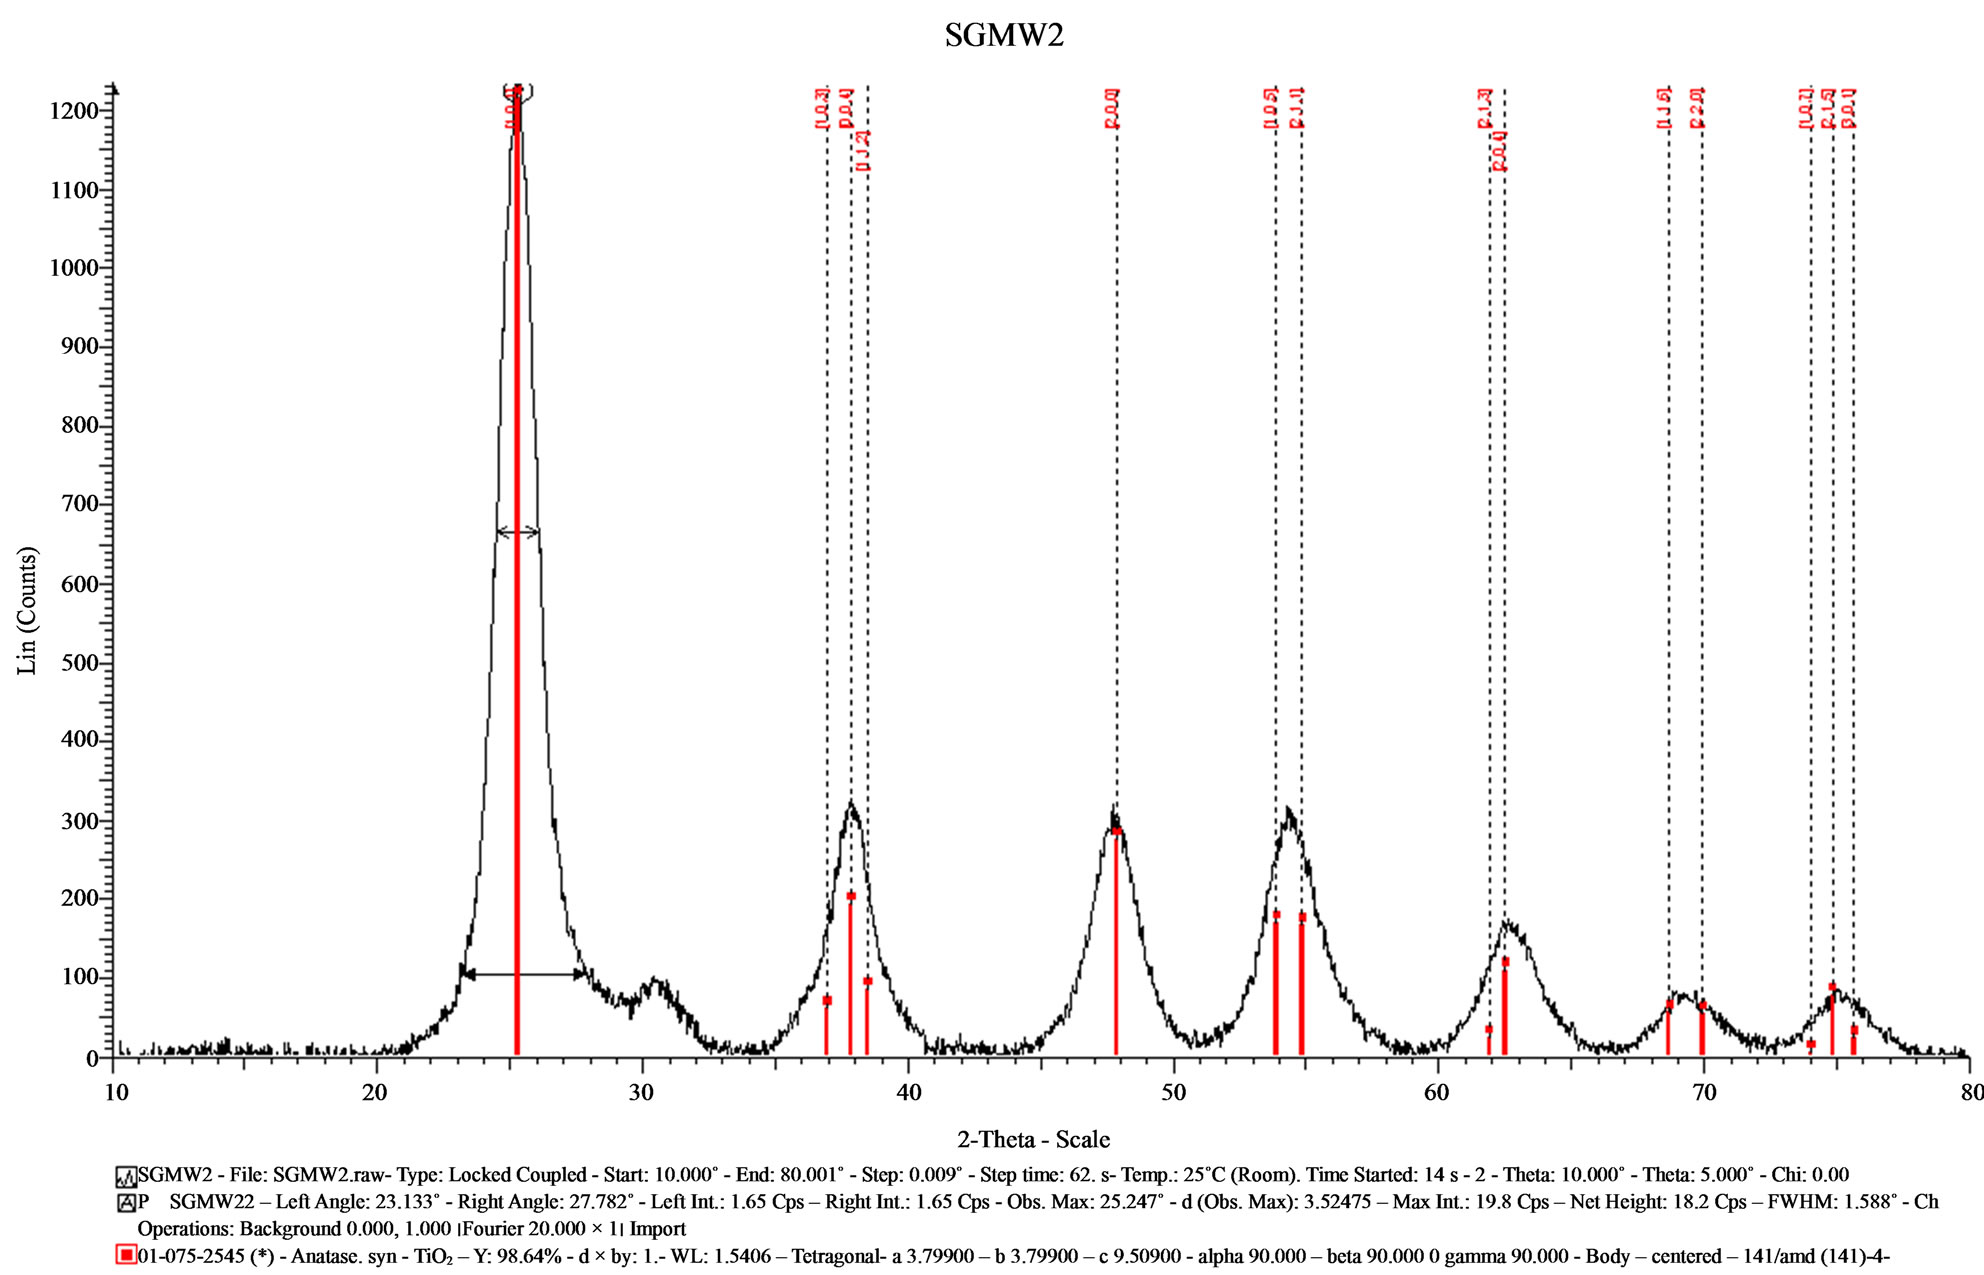
Figure 3. X-ray diffractogram of the sample (SGMW2) synthesized by the sol-gel method assisted by microwaves.
SGMW2 presented high intensity signals with a better definition, but the XRD signal were comparable to those observed for SGMW1. Although, the crystallite size is similar in the samples SGMW1 and SGMW2, it was possible to assume that the last one has a better crystalline quality. Using the Eva program was possible to determine the average crystallite size for each sample, with values of 2.53 nm for SGMW1 and 4.32 nm for SGMW2. Again, the crystalline phase was identified by comparison obtained from PDF 065-5714 and PDF 075-2545 titanium oxide in its anatase phase, for SGMW1 and SGMW2 respectively.
In the case of SGMW2, anatase PDF 075-2545 was once more identified, and a small quantity of brookite was identified with the PDF 65-2448. This crystalline phase is clearly observed by its main signal at 30.75˚.
In the diffractograms showed in the Figures 4 and 5, the crystalline phases obtained for MW6 and MW9 samples using the hydrothermal method for microwaves assisted were identified by the ICDD bank, and in the both cases the PDF 075-2546 and PDF 075-2545 of anatase was perceived. Besides, a quantity of brookite was also detected according to the PDF 65-2448. The diffractograms of both samples have a smoother background and the baselines are flat and they are tilted at low angles in 2θ. The intensity of the signals is strong and thinner than those observed in SGMW1 and SGMW2. The results of the average crystallite size determination showed a value of 5.37 nm; this average size is smaller than that obtained for the sample made by the sol-gel method, but larger compared to those obtained for the samples synthesized by the sol-gel method assisted by microwaves. In general, the diffractograms of samples MW6 and MW9 reveals that the crystalline quality is better compared to that observed in all the previous samples. As a consequence, it is possible to affirm that the sol-gel method assisted by microwaves allowed the obtaining of the best crystal quality.
Several secondary electron microscope micrographs are portrayed in the Figures 6-9, and they allow observing the morphology, microstructure and topology of all the materials synthesized through the three different methods. The sample SG1 showed morphology of micro-blocks made of small agglutinated nanometer particles. The sample surface is quite irregular and indicates that there is a large superficial area which is essential for the photo-catalytic applications.
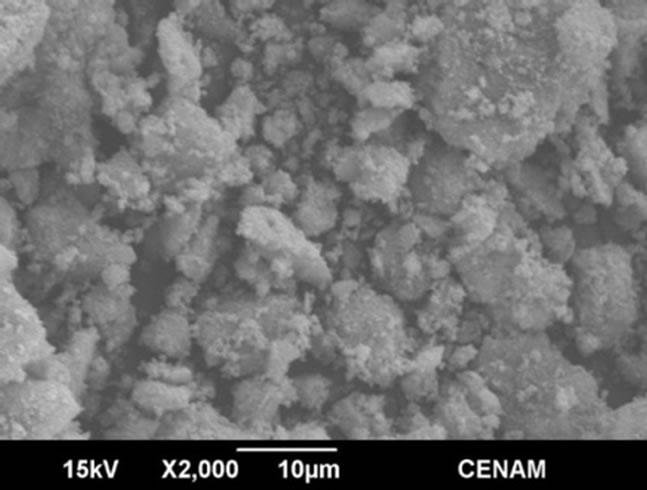
The morphology seen in the Figure 7 is rather similar to that observed for SG1 sample, and this is evidence that both method, sol-gel or sol-gel microwaves assisted, are able to generate micro-aggregates constituted of particles; however, the material produced by sol-gel shows greater
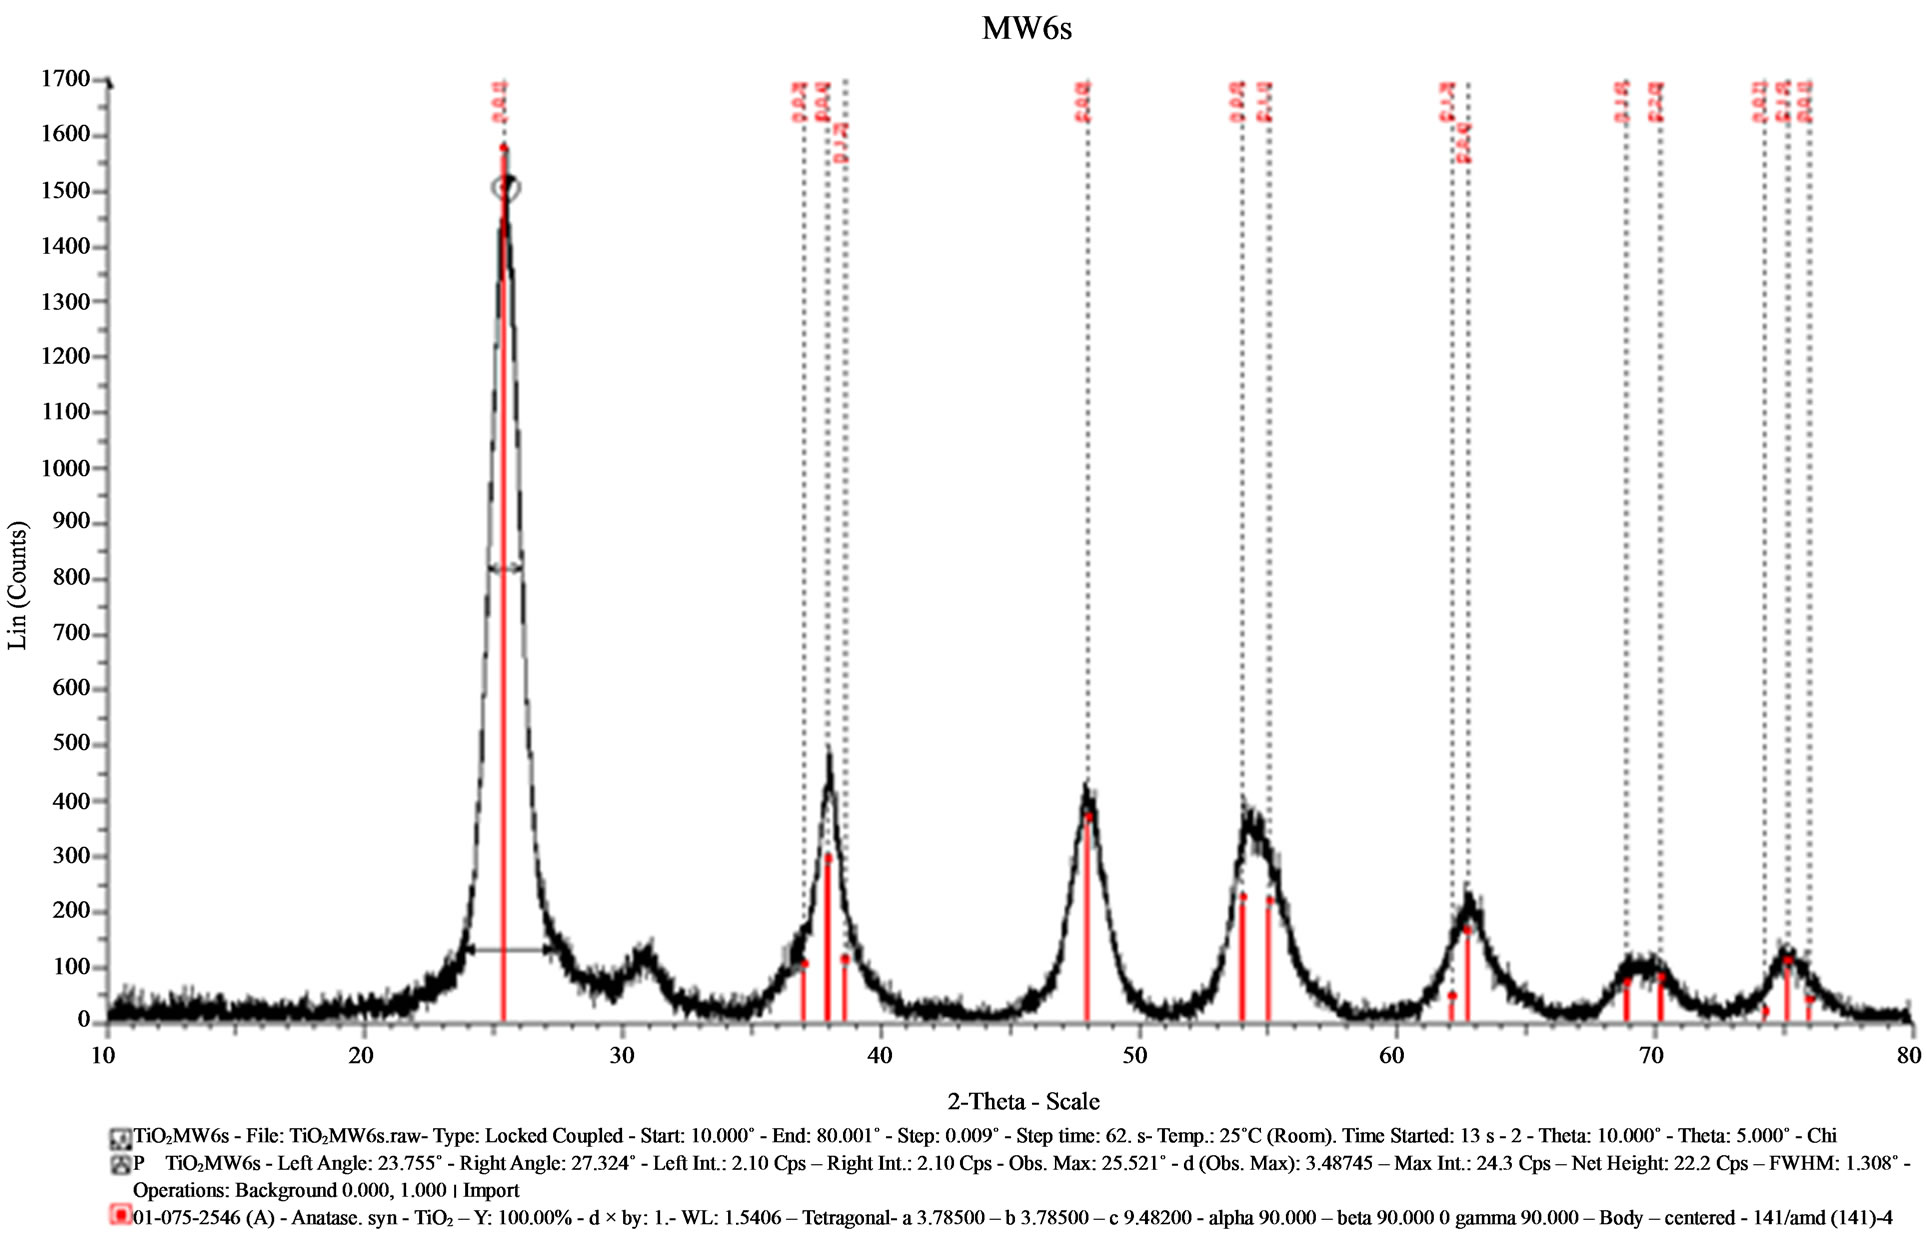
Figure 4. X-ray diffractogram of the sample (MW6) synthesized by the hydrothermal method assisted by microwaves.
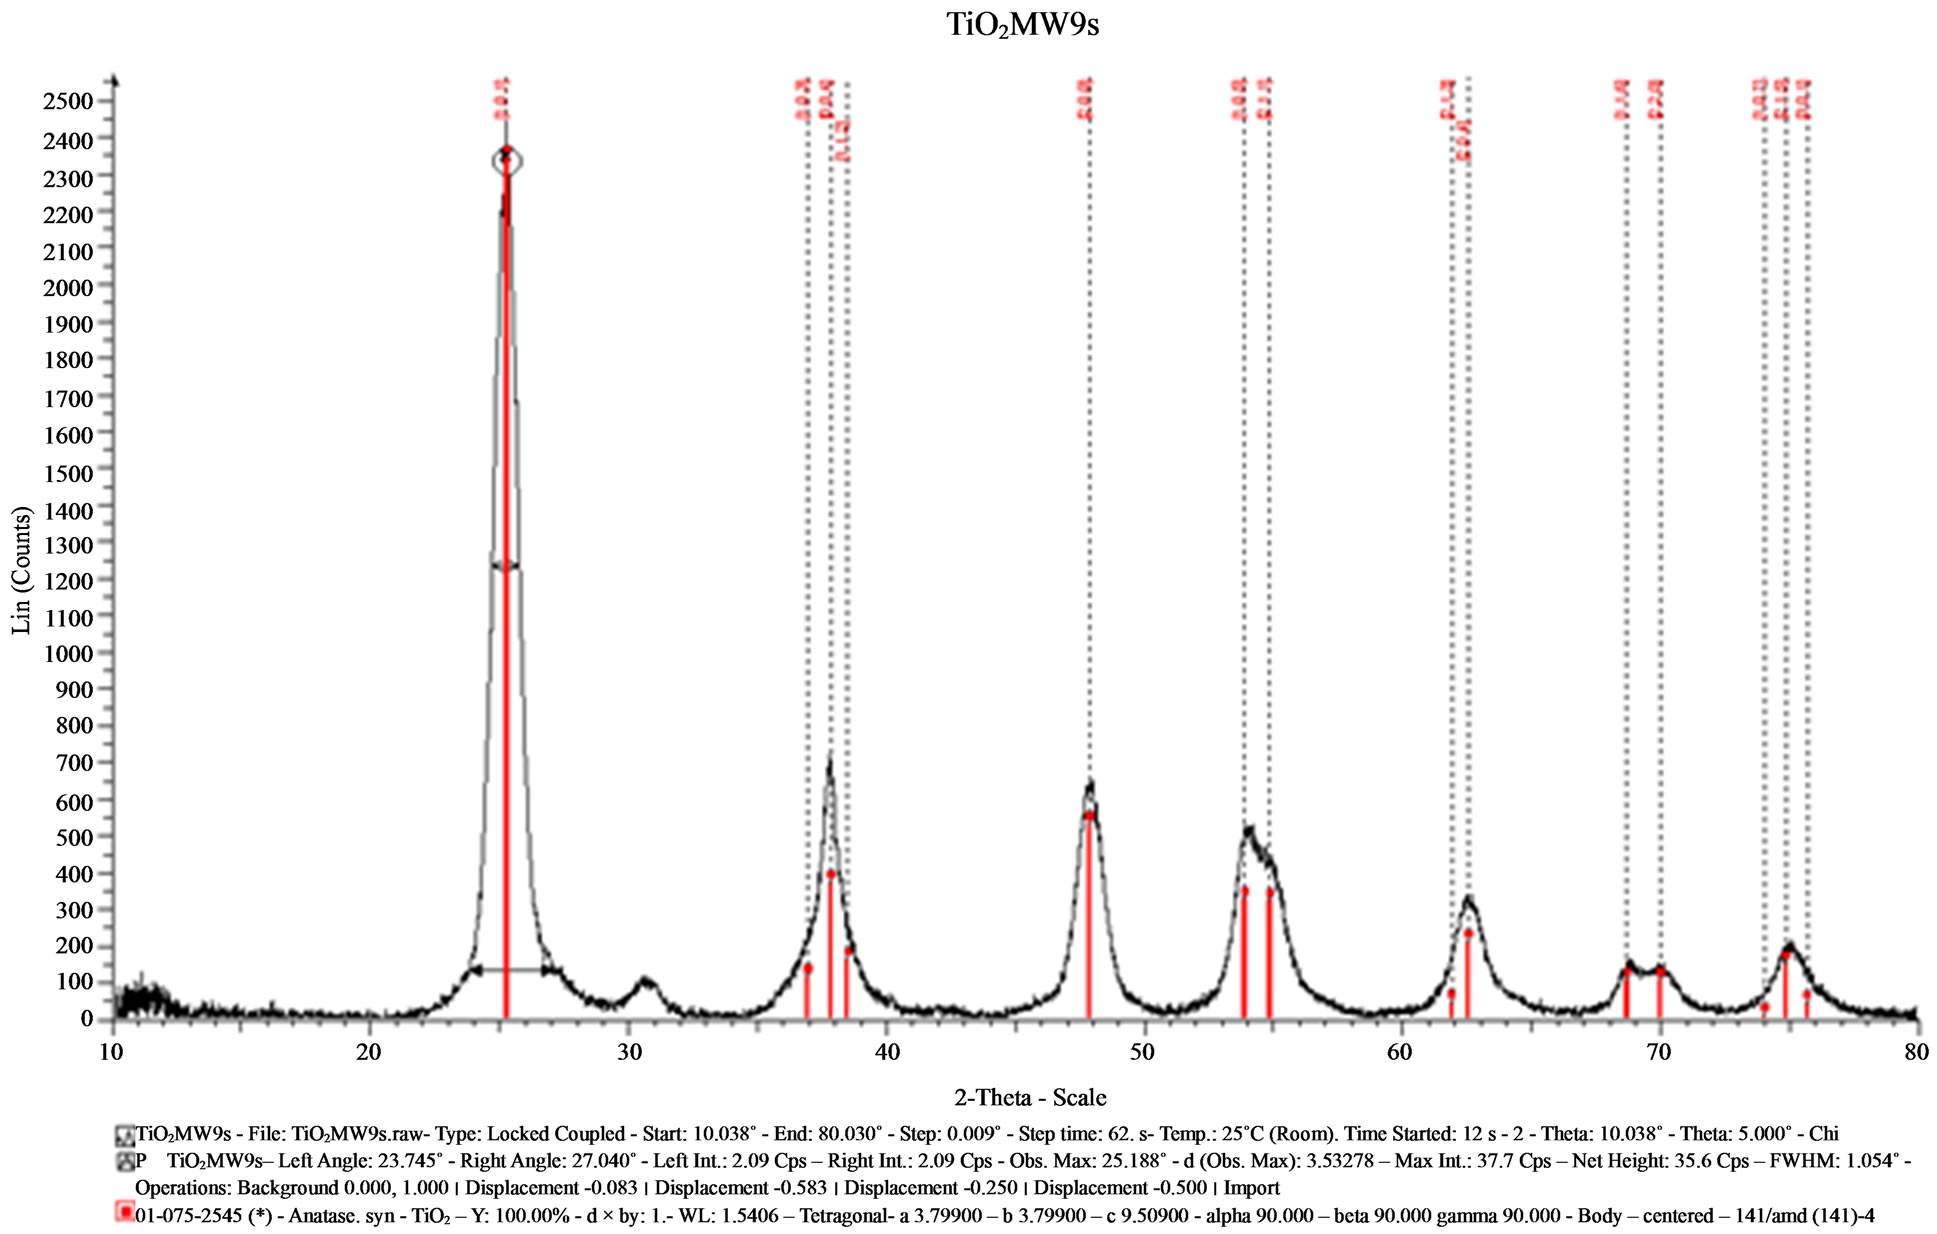
Figure 5. X-ray diffractogram of the sample (MW9) synthesized by the hydrothermal method assisted by microwaves.
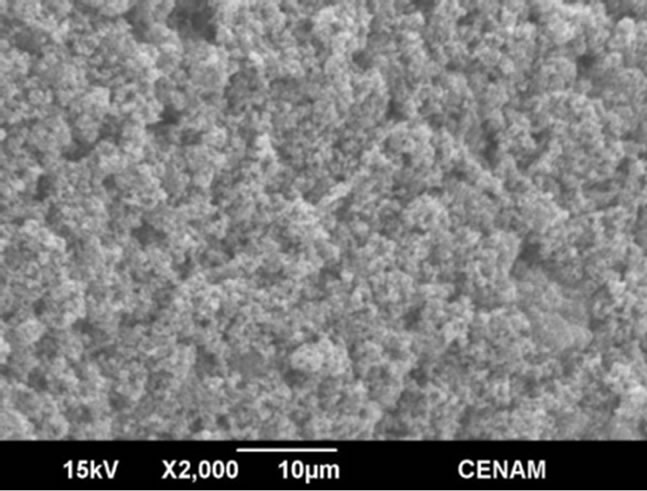
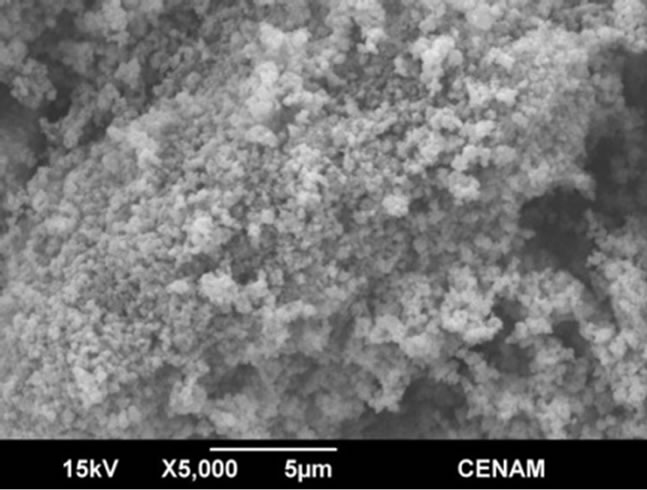
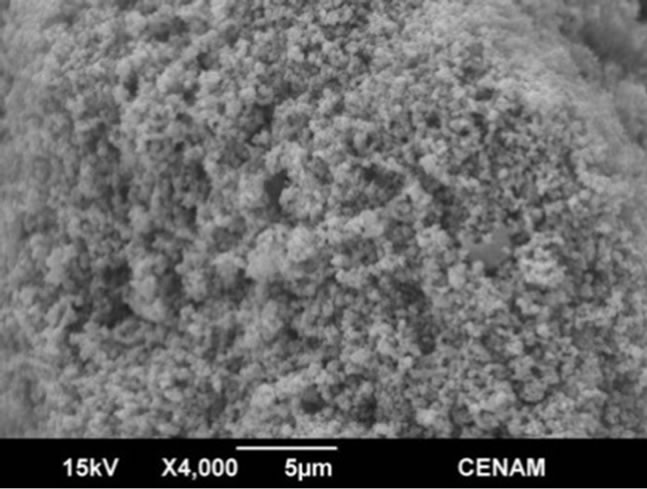
Figure 6. SEM micrographs of the SG1 sample synthesized by the sol-gel method.
 SGMW1
SGMW1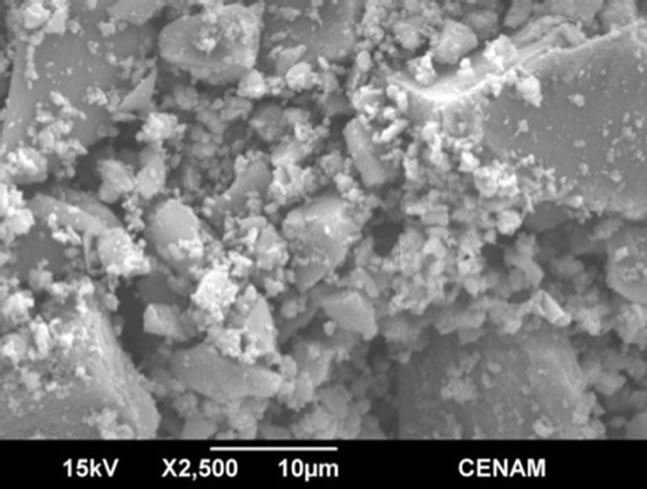 SGMW2
SGMW2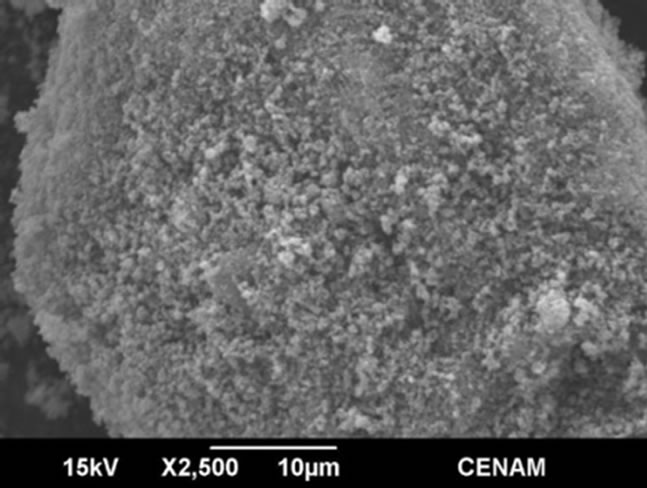 SGMW2
SGMW2
Figure 7. SEM micrographs of the samples SGMW1 and SGMW2 synthesized by the sol-gel method assisted by microwaves.
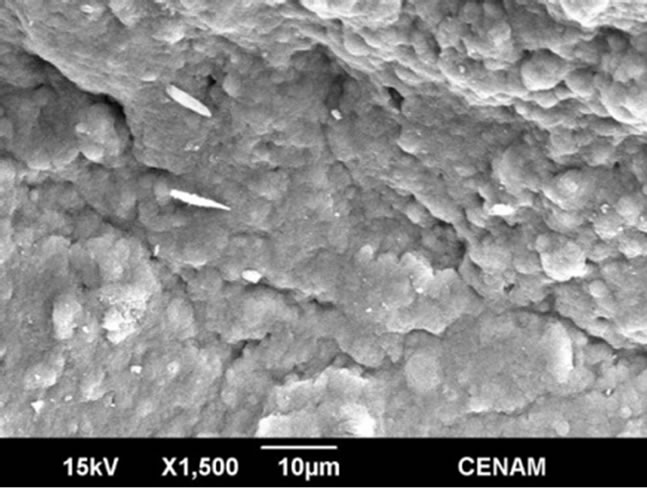
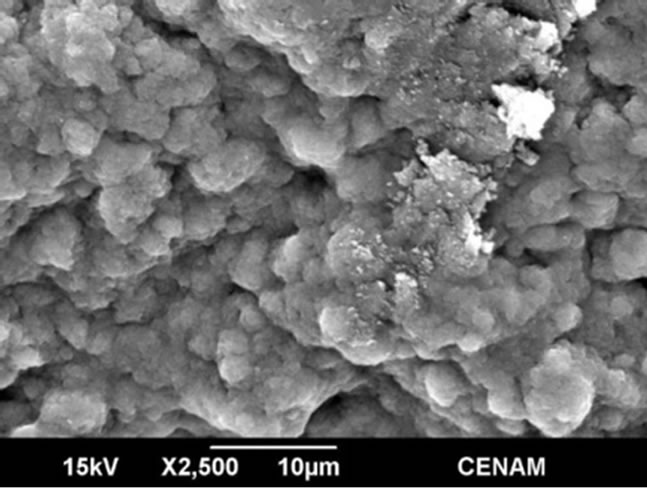
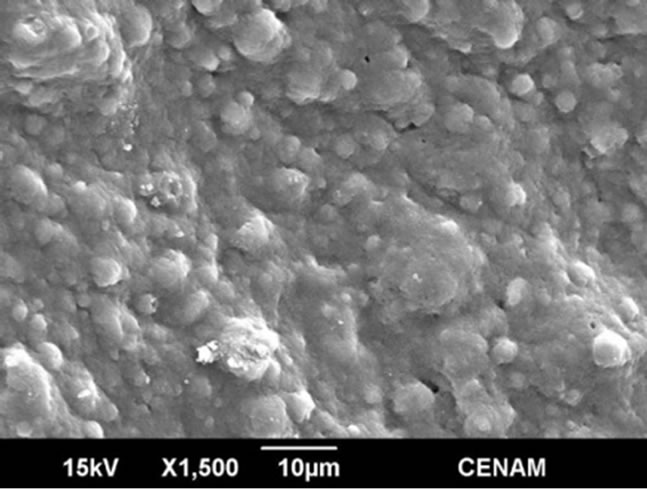
Figure 8. SEM micrographs ofthe sample MW6 synthesized by the hydrothermal method assisted by microwaves fora reaction time of six minutes.
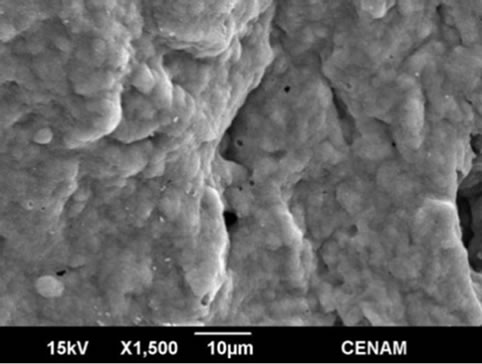
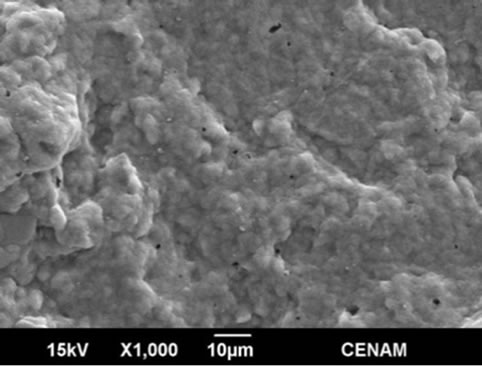
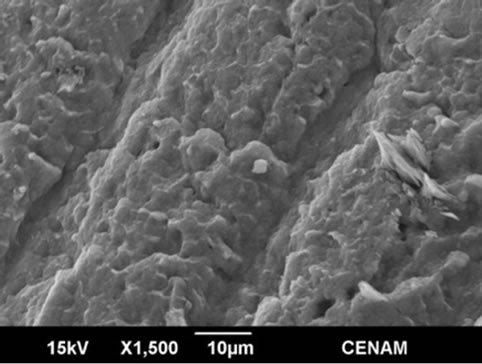
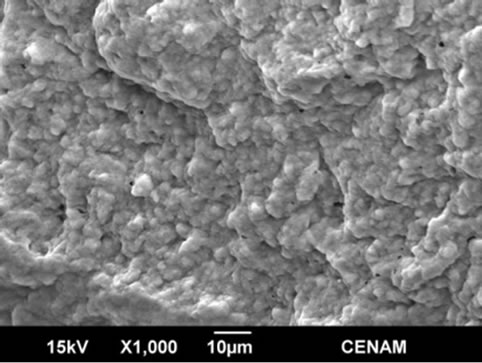
Figure 9. Four SEM micrographs of the sample MW9 synthesized by the hydrothermal method assisted by microwaves for a reaction time of nine minutes.
uniformity in particle size.
In the Figures 8 and 9 the morphology of MW6 and MW9 samples can be appreciated. The micrographs show continuous matrix which is made of or contain small submicroscopic particles. The surface sample is irregular, but is evener than those observed for the samples SG1, SGMW1 and SGMW2; this type of surface is not adequate for photo-catalytic applications. It could be possible that the energy supplied by the microwave oven during the synthesis process was considerably high and consequently, the micro-particles joined to form the observed matrix.
4. Conclusions
According to the results obtained, there is an effect of the different synthesis method on the crystalline quality and in the average crystallite size. The best crystalline quality was obtained through the sol-gel method; nevertheless, the hydrothermal method assisted by microwaves produces the best crystallite in size and homogeneity.
The results from this research work allow concluding that anatase was obtained through all the used synthesis methods. Most of the materials showed morphology of micro-aggregates made of small nano-scale particles; and in other samples, the morphology is a continuous matrix containing small particles. All the synthesis routes generate crystallite with an average size smaller than 27 nm, especially the sol-gel method assisted by microwaves and the hydrothermal method assisted by microwaves.
5. Acknowledgements
Authors would like to express their gratitude to Coordinación Sectorial de Desarrollo Académico (COSDACSEMS), and the CONACYT project “Enfoque integrado y transferencia de conocimiento de mejores prácticas para la vivienda y desarrollo urbano sustentable del futuro cercano”.
REFERENCES
- K. Nakata and A. Fujishima, “TiO2 Photocatalysis: Design and Applications,” Journal of Photochemistry and Photobiology C: Photochemistry Reviews, Vol. 13, No. 3, 2012, pp. 169-189. http://dx.doi.org/10.1016/j.jphotochemrev.2012.06.001
- A. Narayan-Banerjee, “The Desing, Fabrication, and Photocatalytic Utility of Nanostructured Semiconductors: Focus on TiO2-Base Nanostructures,” Nanotechnology, Science and Applications, Vol. 4, 2011, pp. 35-65. http://dx.doi.org/10.2147/NSA.S9040
- J. Mo, Y. Zhang, Q. Xu, J. Joaquin-Lamson and R. Zhao, “Photocatalytic Purification of Volatile Organic Compounds in Indoor Air: A Literature Review,” Atmospheric Environment, Vol. 43, No. 14, 2009, pp. 2229-2246. http://dx.doi.org/10.1016/j.atmosenv.2009.01.034
- A. B. Corradi, F. Bondioli and B. Focher, “Conventional and Microwave-Hydrothermal Synthesis of TiO2Nanopowders,” Journal of the American Ceramic Society, Vol. 88, No. 9, 2005, pp. 2639-2641.
- T. Suprabha, H. G. Roy, J. Thomas, K. P. Kumar and S. Mathew, “Microwave-Assited Synthesis of Titania Nanocubes, Nanospheres and Nanorodsfor Photocatalytic Dye Degradation,” Nanoscale Research Letters, Vol. 4, No. 2, 2009, pp. 144-152. http://dx.doi.org/10.1007/s11671-008-9214-5
- Q. Geng and N. Chen, “Photocatalytic Degratation of a Gaseous Benzene-Toluene Mixture in a Circulated Photocatalytic Reactor,” Chemical Engineering & Technology, Vol. 34, No. 3, 2011, pp. 400-408. http://dx.doi.org/10.1002/ceat.201000195
- A. Jena, R. Vinu, S. A. Shivashankar and G. Madras, “Microwave Assisted Synthesis of Nanostructured Titanium Dioxide with High Photocatalytic Activity,” Industrial and Engineering Chemistry Research, Vol. 49, No. 20, 2010, pp. 9636-9643. http://dx.doi.org/10.1002/ceat.201000195
- M. Lira-Cantu, A. Chafiq, J. Faissat, I. Gonzalez-Valls and Y. Yu, “Oxide/Polymer Interfaces for Hybrid and Organic Solar Cells: Anatase vs. Rutile TiO2,” Solar Energy Materials & Solar Cells, Vol. 95, No. 5, 2011, pp. 1362-1374. http://dx.doi.org/10.1016/j.solmat.2010.12.028
- K. S. Brammer, C. J. Frandsen and S. Jin, “TiO2 Nanotubes for Bone Regeneration,” Trends in Biotechnology, Vol. 30, No. 6, 2012, pp. 315-322. http://dx.doi.org/10.1016/j.tibtech.2012.02.005
- G.-T. Pan, M.-H. Lai, R.-C. Juang, T.-W. Chung and T. C.-K. Yang, “Preparation of Visible-Light-Driven Silver Vanadates by a Microwave-Assited Hydrothermal Method for the Photodegradation of Volatile Organic Vapors,” Industrial and Engineering Chemistry Research, Vol. 50, No. 5, 2011, pp. 2807-2814. http://dx.doi.org/10.1021/ie1012932
- Y. Koval, Y. Skvortsevitch and E. Mayer, “VLDPE Synthesis by Radical Ethylene Polymerization in Tubular Reactors-Negative Factor or Unrealized Opportunities,” Journal of Materials Science and Chemical Engineering, Vol. 1, No. 1, 2013, pp. 11-16. http://dx.doi.org/10.4236/msce.2013.11003
- J. Xie, S. Tian, J. Liu and X. Zhou, “Effects of Salt Quenching Temperatures on Microstructure and Creep Properties of a PM Ni-based Superalloy,” Journal of Materials Science and Chemical Engineering, Vol. 1, No. 1, 2013, pp. 6-10. http://dx.doi.org/10.4236/msce.2013.11002
- K. Aketagawa, H. Hirama and T. Torii, “Hyper-Miniaturisation of Monodisperse Janus Hydrogel Beads with Magnetic Anisotropy Based on Coagulation of Fe3O4 Nanoparticles,” Journal of Materials Science and Chemical Engineering, Vol. 1, No. 2, 2013, pp. 1-5. http://dx.doi.org/10.4236/msce.2013.12001
- Y. Makhkhas, S. Aqdim and E. H. Sayouty, “Study of Sodium-Chomium-Iron-Phosphate Glass by XRD, IR, Chemical Durability and SEM,” Journal of Materials Science and Chemical Engineering, Vol. 1, No. 3, 2013, pp. 1-6. http://dx.doi.org/10.4236/msce.2013.12001
- X. Liu, “Preparation and Characterization of Pure Anatase Nanocrystals by Sol-Gel Method,” Powder Technology, Vol. 224, 2012, pp. 287-290. http://dx.doi.org/10.1016/j.powtec.2012.03.007
- J. Wang, H. Li, H. Wang, K. Huang, G. Sun, S. Yin and T. Sato, “Morphology Control of TiO2 through Hydrotermal Synthesis Method using Protonic Tetratitanate,” Research on Chemical Intermediates, Vol. 37, No. 2-5, 2011, pp. 165-175. http://dx.doi.org/10.1007/s11164-011-0263-5
- R. Rahal, A. Wankhade, D. Cha, A. Fihri, S. Ould-Chikh, U. Patil and V. Polshettiwar, “Synthesis of Hierarchical Anatase TiO2 Nanostructures with Tunable Morphology and Enhanced Photocatalytic Activity,” RSC Advances, Vol. 2, No. 18, 2012, pp. 7048-7052. http://dx.doi.org/10.1039/c2ra21104a
NOTES
*Corresponding author.