Open Journal of Soil Science
Vol.3 No.8(2013), Article ID:41587,13 pages DOI:10.4236/ojss.2013.38042
Effects of Conservation Tillage on Total and Aggregated Soil Organic Carbon in the Andes
![]()
1Decision and Policy Analysis Research Area, International Center for Tropical Agriculture (CIAT), Cali, Colombia; 2University of Florida North Florida Research and Education Center, University of Florida (UF), Quincy, USA.
Email: *m.quintero@cgiar.org, nbc@ufl.edu
Copyright © 2013 Marcela Quintero, Nicholas B. Comerford. This is an open access article distributed under the Creative Commons Attribution License, which permits unrestricted use, distribution, and reproduction in any medium, provided the original work is properly cited.
Received October 16th, 2013; revised November 17th, 2013; accepted November 24th, 2013
Keywords: Conservation Tillage; Soil Organic Carbon; Soil Aggregates; Andes; Potato
ABSTRACT
Many Andisols of the Andes have been disturbed by traditional potato-based rotation agriculture disrupting soil structure, water retention capacity and organic matter content. This study was undertaken to investigate the contribution of conservation farming technology or reduced tillage in potato-based rotations in the Colombian Andes in order to rehabilitate total and aggregated soil organic C in disturbed organic matter-rich Andisols. Soils were sampled from farms with 7-year of reduced tillage and farms with conventional farming practices. Ultrasound energy was applied to samples to disrupt aggregation and total soil C was determined in order to investigate the amount of carbon held inside the aggregates of different soil size classes. Results indicated that reduced tillage in potato-based crop rotations increased the soil C concentration and average C content in the whole profile (≈117 cm depth) by 50 and 33% (1636 t C ha−1 vs. 1224 t C ha−1), respectively, as compared to conventional farming practices. Carbon content increased 177% in the subsoil (A2 horizon, 78 - 117 cm depth, from 215 to 596 t∙ha−1), although most of the soil C was in the A1 horizon (between 0 - 78 cm average thickness, 1097 t∙ha−1). These increases show that reduced tillage enhances C stores in Andisols which are already high in organic matter. In addition, C in aggregates represented more than 80% of the total organic matter and it was positively affected by conservation practices. The C increase was preferential in the smaller macroaggregates (<2 mm). The aggregate dispersion energy curves further suggested that C increase was occurring in microaggregates within the smaller macroaggregate fraction. Data suggested that smaller macroaggregates can be used in these soils to evaluate the influence of field management practices on soil C sequestration.
1. Introduction
Over 60% of the world’s carbon (C) is in soils (over 40%) and the atmosphere (20%) [1,2]. However, soil disturbance is redistributing the carbon and augmenting the atmospheric carbon pool. Tillage disrupts soil aggregates, which hasten soil organic matter (SOM) mineralization [3]. The increased release of CO2 from agricultural soils not only contributes to atmospheric greenhouse gasses, but also has a negative impact on agriculture and natural resource productivity and sustainability [4].
Jastrow et al. [5] noted that nearly 90% of SOM was found within soil aggregates. Aggregates, particularly aggregates in volcanic soils, have been classified into macroaggregates (>0.25 mm) and microaggregates (0.05 - 0.25 mm) [6,7]. Jastrow [8] and Six et al. [9] found that the majority of C in macro and microaggregates is mineral-associated C formed during the decomposition of particulate organic matter (POM) and this fraction was responsible for long-term C sequestration. Additionally, Kong et al. [10] demonstrated that the relationship between organic C input and SOC sequestration was dominated by SOC increases within macroaggregates. However, macroaggregates are susceptible to tillage disruption [11,12]. Disrupting macroaggregates exposes the microaggregate C pool to decomposers, thereby increasing SOC mineralization [13,14].
The level of physical protection provided by aggregates varies with soil management practices [15]. Generally, there is more aggregate protection in no-till soils than in cultivated ones. Thus, the fate of SOM will depend upon its decomposability and the persistence of aggregates, which relate to aggregate stability in water and resistance to other mechanical stresses (e.g. tillage). Several researchers found more macroaggregates in nontillage or reduced tillage soils, as compared with conventional tillage soils [16,17]. Tisdall and Oades [18] found that cultivation generally resulted in reduced macroaggregate number and stability but it had little effect on microaggregate stability. As a consequence, the SOM that binds microaggregates into larger macroaggregates was suggested to be the primary source of organic matter loss from soil cultivation practices [11]. Although there are other ways to protect SOC, such as by adsorption to clay minerals and by isolation in soil micropores [19], aggregate-associated SOC may increase simply through changes in cultivation practices.
Management systems involving high C inputs and reduced tillage should favor C storage directly by reducing aggregate breakdown and by enhancing SOM-mediated aggregation. For example, establishment of perennial grasses or legumes in poorly-structured soils contributed to macroaggregation, which favor the protection of labile C and, as a consequence, long-term C storage [20]. Similar results have been obtained by Carter [16] and Beare et al. [15] when no-tillage was practiced. Therefore, similar soil conservation practices are recommended in order to increase SOC sequestration. In addition, practices such as non-tillage and reduced tillage are increasingly adopted by farmers because it has the potential to reduce production costs [21,22] and use of fossil fuels [23].
Beginning in 1999, Colombia’s Technical German Cooperation (GTZ) and the regional environmental authority (CAR) adopted reduced tillage and cover crop conservation agricultural practices. This system is referred to as conservation tillage (RT) in this document. In this form of tillage, soil loss is reduced compared to traditional tillage and crop residues are left unincorporated [24]. Experience has shown that reduced tillage with cover crops is protecting watersheds from run-off and increasing farmer income [25]. However, there are no studies with reference to the impact of RT on soil C sequestration in the Andes, with particular reference to the páramos soils of Colombia. Thus, the objectives of this research were to 1) determine if SOC and SOM can be increased in already organic matter-rich soils through conservation tillage in order to bring these soil back to their characteristically high SOM levels; and 2) estimate the amount of aggregated organic matter (AOM) in stable, soil macroaggregates under potato-based rotations using conventional tillage vs. reduced tillage with cover crops in Colombia’s upper Lake Fuquene watershed.
The first objective relied on the hypothesis that, in spite of the high OM content of these high elevation páramos soils, conservation tillage would still increase SOM with respect to conventional tillage. The rationale was that, in the past, these soils were disrupted by intensive tillage and were not enriched with additional sources of OM, and that soil C had been released to the atmosphere and would not be recuperated until additional C inputs were incorporated (i.e. oats cover crop residues in this study). The unique aspect of this objective is that the soils selected for this study already have very high SOM to at least 1 meter depth; so the potential to increase SOM was unknown.
For the second objective, the hypotheses were: 1) Conservation agriculture increases OM in the aggregate organic matter pool for these high OM soils, and 2) The OM contained in aggregates is different across size classes, being greater in smaller macroaggregates. The first hypothesis is based on results from other studies that reported improved soil aggregation and increased SOC levels with no-till compared with conventional tillage, e.g., [9,16,26,27], yet no information exists for these unique soils. The second hypothesis is expected since the distribution of SOM among aggregate size classes can be heterogeneous [14] while Kong et al. [10] and Denef et al. [28] found—although for other soil types—that with non-tillage the AOM is higher in smaller macroaggregates than in larger ones.
2. Materials and Methods
2.1. Study Sites
This study was conducted in the upper part of the Lake Fuquene watershed (2985 - 3070 m elevation) located in the valleys of Ubaté and Chiquinquirá, north of Bogotá, the capital of Colombia (South America) (N 05˚20' W 73˚51'). The monthly temperatures do not have large variations throughout the year and the mean annual values are between 12.0˚C and 13.2˚C. The mean monthly relative humidity varies between 70% and 80%. The annual mean precipitation is 610 mm [29,30]. The study sites, located in the Carmen de Carupa Municipality, corresponded to cropping areas that formerly were páramo —alpine Andean grasslands, a typical Andean natural ecosystem. Andisols are the primary soil order in this region, and the field soils were classified as Lithic Hapludands [31]. Basic physical properties of páramo soils include a very high porosity due to the high organic matter content (up to 40% of OM) with an open and porous structure, a rapid hydraulic conductivity and high water content (2 g∙g−1) under saturated and 1500 KPa suction conditions, respectively). The high water retention is attributed to the presence of amorphous clay minerals such as allophane and imogolite and the high OM content [32,33]. Bulk density ranges from as low as 0.15 g∙cm−3 in wet, weathered soils to about 0.9 g∙cm−3 in dryer younger soils [33]. However, much of the native soil characteristics have been greatly modified by conventional tillage.
Two types of soil management were selected for this study: 1) parcels where conventional tillage (CT) had been practiced for over 7 years and 2) parcels where reduced tillage and cover crops (denoted in this manuscript as RT—for reduced tillage) had been practiced within the last 7 years following prior conventional tillage similar to that in parcel type CT. Table 1 describes the sequence of the rotations with CT and RT and respective planting dates. The CT rotation (potato-potato-pasture-pasture) was two potato seasons rotated with 2-year of pasture (ryegrass). The pasture was not fertilized and relied on the residual fertility left after potato cropping. The RT rotation (potato-oats-potato-oats-potato-pasture-pasture) was potatoes with an oat cover crop previous to potato sowing. The RT treatment started with potatoes sowed into a degraded pasture that pertained to a prior CT rotation. In these parcels, oat and potatoes were also rotated with pastures as in CT. In CT and RT treatments potato was generally grown in March and September. RT is distinguished from CT because it left unincorporated oats residues and practiced minimum tillage. Minimum tillage here involves non-inverted deep tillage and differed from the CT treatment where conventional plowing inverted the soil, more machinery passes were applied and weed control was mechanical. At 70 days, soil was put into beds. In the CT treatment, a disc plow was passed twice to 30 cm depth to invert the soil and rotovated with two to three passes to 15 - 20 cm depth. In addition to these practices there is mechanical weed control one month after planting and soil is put into beds at day 70. In the RT system, there was an initial chemical control of weeds followed by 1 to 3 passes with a chisel plow along with disking to 30 cm depth. There was no need to control weeds up to 35 days after potato planting. At day 75, soil was mounded around the plant base. In addition and prior to potato, oats were grown as a cover crop. For this, chemical weed control was applied and a chisel plow pass was used for land preparation. Each system was represented by 3 sites. The 6 sites were selected based on similar: 1) landscape position; 2) land use; 3) slope; and 4) rainfall. Thus all sites were located on backslope positions, with linear, moderate slopes, under potato-based rotations and the same rainfall regimen.
In each site, two soil pits were dug in May 2007. Soil horizons were identified in each of the 12 soil profiles (12 pits), and one soil sample (500 g) was removed from the middle of each of the identified horizons (Table 2) for aggregation, carbon and texture analyses. Thirty-five soil samples were collected in total. In addition, soil samples per horizon were removed using 3 cylinders (5 × 5 cm.) per horizon (105 soil core samples in total) to determine the bulk density. In general, three horizons were found in most of the profiles with an average thickness of 78 cm (horizon A1, top), 39 cm (horizon A2) and 49 cm (horizon C, bottom). The main differences between horizon descriptions were that the percent of clay increased with depth and the color was very dark in the first two horizons while the third one was mostly yellowish. In Table 2, the main characteristics of the 12 soil profiles are shown.
2.2. Soil Analyses
The soil organic C concentration was determined using the method of Walkley and Black as described by Nelson and Sommers [34]. Soil organic matter (SOM) was determined by loss on ignition [35]. The soil carbon content was estimated using the equivalent soil mass approach (mass-depth) to correct for differences in soil bulk density, thereby allowing for more precise and accurate quantitative comparisons of soil constituents [36]. Average soil mass was calculated per site according to bulk density and soil depths. With these averaged soil masses the soil depth was adjusted in order to ensure that final C contents were representing the same amount of soil mass. Undisturbed soil cores were used to determine soil bulk density by the cylinder method [37,38].
For aggregate soil organic matter determination, 35 fresh samples were segregated and classified by size using “dry” sieving with a nest of sieves representing five different size classes: 5, 2 (large macroaggregates), 1, 0.5 and <0.5 mm (small macroaggregates) screen sizes.
Macroaggregates from each size class were labeled as: SF1 (>5 mm size class), SF2 (2 - 5 mm size class), SF3 (1 - 2 mm size class), SF4 (0.5 - 1 mm size class) and SF5 (<0.5 mm size class). Field-moist samples were used to avoid changes associated with drying [7]. The samples
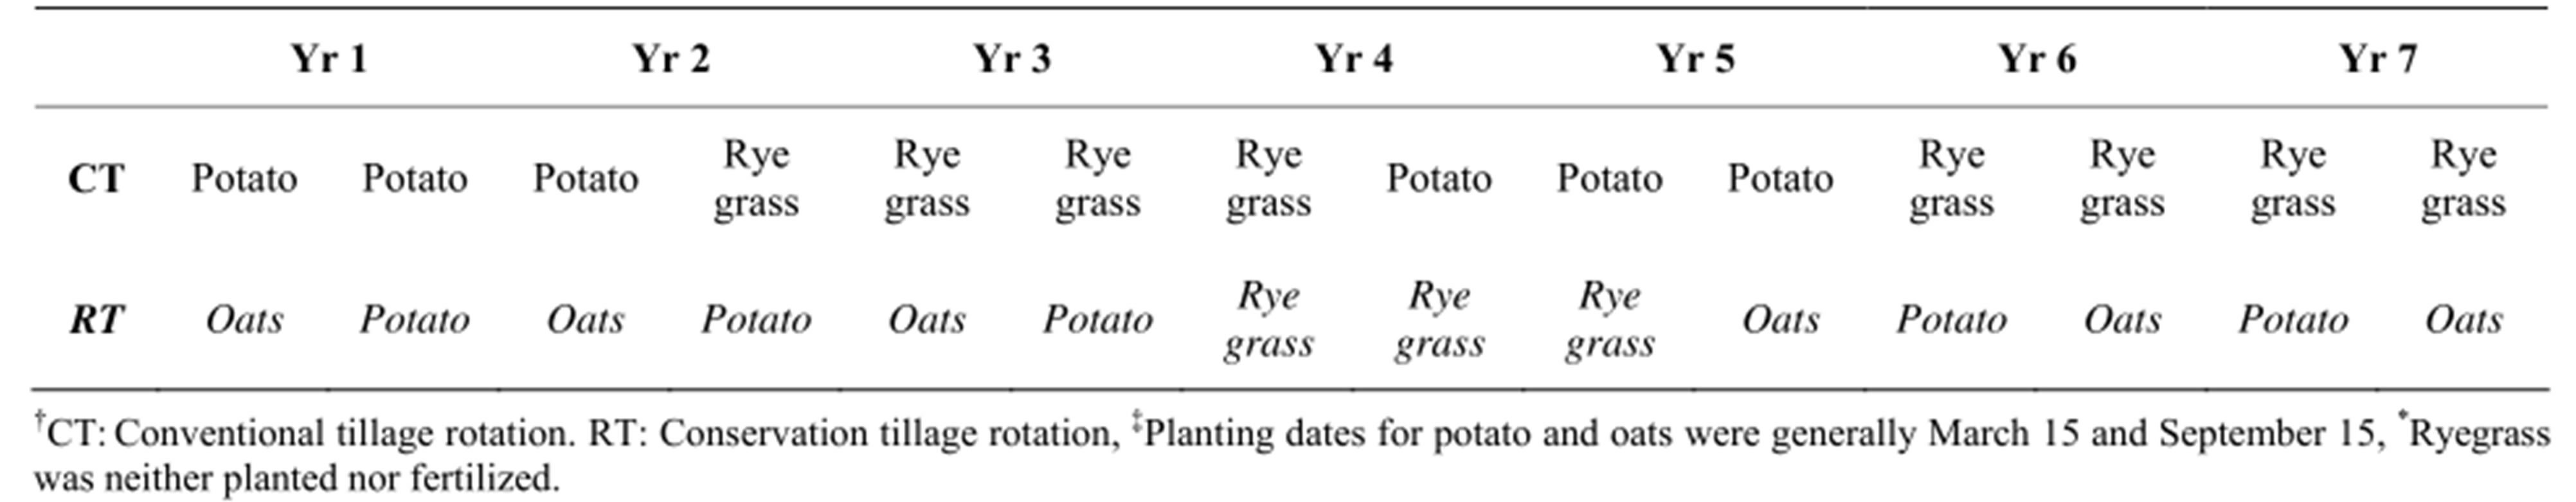
Table 1. Conventional and conservation tillage rotations.
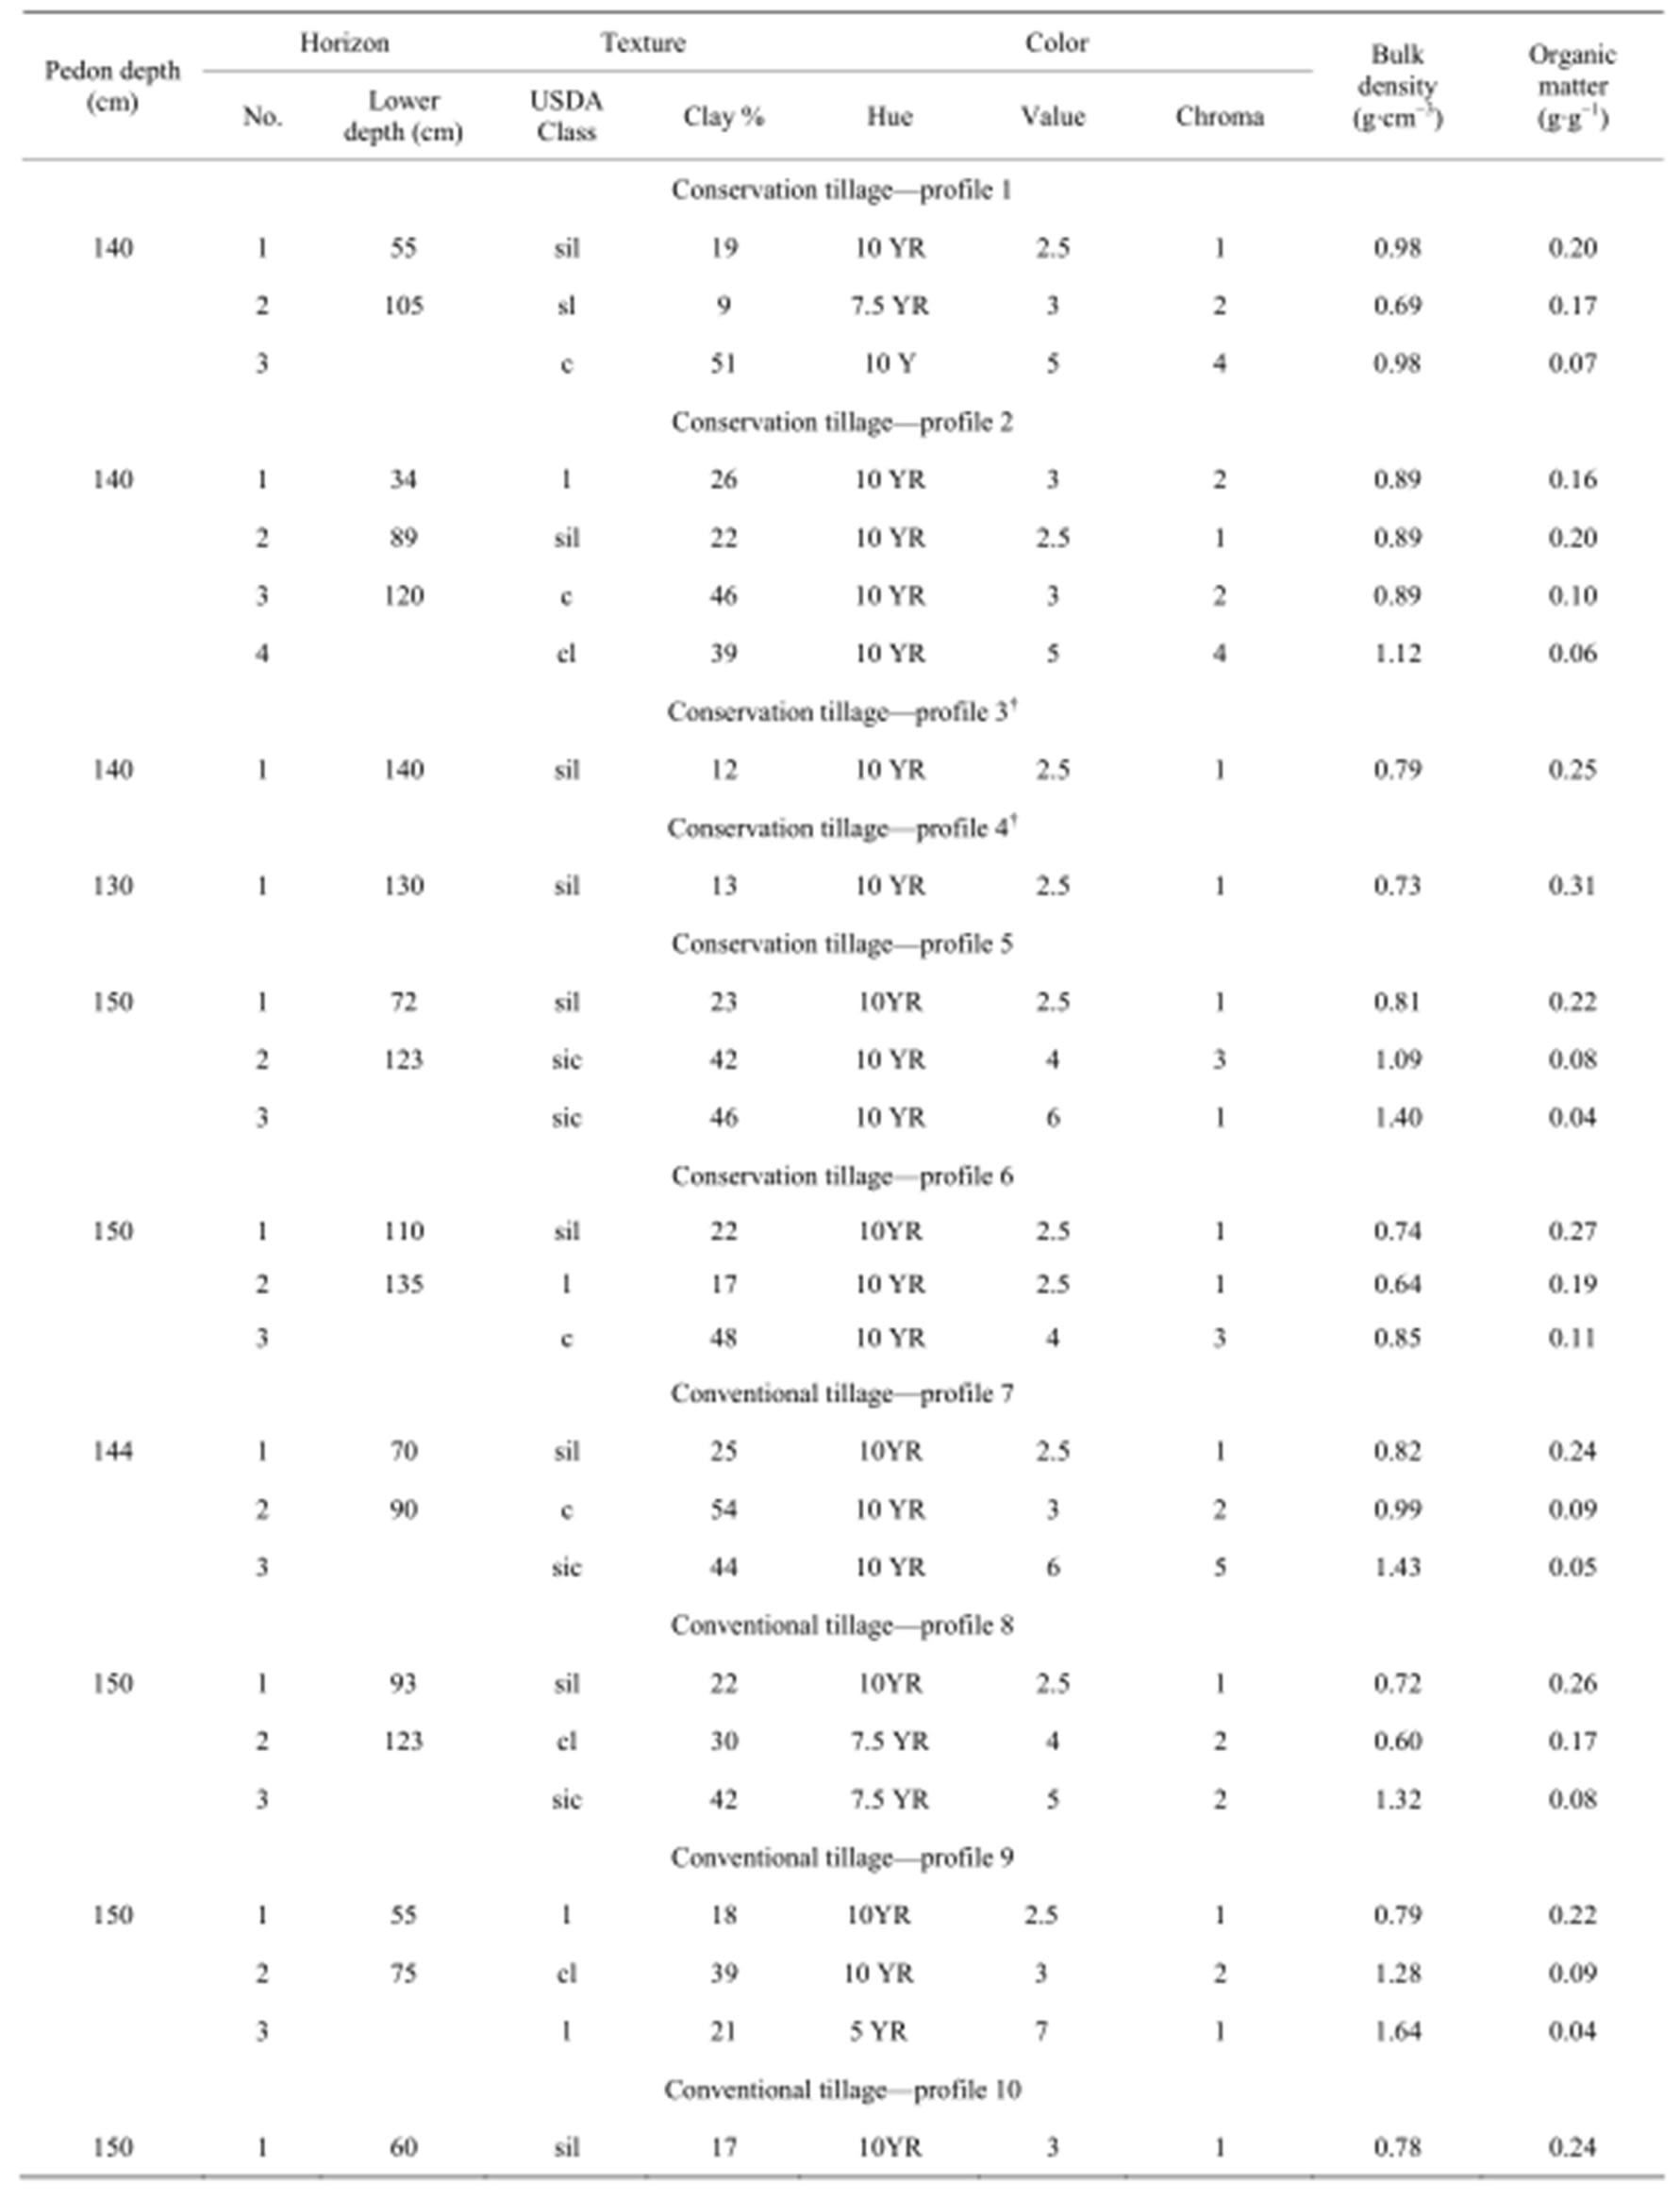

Table 2. Characteristics of soil profiles described for 6 sites and two treatments (Conservation and conventional tillage).
were sieved in a mechanical shaker for 5 minutes. To examine the AOM content, a sonication procedure was used for each soil size class [39-42]. It consisted in applying different ultrasound energy inputs to aggregates in order to cause their dispersion and release of SOM. Thus, this procedure permitted measurement of the amount of carbon associated with aggregation at different dispersive energy levels [42]. For this, a Sonic Dismembrator (Fisher Scientific, model 550) was used and 10 energy levels were obtained by combining different amplitudes (20% to 60%) and time periods (1 to 5 minutes). The pulse method (60 sec ON and 30 sec OFF) was used to avoid an excessive rise in temperature.
Up to 10 sub-samples of approximately 5 g each were tested per each of the 5 aggregate size classes derived from each of the 35 fresh soil samples (1750 samples in total). To each sub-sample, one of the 10 energy levels was applied. Energy was applied starting from the lowest level (5.1 kJ) and incrementing it until reaching the maximum level (11 kJ) or before in those cases where a sub-sample’s aggregation was completely destroyed. The actual energy inputs (J∙mL−1) were calculated based on the particle size density (g∙cm−3) and the calculated initial soil mass (g) of each sample (adjusted based on initial moisture content), the water volume used for sonication (mL), and the energy output (Joules) from the sonicator for each run. A correction factor (0.7) was included that corresponds to the ratio of energy output represented by the sonicator energy output and calculated by the rise in temperature of a given mass of water [42].
Before sonicating, each aggregate suspension was prepared in a 250 ml beaker containing 100 ml of water. The sonicator probe was immersed into the beaker at a depth of 8 cm. After sonicating, the suspension was passed through the sieve corresponding to the original size class of the sub-sample. In all cases, one of the ten subsamples was suspended in water and not subjected to sonication in order to estimate the OM that was waterdispersible.
In this study, the SOM extracted from the aggregate by sonication (passing through the sieve) was called AOM, as it contained organic matter from inside aggregates. Organic matter remaining after the highest sonication, when no more OM was being lost, was termed particulate organic matter (POM).
The OM passing through the sieve (AOM) and OM remaining in the sieve (POM + remaining AOM) were measured by the loss-on-ignition procedure. The AOM of each size class was calculated as a percentage of total SOM (AOM + POM). Using the overall results it was possible to relate both, percentage of AOM and the actual AOM concentration, with different energy inputs for both conventional and conservation agriculture systems. At the end, it was possible with this procedure to measure the proportion of AOM in total soil SOM across different aggregate size classes.
2.3. Statistical Analyses
2.3.1. Soil Organic Carbon
Since, SOM and SOC data were shown to have near normal distributions, an analysis of variance (ANOVA) was applied using STATISTICA (Version 7; 2004) with a factorial design. The main effects were type of tillage (reduced tillage vs. conventional) and horizons (A1, A2, and C). Preliminary analyses indicated that Horizon C was not different among treatments (data not shown), therefore the ANOVA for SOM and SOC involved only the two upper horizons. Significant (P £ 0.05) main and interaction effects were compared with the Duncan post hoc mean separations test.
2.3.2. Aggregated Organic Carbon
Since the measured energy inputs showed a minimum variance across soil samples (data not shown), the energy (J) effect on %AOM was analyzed using energy class category comparisons, ranging from 1 (3.5 J∙mL−1) to 10 (75.5 J∙mL−1). The effect of different energy levels, treatment, and size classes were analyzed for the percentage of AOM released after sonication by applying an ANOVA analysis. Each of the 2 surface horizons was analyzed separately. In addition, the 5 mm soil class was excluded from all analyses because of the low number of observations in this class.
Further statistical analysis was performed separately for %AOM of each size class in order to analyze the effects of energy level with treatment. A post hoc comparison procedure with the Duncan adjustment was used to compare %AOM of size class where treatment had a significant effect. Since energy levels showed a significant effect on %AOM in all size classes, a post hoc Duncan analysis was used to compare %AOM means across the different energy levels for each size class.
The %AOM values were transformed to actual AOM (g∙g−1) released after sample sonication. An analysis of variance (ANOVA) was performed to test the effect of treatment, energy, soil horizon and size class on AOM (g∙g−1). Since there were significant interactions Treatment * Size class; Treatment * Energy level and Size class * Energy level for the two horizons, a further analysis of variance was conducted per size class. A post hoc Duncan means separation was used to test main effects and significant interactions for each size class. The AOM (g∙g−1) and dispersive energy inputs (J∙mL−1) were plotted per size class and treatment.
3. Results
3.1. Effect of Horizons and Tillage Systems on Soil Organic Carbon and Organic Matter
The soil bulk density, SOM and SOC concentrations showed no interactions between main effects (data not shown). Horizons were different for SOC and SOM (Table 3), and the tillage system had a significant effect on bulk density, SOM and SOC. The bulk density was lower in conservation tillage while the SOM and SOC were higher under conservation tillage (Table 4).
The soil C content was estimated using the mass equivalent method. The calculated average soil mass across sites was 6635 t∙ha−1 and 3943 t∙ha−1 for horizons A1 and A2, respectively. The carbon content calculated for these soil masses was different by treatment at P < 0.1 and by horizon at P < 0.05. The A1 horizon had the highest C content with 1097 t C ha−1; while the A2 had an average content of 406 t C ha−1 (Table 3). With respect to treatment, RT sites had an average carbon content in the soil profile of 1636 t C ha−1 vs. 1224 t C ha−1 in conventional tillage; a 33% increase due to conservation tillage (Table 4).
3.2. Effect of Horizons, Tillage Systems and Size Classes on Aggregated Organic Carbon
Size Class × Energy Level and Size Class × Treatment interactions for Horizon A1 existed and horizon A2 was characterized by a three way interaction among all main effects. Analysis of variance for each size class showed that, for both horizons, as the ultrasonic energy applied to the soil increased, more aggregates were destroyed, increasing the amount of AOM removed (Figures 1 and 2). SF2, in both horizons, was directly influenced by tillage treatment. The %AOM, across all energy levels, was uniformly higher with RT (Table 4). In contrast, SF3 for Horizon A1 and SF3/SF4 for Horizon A2 showed significant interaction of treatment with the Energy level (Table 5). At lower energy levels, treatment differences were small. In comparison, for SF3 of the two horizons, conservation agriculture had higher %AOM when applying energy levels 7 and 8 (17 and 32 J∙mL−1, respectively). In
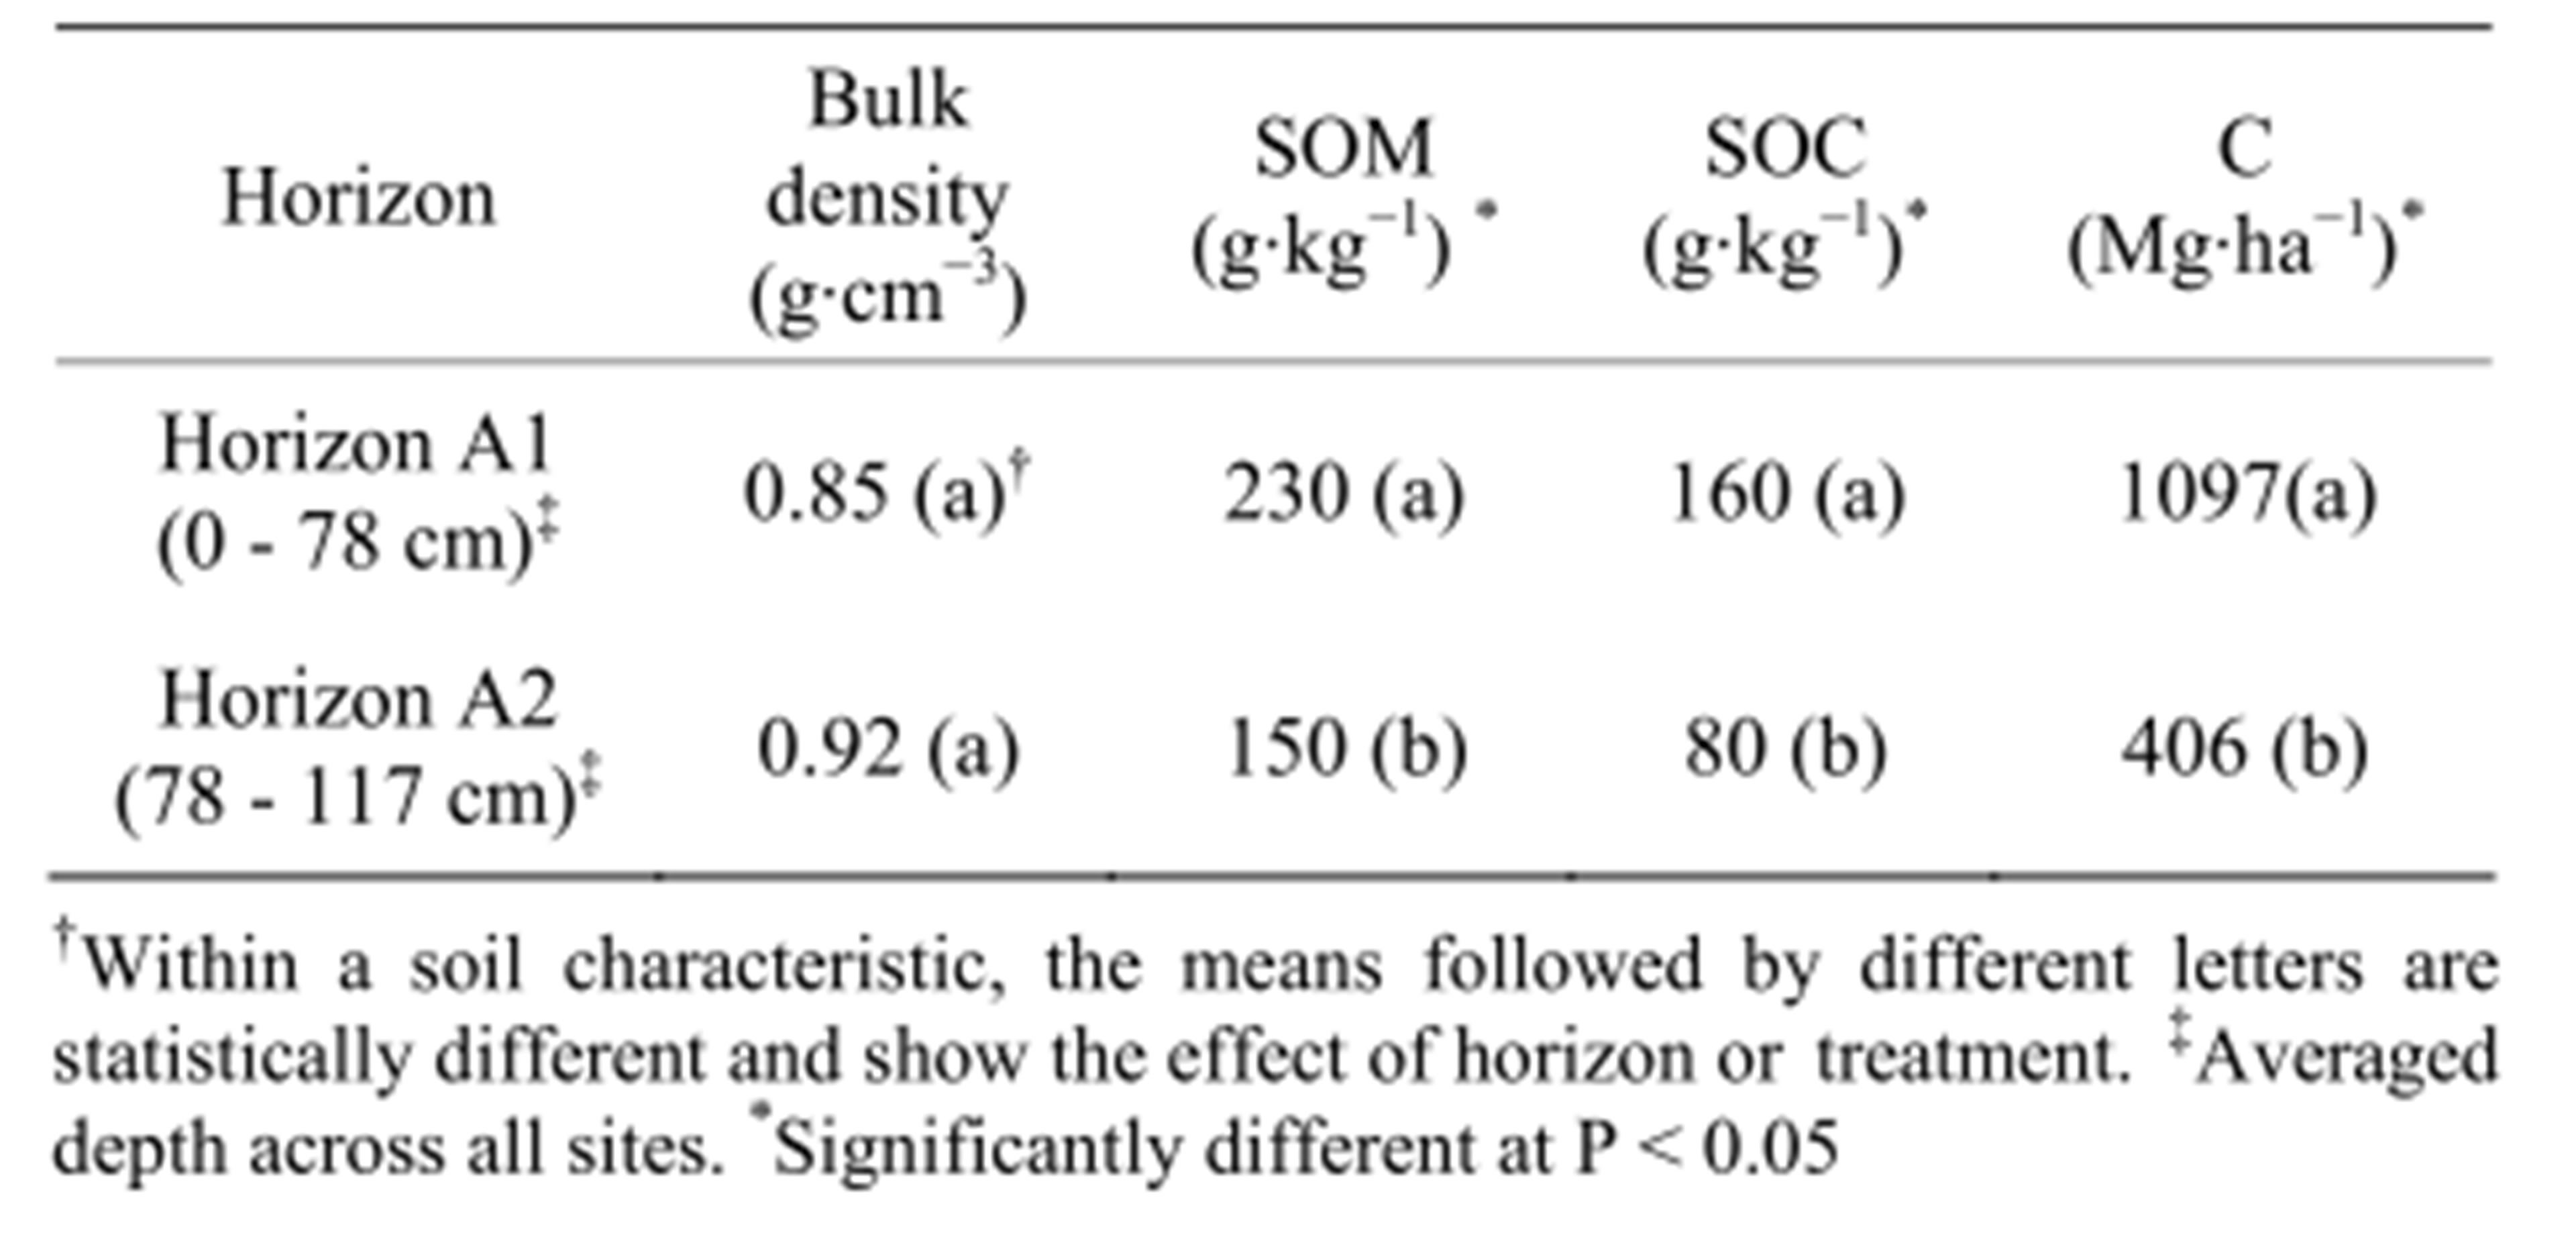
Table 3. Comparison of bulk density, soil organic matter (SOM) and soil organic carbon (SOC) across soil horizons (n = 6).
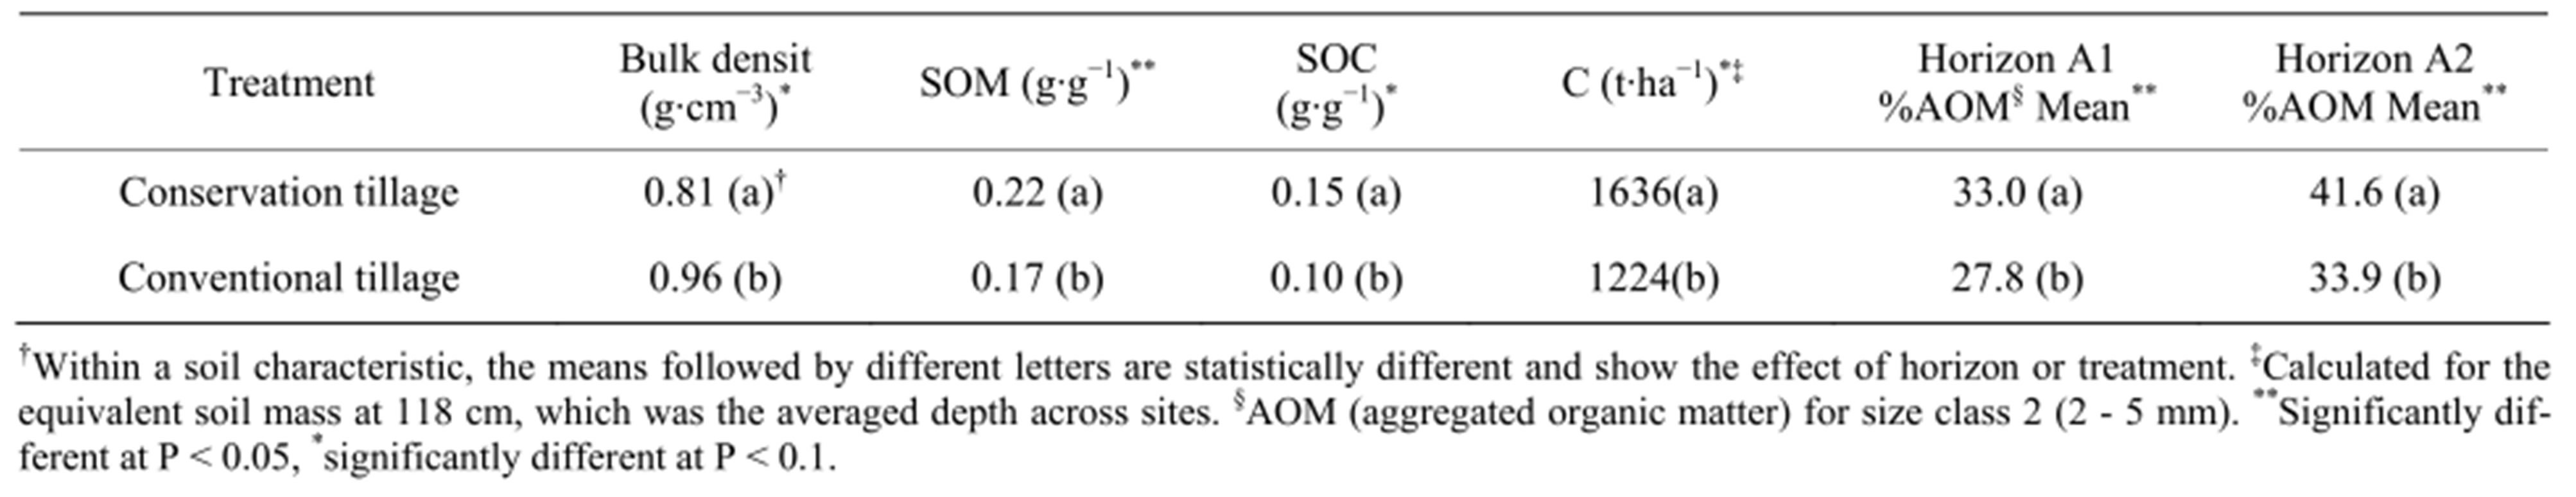
Table 4. Comparison of bulk density, soil organic matter (SOM), soil organic carbon (SOC) and aggregated organic matter (AOM) across treatments (n = 6).

Table 5. Analysis of variance of %AOM and AOM (g∙g−1) (aggregated organic matter)‡ and energy levels per size fraction classes in Horizon A1 and A2.

Figure 1. Aggregated organic matter of all aggregates size classes from horizon A1 (top horizon), released with different energy inputs in two potato management systems (Tillage system had a significant effect only on SOM from size class 3 (SF3)).
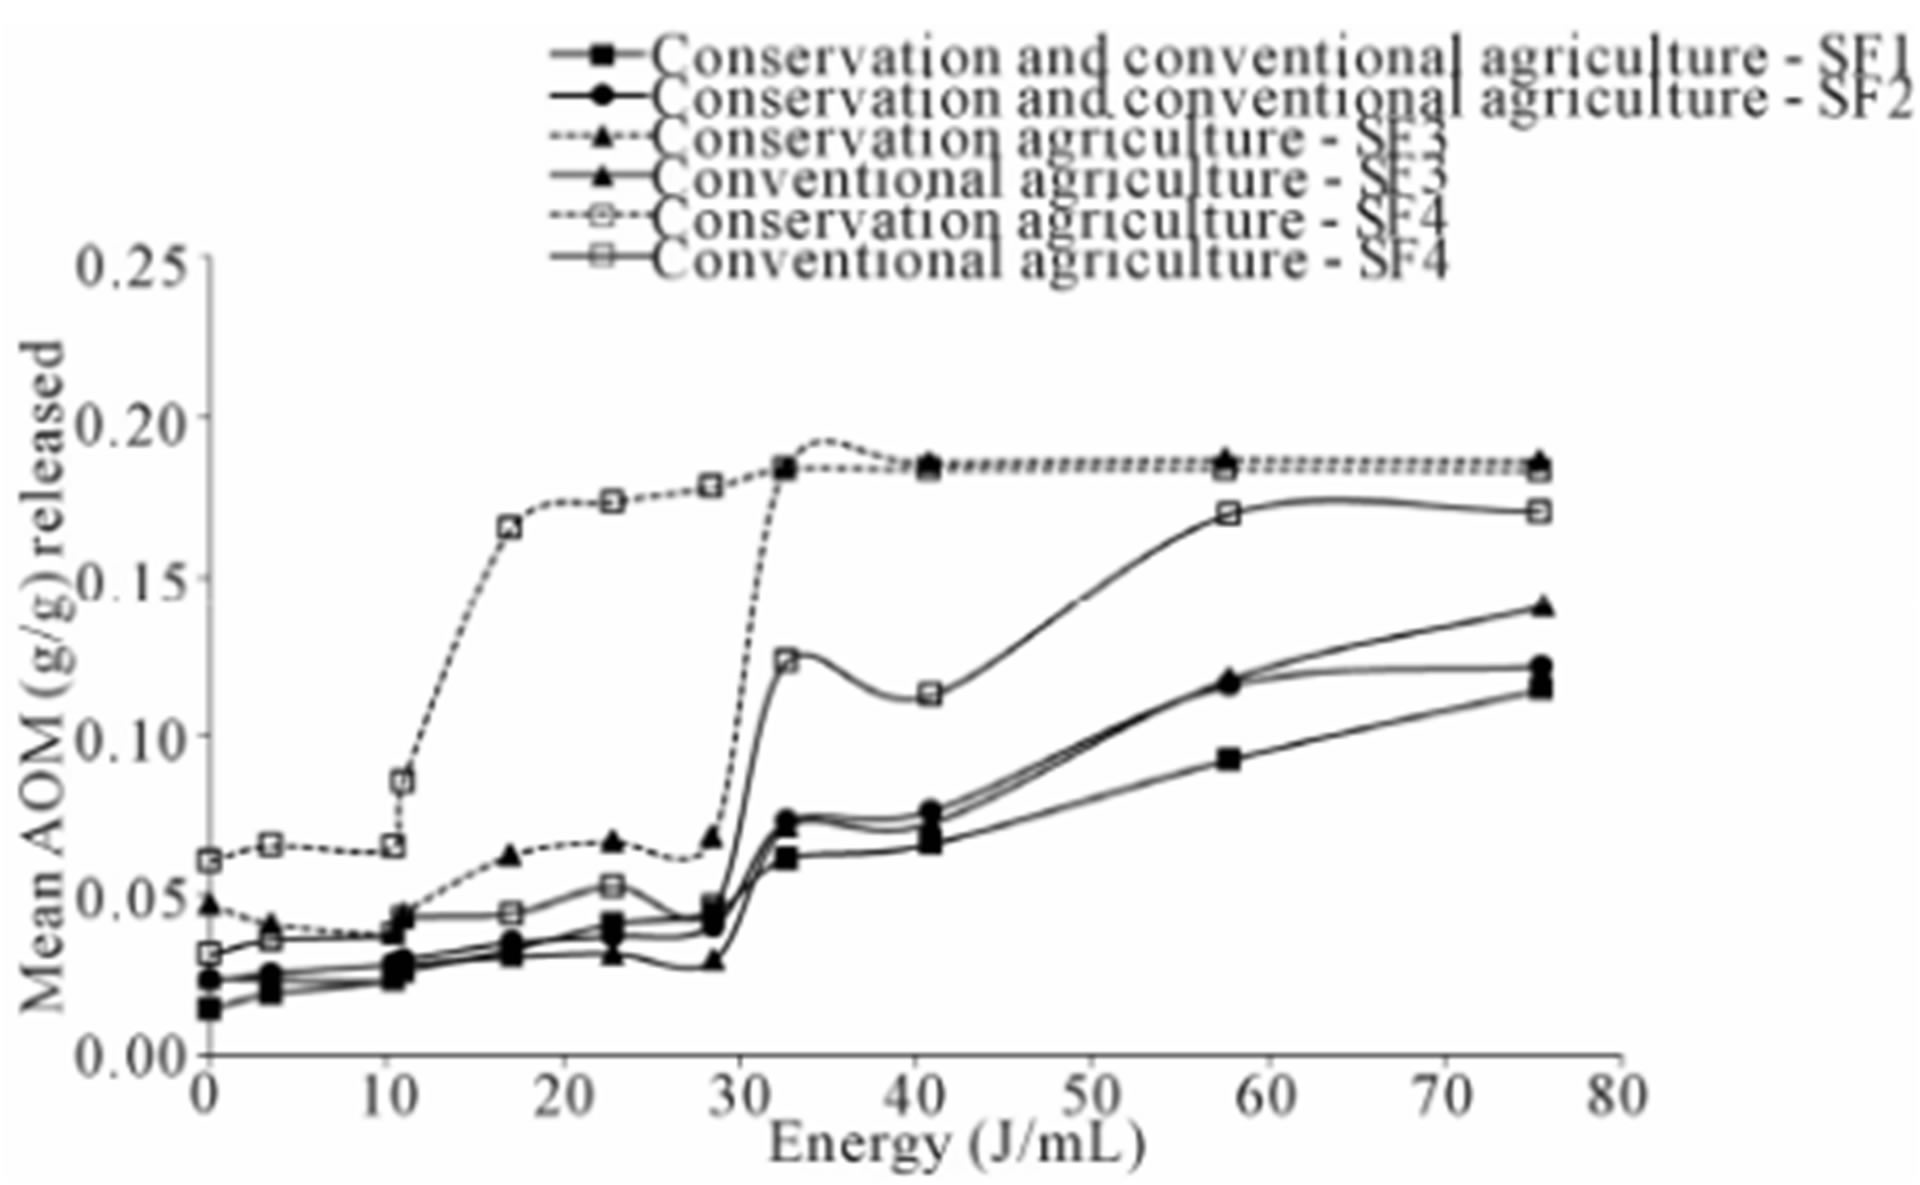
Figure 2. Aggregated organic matter of all size class aggregates for horizon A2 released with different energy inputs from the soil of two potato management systems (Tillage system had a significant effect only on SOM from size classes 3 and 4 (SF3 and SF4)).
SF4 of horizon A2, the %AOM was also higher in conservation agriculture at energies of 17, 22 and 28 J∙mL−1 (Figures 1 and 2). SF1 in both horizons and SF4 from horizon A1 were unaffected by the tillage system (Table 5) The %AOM * Energy (J∙mL−1) curves indicated that, for all size classes, the curve eventually flattened; indicating that all AOM was released with the exception of SF1 (>5 mm) which did not reach a plateau within the energy range used in this study (Figures 1 and 2). After converting the %AOM to AOM (g∙g−1), the analysis of variance showed that the size classes 2, 3, and 4 had a significantly higher concentration of AOM in conservation tillage samples from both horizons (Table 5, Figures 1 and 2). For SF1 there was no treatment effect. Also, size classes 3 and 4 of horizon A2 had exhibited a significant Treatment * Energy (J∙mL−1) interaction (Table 5), showing that the main difference was that AOM (g∙g−1) was released differentially with Energy Level. In SF 3, the differences were found in levels 7, 8 and 9. In SF 4 the differences were in energy levels 5, 6, 7 and 8.
Total aggregated organic matter, which corresponds to the maximum %AOM released after applying the highest Energy Levels (8.4 - 11 kJ), was high on most soil samples, being in the range of 80% to 100% of total organic matter), and only 17% of soil samples released <80% of the total organic matter (between 12% and 79%) (data not shown). This means that about 80% of the total organic carbon was in the aggregate pool.
3.3. Aggregation Hierarchy
All the aggregate energy dispersion curves exhibited a step-wise pattern. All curves have the same step at the 32 J∙mL−1 Energy Level. In some curves, especially for SF3 and SF4 a previous step is recognized at about 17 J/mL−1. A third step at 57 J∙mL−1 was seen for SF2 (Figures 1 and 2) Conservation agriculture, as mentioned above, produced different curves for SF3 in both horizons and SF4 of horizon A2. In SF3, the effect of conservation agriculture was to accentuate the second step of the curve (32 J∙mL−1). It is worth noting that this second step was not pronounced in the conventional agriculture sites (Figures 1 and 2). For SF4 in the horizon A2, the effect of conservation agriculture was mainly on the first step (17 J∙mL−1) making it more pronounced (Figure 2).
4. Discussion
The greater amount of %AOM, SOC (g∙g−1) and SOM (g∙g−1) from soils under conservation agriculture was aligned with results from other studies that also found greater SOC in no-till compared to conventional tillage for a variety of soils types (e.g. Alfisol, Oxisol, Mollisol, Ultisol; [19,27]. This is probably related to a positive linear relationship between SOC and the proportion of crop residues returned to soil described in other studies, i.e., [43-45]. However, most of the SOM and SOC similar studies were concentrated in superficial soil horizons (e.g. 20 cm depth; [19]) and the SOC at greater depths is frequently not studied. Our study explored differences to an average depth of 117 cm (horizons A1 and A2) and the increased higher values of SOM (g∙g−1) with conservation tillage suggested that SOM improvements were promoted throughout the depth of the first two soil horizons.
4.1. Rehabilitation of Soil Organic Carbon and Soil Organic Matter by Conservation Tillage in Andisols
Soil C concentrations in conservation and conventional tillage sites are in the range reported for undisturbed or recolonized humid páramos. In Northern Ecuador and Colombia the A horizon has been reported to have from 0.10 to 0.21 g C g−1 [46,47; Amezquita et al., unpublished data, 2005] while this study recorded 0.15 and 0.18 g∙g−1 in conventional and conservation tillage sites, respectively. Although our conventional tillage values are in that normal range, conservation tillage showed a marked improvement in the C concentration and in the average C content for the soil profile to 117 cm depth with respect to conventional tillage. The average C content had changed from 1224 to 1636 t∙ha−1. Particularly interesting was a 177% increase in the deeper A2 horizon (from 215 to 596 t∙ha−1) although most of the C was stored in the top A1 horizon (1097 t∙ha−1). This increase in C content and AOM, with depth caused by conservation tillage illustrates redistribution of C occurring throughout the soil profile; and is consistent with other reports, i.e., [15,48,49]. This clearly visible effect can be attributed to the effect of the oat cover crop roots that grow to depth in these soils. Considering aggregation formation processes, the penetration of these roots deep into the soil (personal observations) is expected to cause a flush of microbial activity at a lower depth, causing the formation of aggregate binding agents at the scale of macroaggregates [18,19,50]; and therefore the physical protection of OM by these aggregates.
The general improvement in SOC indicates that cover crops and reduced tillage (conservation tillage) has decreased the gap between SOC in conventional tillage and in undisturbed páramos—a 33% C stock increase over conventional tillage. Edwards et al. [51] found that conversion from conventional tillage to conservation tillage in soybeans and corn systems rotated with wheat during winter in a Hapludult of Southern USA also increased soil organic carbon on average by 31% over a 10 yr period. Although the initial organic matter conditions are different between the soils studied by Edwards et al. [51] and our Andisols (0.001 g∙g−1 vs. 0.17 g∙g−1 under conventional tillage), conservation tillage improved those initial levels of organic matter, even in OM-rich soils. This confirms this study’s first objective showing that conservation tillage is effective in increasing SOM even in soils that have a high OM content (15% of OM in soils under conventional agriculture); at least in these unique páramos ecosystems. This counters the results of others who reported that for high OM soils varying C inputs did not have any effect on SOC levels; indicating a state of soil C saturation [52,53]). It highlights the question: What is C saturation?
With respect to organic matter found in other disturbed páramos, the average organic matter concentration of conventional tillage sites (0.17 g∙g−1, Table 4) is greater than the high OM concentrations found in other potato systems in Southern Colombian páramos (0.10 - 0.13 g∙g−1, [54]) and other parcels located in the Fuquene watershed (0.15 g∙g−1, Amezquita et al., unpublished data, 2005). The average organic matter content of conservation tillage sites (0.22 g∙g−1, Table 4) was instead similar to the content reported also by Diaz & Paz [54] of 0.17 - 0.24 g∙g−1 in sites that were previously pastures and that were recently cultivated with potato. These authors attributed this to the remaining effect of pasture roots on the organic matter content that may be similar to the effect of the oat roots in our conservation tillage system. The organic matter content was also similar to the average organic matter reported by Amezquita et al. (unpublished data, 2005) for undisturbed páramos of the Fuquene watershed (0.24 g∙g−1).
Thus, conservation tillage presented higher C concentrations (and organic matter) similar to undisturbed páramos; indicating that conservation tillage can be used to rehabilitate soil carbon under potato production in the region. This positive effect of conservation tillage on the organic matter and carbon contents has been reported by many studies, i.e., [55,56]. It has been suggested that the increase in soil organic carbon associated with the adoption of conservation tillage will continue for a period of 25 to 50 yr depending on climatic conditions, soil characteristics, and production management practices [26, 57-60]. It is unclear how long the increase in SOM will continue in these soils under conservation tillage.
The relevance of these results lies in the fact that while most soil páramos studies have reported how land use changes modify the unique properties of páramos soils, none have explored how better management practices in agriculture can rehabilitate them. The question left unanswered by this study relates to the time frame for which improvements on SOC and organic matter will be achieved with conservation tillage, and also under which baseline conditions conservation tillage could improve disturbed soil properties in páramos. It only suggests that these changes can be brought about in as little as 7 years.
4.2. Higher AOM and SOM in Smaller Macroaggregates
Bossuyt et al. [19] found in Ultisols, that microaggregate-protected and micro within macroaggregate-protected C was higher in no-till (NT) systems than in conventional tillage systems. This was a result of disruption avoidance of macroaggregates with no-till systems. The reason is that when disruption of macroaggregates is avoided, residue that forms the center of a macroaggregate decomposes into finer organic matter that gradually becomes encrusted with clay particles and microbial products, forming microaggregates within macroaggregates [61]. When macroaggregates are disrupted by conventional tillage, OM is released and does not have the time to form microaggregates, resulting in a much smaller amount of microaggregates within macroaggregates [3,9, 17]. Thus although these results suggest that microaggregates are important for ensuring SOM protection, macroaggregates stabilization is important for this protection to occur [19]. In the same sense, Six et al. [9] suggested that a reduced rate of macroaggregate turnover under no-till increases the formation of microaggregates in which C is stabilized and sequestered in the long-term. The same author found that the amount of microaggregates protected in macroaggregates was two times greater with no-till compared to conservation tillage [17]. Similarly, Denef et al. [27] reported for a Mollisol an increase of microaggregates within smaller macroaggregates (0.25 - 2 mm size) between 20% - 39% with no-till compared to conventional treatment. We postulate that higher amounts of SOM in SF2, SF3 and SF4 found in this study, and specially a relative greater increase of AOM in SF3 and SF4 (0.5 - 2 mm size) with respect to conventional agriculture, may be related to an increase of microaggregates within these smaller macroaggregates.
The rationale behind the above thought is that the AOM in SF3 and SF4 was released at specific energy levels noted clearly by a step-wise curve denoting a hierarchical order of aggregation. According to Duiker [62], when increasing levels of energy are applied, aggregates of most soils fall apart into smaller aggregates in a stepwise manner. Conservation agriculture produced different curves for SF3 of both horizons and SF4 of horizon A2. In both cases, some steps of the curve were accentuated as more AOM was released after applying the energy levels corresponding to these steps. We inferred that those specific energy levels (17 J∙mL−1 and 32 J∙mL−1) correspond to the energy levels where the macroaggregates broke down into microaggregates. This is supported by the pattern of aggregation explained by Oades and Waters [63] for Mollisols and Alfisols when they described a hierarchical structure where larger, weaker aggregates break down to release smaller, stronger aggregates before breaking down into primary particles. In consequence, these distinct units can be separated as defined by our aggregate dispersion energy curves.
Denef et al. [27] found in different soil types that 91% of the difference in total SOC between no-till and conventional tillage was explained by the C associated with microaggregates that were isolated from smaller macroaggregates (0.25 - 2 mm). Similarly, considering that our study found more than 80% of the total carbon in aggregates, we suggest that the 29% difference in Total SOM (g∙g−1) between conservation tillage and conventional tillage is explained by increments of AOM in SF2, SF3 and SF4—classes where AOM increases were detected. Kong et al. [10] also found that the majority of the accumulation of SOC due to additional C inputs in agricultural lands was preferentially sequestered in the microaggregates within-small-macroaggregates (mM). For this reason they proposed the use of the mM class (microaggregates within small macroaggregates) as an indicator for C sequestration potential in agroecosystems. This corresponds to the same macroaggregate class for which we found improvements of AOM. In horizon A1 (0 - 78 cm) the differences between conservation agriculture and conventional agriculture were 37%, 33% and 30% for SF2, SF3 and SF4 respectively, and 58%, 99% and 98% in SF2, SF3 and SF4 of horizon A2 (78 - 117 cm).
Thus, this study confirms the findings of Denef et al. [27] and Kong et al. [10] in that most changes in total SOC were explained by differences in AOM caused by no-till (in our case reduced tillage and cover crops) in smaller macroaggregates (0.25 - 2 mm). Therefore our results tentatively support Kong et al. [10] in the use of the microaggregate-within small macroaggregate class as a potential indicator of long-term C sequestration in agricultural lands. The protection mechanisms—including the effect of mineralogy and climate, invoked by this relationship as well as the separate effect of reduced tillage and cover crops at different soil depth should be the topic of future studies.
4.3. Other Considerations
The higher values of %AOM derived from smaller macroaggregates (SF3 and SF4) suggest that in these classes the C has a slower turnover than the C in bigger macroaggregates (>2 mm). Based on Kong et al. [10] findings, where increases on C stabilization in the smaller macroaggregates were associated to greater aggregate stability and long-term sequestration, we suggest in the same direction that the higher AOM and SOM in smaller macroaggregates in our soils is linked to greater C and aggregate stability and in consequence is contributing to long-term C sequestration in the Andes. In addition, increases of AOM may be related to improvement of soil structure. The conservation agriculture curves for SF3 and SF4 had better defined hierarchal steps than did the conventional agriculture curves. Since well-defined steps indicate well developed structure, we suggest that conservation agriculture in these Andean soils also improves structure.
5. Conclusions
Reduced tillage and cover crops in potato-based systems improved in a 7-year period the soil organic matter and carbon content in disturbed soils of the páramos of Colombia. The soil carbon concentration in the whole profile was 29% higher under conservation tillage than under conventional tillage sites and the carbon content was higher by 33%. C content improvement was the greatest in the subsoil (A2 horizon) increasing by 177% although most of the C is stored in the top A1 horizon. This may be mostly an effect of cover crops. These improvements reflect that conservation tillage (reduced tillage and cover crops) is allowing the rehabilitation of soil carbon compared to conventional tillage systems.
In the Andisols analyzed in this study, the soils had more than 80% of total OM as AOM, and conservation agriculture involving reduced tillage and cover crops in these Andean soils increased AOM. This study was able to evaluate the effects of conservation and conventional agriculture by studying differences in AOM. The major differences in AOM were seen to occur in smaller macroaggregates (0.5 - 2 mm size classes). The aggregate dispersion energy curves further suggest that this is happening in microaggregates within the smaller macroaggregates class. Similar results have been obtained for other soils suggesting that smaller macroaggregates can be used to evaluate potential of long-term C sequestration in some Alfisols, Mollisols, Ultisols and now Andisols.
6. Acknowledgements
The authors acknowledge the CGIAR Challenge Program on Water & Food for support in implementing this study. Also thank the many contributors to this analysis, Arnulfo Rodríguez (CIAT) for helping during soil field sampling and lab analysis, Elena Azuaje (UF soils lab) for training on sonication methods, Wilson Otero (FUNDESOT) and Diego Perez (CAR—Regional Autonomous Corporation) and its conservation tillage extension agents for describing the systems and helping to identify the selected farms for this study, farmers of Carmen de Carupa municipality for allowing the field sampling, Drs. Cheryl Mackowiack and David Wright (NFREC-UF) for comments on earlier drafts.
REFERENCES
- E. T. Sundquist, “The Global Carbon Dioxide Budget,” Science, Vol. 259, No. 5097, 1993, pp. 936-961. http://dx.doi.org/10.1126/science.259.5097.934
- F. J. Stevenson, “Humus Chemistry: Genesis, Composition, Reactions,” 2nd Edition, John Wiley and Sons Ltd., New York, 1994.
- J. Six, E. T. Elliott, K. Paustian and J. W. Doran, “Aggregation and Soil Organic Matter Accumulation in Cultivated and Native Grassland Soils,” Soil Science Society of America Journal, Vol. 62, No. 5, 1998, pp. 1367-1377. http://dx.doi.org/10.2136/sssaj1998.03615995006200050032x
- M. Robbins, “Carbon Trading, Agriculture and Poverty,” World Association of Soil and Water Conservation (WASWC), Special Publication No. 2, 2004, Beijing.
- J. D. Jastrow, T. W. Boutton and R. M. Millar, “Carbon Dynamics of Aggregate-Associated Organic Matter Estimated by Carbon-13 Natural Abundance,” Soil Science Society of America Journal, Vol. 60, No. 3, 1996, pp. 801-807. http://dx.doi.org/10.2136/sssaj1996.03615995006000030017x
- A. P. Edwards and J. M. Bremmer, “Microaggregates in Soils,” Journal of Soil Science, Vol. 18, No. 1, 1967, pp. 64-73. http://dx.doi.org/10.1111/j.1365-2389.1967.tb01488.x
- T. Maeda, H. Takenaka and B. P. Warkentin, “Physical Properties of Allophane Soils,” Advances in Agronomy, Vol. 29, 1977, pp. 229-264. http://dx.doi.org/10.1016/S0065-2113(08)60220-5
- J. D. Jastrow, T. W. Boutton and R. M. Millar, “Carbon Dynamics of Aggregate-Associated Organic Matter Estimated by Carbon-13 Natural Abundance,” Soil Science Society of America Journal, Vol. 60, No. 3, 1996, pp. 801-807. http://dx.doi.org/10.2136/sssaj1996.03615995006000030017x
- J. Six, E. T. Elliott and K. Paustian, “Aggregate and Soil Organic Matter Dynamics under Conventional and NoTillage Systems,” Soil Science Society of America Journal, Vol. 63, No. 5, 1999, 1350-1358. http://dx.doi.org/10.2136/sssaj1999.6351350x
- A. Y. Kong, J. Six, D. C. Bryant, R. F. Denison and C. van Kessel, “The Relationship between Carbon Input, Aggregation, and Soil Organic Carbon Stabilization in Sustainable Cropping Systems,” Soil Science Society of America Journal, Vol. 69, No. 4, 2005, pp. 1078-1085. http://dx.doi.org/10.2136/sssaj2004.0215
- E. T. Elliott, “Aggregate Structure and Carbon, Nitrogen and Phosphorus in Native and Cultivated Soils,” Soil Science Society of America Journal, Vol. 50, No. 3, 1986, pp. 627-633. http://dx.doi.org/10.2136/sssaj1986.03615995005000030017x
- C. A. Cambardella and E. T. Elliott, “Methods for Physical Separation and Characterization of Soil Organic Matter Fractions,” Geoderma, Vol. 56, No. 1-4, 1993, pp. 449-457. http://dx.doi.org/10.1016/0016-7061(93)90126-6
- R. M. Bajracharya, R. Lal and J. M. Kimble, “Soil Organic Carbon Distribution in Aggregates and Primary Particle Fractions as Influenced by Erosion Phases and Landscape Positions,” In: R. Lal, J. M. Kimble, R. F. Follet and B. A. Stewart, Eds., Soil Processes and the Carbon Cycle, CRC Press, Boca Raton, 1997, pp. 353-368.
- D. A. Angers and C. Chenu, “Dynamics of Soil Aggregation and C Sequestration,” In: R. Lal, J. M. Kimble, R. F. Follet and B. A. Stewart, Eds., Soil Processes and the Carbon Cycle, CRC Press, Boca Raton, 1997, pp. 199-206.
- M. H. Beare, P. F. Hendrix and D. C. Coleman, “WaterStable Aggregates and Organic Matter Fractions in Conventional and No-Tillage Soils,” Soil Science Society of America Journal, Vol. 58, No. 3, 1994, pp. 777-786. http://dx.doi.org/10.2136/sssaj1994.03615995005800030020x
- M. R. Carter, “Influence of Reduced Tillage Systems on Organic Matter, Microbial Biomass, Macro-Aggregate Distribution and Structural Stability of the Surface Soil in a Humid Climate,” Soil & Tillage Research, Vol. 23, No. 4, 1992, pp. 361-372. http://dx.doi.org/10.1016/0167-1987(92)90081-L
- J. Six, E. T. Elliott and K. Paustian, “Soil Macroaggregate Turnover and Microaggregate Formation: A Mechanism for C Sequestration under No-Tillage Agriculture,” Soil Biology & Biochemistry, Vol. 32, No. 14, 2000, pp. 2099- 2103. http://dx.doi.org/10.1016/S0038-0717(00)00179-6
- J. M. Tisdall and J. M. Oades, “Organic Matter and Water-Stable Aggregate and Soil Organic Aggregates in Soils,” Journal of Soil Science, Vol. 33, No. 2, 1982, pp. 141-163. http://dx.doi.org/10.1111/j.1365-2389.1982.tb01755.x
- H. Bossuyt, J. Six and P. F. Hendrix, “Aggregate-Protected Carbon in No-tillage and Conventional Tillage Agroecosystems Using Carbon-14 Labeled Plant Residue,” Soil Science Society of America Journal, Vol. 66, No. 6, 2002, pp. 1965-1973. http://dx.doi.org/10.2136/sssaj2002.1965
- D. A. Angers, “Changes in Soil Aggregation and Organic carbon under Corn and Alfalfa,” Soil Science Society of America Journal, Vol. 56, No. 4, 1992, pp. 1244-1249. http://dx.doi.org/10.2136/sssaj1992.03615995005600040039x
- J. S. Kern and M. G. Johnson, “Conservation Tillage Impacts on National Soil and Atmospheric Carbon Levels,” Soil Science Society of America Journal, Vol. 57, No. 1, 1993, pp. 200-210. http://dx.doi.org/10.2136/sssaj1993.03615995005700010036x
- I. C. Burke, E. T. Elliott and C. V. Cole, “Influence of Macroclimate, Landscape Position and Management on Soil Organic Matter in Agroecosystems,” Ecological Applications, Vol. 5, No. 1, 1995, pp. 124-131. http://dx.doi.org/10.2307/1942057
- R. Nelson, C. M. Hellwinckel, C. C. Brandt, T. O. West, D. De la Torre Ugarte and G. Marland, “Energy Use and Carbon Dioxide Emissions from Cropland Production in the United States, 1990-2004,” Journal of Environmental Quality, Vol. 38, No. 2, 2009, pp. 418-425. http://dx.doi.org/10.2134/jeq2008.0262
- D. H. Muller, T. C. Daniel and R. C. Wendt, “Conservation Tillage: Best Management Practice for Nonpoint Runoff,” Environmental Management, Vol. 5, No. 1, 1981, pp. 33-53. http://dx.doi.org/10.1007/BF01866608
- J. Rubiano, M. Quintero, R. D. Estrada and A. Moreno, “Multiscale Analysis for Promoting Integrated Watershed Management,” Water International, Vol. 31, No. 3, 2006, pp. 398-411. http://dx.doi.org/10.1080/02508060608691941
- A. J. Franzluebbers, F. M. Hons and D. A. Zuberer, “Tillage and Crop Effects on Seasonal Dynamics of Soil CO2 Evolution, Water Content, Temperature, and Bulk Density,” Applied Soil Ecology, Vol. 2, No. 2, 1995, pp. 95-109. http://dx.doi.org/10.1016/0929-1393(94)00044-8
- K. Paustian, J. Six, E. T. Elliott and H. W. Hunt, “Management Options for Reducing CO2 Emissions from Agricultural Soils,” Biogeochemistry, Vol. 48, No. 1, 2000, pp. 147-163. http://dx.doi.org/10.1023/A:1006271331703
- K. Denef, J. Six, R. Merckx and K. Paustian, “Carbon Sequestration in Microaggregates of No-Tillage Soils with Different Clay Mineralogy,” Soil Science Society of America Journal, Vol. 68, No. 6, 2004, pp. 1935-1944. http://dx.doi.org/10.2136/sssaj2004.1935
- Japanese International Cooperation Agency—JICA, “El Estudio Sobre Plan de Mejoramiento Ambiental Regional Para la Cuenca de la Laguna de Fuquene,” CTI Engineering International co., Ltd., 2000.
- Instituto de Hidrología, “Meteorología y Estudios Ambientales (IDEAM), Climatic Data,” Tausa municipality Station, Colombia, 2004.
- Instituto Geográfico Agustín Codazzi (IGAC), “Estudio General de Suelos y Zonificación de Tierras del Departamento de Cundinamarca,” Bogota, Colombia, 2000.
- W. Buytaert, R. Celleri, B. De Bièvre, R. Hofstede, F. Cisneros, G. Wyseure and J. Deckers, “Human Impact on the Hydrology of the Andean Páramos,” Earth Science Reviews, Vol. 79, No. 1-2, 2006, pp. 53-72. http://dx.doi.org/10.1016/j.earscirev.2006.06.002
- W. Buytaert, J. Sevink, B. D. Leeuw and J. Deckers, “Clay Mineralogy of the Soils in the South Ecuadorian Páramo Region,” Geoderma, Vol. 127, No. 1-2, 2005, pp. 114-129. http://dx.doi.org/10.1016/j.geoderma.2004.11.021
- D. W. Nelson and L. E. Sommers, “Total Carbon, Organic Carbon, and Organic Matter,” In: D. L. Sparks, Ed., Methods of Soil Analysis. Part 3. Chemical Methods, SSSA Book Ser. 5. SSSA, Madison, 1996, pp. 961-1010.
- E. E. Schulte and B. G. Hopkins, “Estimation of Soil Organic Matter by Weight Loss-on-Ignition,” In: F. R. Magdoff, et al., Eds., Soil Organic Matter: Analysis and Interpretation, SSSA Spec. Publ. 46, Madison, 1996, pp. 21-31.
- B. H. Ellert, H. H. Janzen and T. Entz, “Assessment of a Method to Measure Temporal Change in Soil Carbon Storage,” Soil Science Society of America Journal, Vol. 66, No. 5, 2002, pp. 1687-1695. http://dx.doi.org/10.2136/sssaj2002.1687
- E. Elliot, J. Heil, E. Kelly and H. C. Monger, “Soil Structural and Other Physical Properties,” In: G. P. Robertson, D. Coleman, C. Bledsoe and P. Sollins, Eds., Standard Soil Methods for Long-term Ecological Research, LTER, Oxford University Press, New York, 1999.
- A. Klute, “Methods of Soil Analysis. Part 1, Physical and Mineralogical Methods,” 2nd Edition, Agronomy 9, American Society of Agronomy, Madison, 1986.
- P. F. North, “Towards an Absolute Measurement of Soil Structural Stability Using Ultrasound,” Journal of Soil Science, Vol. 27, No. 4, 1976, pp. 451-459. http://dx.doi.org/10.1111/j.1365-2389.1976.tb02014.x
- J. Six, G. Guggenberger, K. Paustian, L. Haumaier, E. T. Elliott and W. Zech, “Sources and Composition of Soil Organic Matter Fractions between and within Soil Aggregates,” European Journal of Soil Science, Vol. 52, No. 4, 2001, pp. 607-618. http://dx.doi.org/10.1046/j.1365-2389.2001.00406.x
- C. W. Swanston, M. S. Torn, P. J. Hanson, J. R. Southon, C. T. Garten, E. M. Hanlon and L. Ganio, “Initial Characterization of Processes of Soil Carbon Stabilization Using Forest Standlevel Radiocarbon Enrichment,” Geoderma, Vol. 128, No. 1-2, 2005, pp. 52-62. http://dx.doi.org/10.1016/j.geoderma.2004.12.015
- D. V. Sarkhot, N. B. Comerford, E. J. Jokela, J. B. Reeves III and W. G. Harris, “Aggregation and Aggregate Carbon in a Forested Southeastern Coastal Plain Spodosol,” Forest, Range and Wildland Soils, Vol. 71, No. 6, 2007, pp. 1779-1787.
- S. Kuo, U. M. Sainju and E. J. Jellum, “Winter Cover Crops Effects on Soil Organic Carbon and Carbohydrate in Soil,” Soil Science Society of America Journal, Vol. 61, No. 1, 1997, pp. 145-152. http://dx.doi.org/10.2136/sssaj1997.03615995006100010022x
- P. E. Rasmussen, R. R. Allmaras, C. R. Rohde and N. C. Roager Jr., “Crop Residue Influences on Soil Carbon and Nitrogen in Wheat-Fallow System,” Soil Science Society of America Journal, Vol. 44, No. 3, 1980, pp. 596-600. http://dx.doi.org/10.2136/sssaj1980.03615995004400030033x
- C. V. Cole, K. Flach, J. Lee, D. Sauerbeck and B. Stewart, “Agricultural Sources and Sinks of Carbon,” Water, Air, and Soil Pollution, Vol. 70, No. 1-4, 1993, pp. 111-122. http://dx.doi.org/10.1007/BF01104991
- P. Podwojewski, L. Poulenard, T. Zambrana, and R. Hofstede, “Overgrazing Effects on Vegetation Cover and Properties of Volcanic Ash Soil in the Páramo of Llangahua and La Esperanza (Tungurahua, Ecuador),” Soil Use and Management, Vol. 18, No. 1, 2002, pp. 45-55. http://dx.doi.org/10.1079/SUM2002100
- J. Poulenard, P. Podwojewski and A. J. Herbillon, “Characteristics of Non-Allophanic Andisols with Hydric Properties from the Ecuadorian Paramos,” Geoderma, Vol. 117, No. 3-4, 2003, pp. 267-281. http://dx.doi.org/10.1016/S0016-7061(03)00128-9
- M. R. Carter and D. A. Rennie, “Changes in Soil Quality under Zero Tillage Farming Systems: Distribution of Microbial Biomass and Mineralizable C and N Potentials,” Canadian Journal of Soil Science, Vol. 62, No. 4, 1982, pp. 587-597. http://dx.doi.org/10.4141/cjss82-066
- A. J. VandenBygaart, X. M. Tang, B. D. Kay and J. D. Aspinall, “Variability in Carbon Sequestration Potential in No-Till Soil Landscapes of Southern Ontario,” Soil and Tillage Research, Vol. 65, No. 2, 2002, pp. 231-241. http://dx.doi.org/10.1016/S0167-1987(02)00003-X
- C. A. Cambardella, “Aggregation and Organic Matter,” In: R. Lal, Ed., Encyclopedia of Soil Sciences, School of Natural Resources, The Ohio State University, Marcel Dekker, Inc. New York, 2002, pp. 52-55.
- J. H. Edwards, C. W. Wood, D. L. Thurlow and M. E. Ruf, “Tillage and Crop Rotation Effects on Fertility Status of a Hapludult Soil,” Soil Science Society of America Journal, Vol. 56, No. 5, 1992, pp. 1577-1582. http://dx.doi.org/10.2136/sssaj1992.03615995005600050040x
- C. A. Campbell, K. E. Bowren, M. Schnitzer, R. P. Zentner and L. Townley-Smith, “Effect of Crop Rotations and Fertilization on Soil Biochemical Properties in a Thick Black Chernozem,” Canadian Journal of Soil Science, Vol. 71, No. 3, 1991, pp. 377-387.
- J. Six, R. T. Conant, E. A. Paul and K. Paustian, “Stabilization Mechanisms of Soil Organic Matter: Implications for C-Saturation of Soils,” Plant and Soil, Vol. 241, No. 2, 2002, pp. 155-176. http://dx.doi.org/10.1023/A:1016125726789
- E. B. Díaz and L. P Paz, “Evaluación del Régimen de Humedad del Suelo Bajo Diferentes Usos, en los Páramos Las Animas (Municipio de Silvia) y Piedra de León (Municipio de Sotará). Departamento del Cauca,” MSc Thesis, Fundacion Universitaria de Popayan, Popayán, 2002.
- F. Grant, “Changes in Soil Organic Matter under Different Tillage and Rotations: Mathematical Modeling in Ecosystems,” Soil Science Society of America Journal, Vol. 61, No. 4, 1997, pp. 1159-1175. http://dx.doi.org/10.2136/sssaj1997.03615995006100040023x
- A. Black and D. Tanaka, “A Conservation Tillage Cropping Systems Study in the Northern Great Plains of the United States,” In: E. Paul, K. Paustien, E. Elliott and C. Cole, Eds., Soil Organic Matter in Temperate Agroecosystems, CRC Press, Boca Raton, 1997, pp. 335-342.
- A. Franzluebbers, “Soil Microbial Biomass and Mineralizable Carbon of Water-Stable Aggregates,” Soil Science Society of America Journal, Vol. 61, No. 4, 1997, pp. 1090- 1097. http://dx.doi.org/10.2136/sssaj1997.03615995006100040015x
- P. G. Hunt, “Changes in Carbon Content of a Norfolk Loamy Sand after 14 Years of Conservation or Conventional Tillage,” Journal of Soil and Water Conservation, Vol. 51, No. 3, 1996, pp. 255-258.
- C. Wood, J. Edwards and C. Cummins, “Tillage and Crop Rotation Effects on Soil Organic Matter in a Typic Hapludalt of Northern Alabama,” Journal of Sustainable Agriculture, Vol. 2, No. 2, 1992, pp. 31-41. http://dx.doi.org/10.1300/J064v02n02_04
- [61] T. Zobeck, N. Rolong, D. Fryear, J. Bilbro and B. Allen, “Properties of Recently Tilled Sod, 70-Year Cultivated Soil,” Journal of Soil and Water Conservation, Vol. 50, No. 2, 1995, pp. 210-215.
- [62] J. M. Oades, “Soil Organic Matter and Structural Stability: Mechanisms and Implications for Management,” Plant and Soil, Vol. 76, No. 1-3, 1984, pp. 319-337. http://dx.doi.org/10.1007/BF02205590
- [63] S. W. Duiker, “Aggregation,” In: R. Lal, Ed., Encyclopedia of Soil Sciences, School of Natural Resources, The Ohio State University, Marcel Dekker, Inc., New York, 2002, pp. 49-51.
- [64] J. M. Oades and A. G. Waters, “Aggregate Hierarchy in Soils,” Australian Journal of Soil Research, Vol. 29, No. 6, 1991, pp. 815-828. http://dx.doi.org/10.1080/028418501127346846
NOTES
*Corresponding author.