Open Journal of Soil Science
Vol.1 No.2(2011), Article ID:7601,5 pages DOI:10.4236/ojss.2011.12007
SOC Turnover and Lime-CO2 Evolution during Liming of an Acid Andisol and Ultisol
![]()
1Department of Plant Science, Nueva Vizcaya State University, Bayombong, Nueva Vizcaya, Philippines; 2Department of Biological and Environmental Engineering, University of Tokyo, Tokyo, Japan.
Email: *dumalewajr@soil.en.a.u-tokyo.ac.jp; dumalewajr@nvsu.edu.ph
Received June 15th, 2011; revised July 24th, 2011; accepted August 10th, 2011
Keywords: Agricultural Liming, Soil Organic Carbon, SOC Turnover, Andisol, Ultisol
ABSTRACT
Agricultural liming contributes significantly to atmospheric CO2 emission from soils but data on magnitude of limecontributed CO2 in a wide range of acid soils are still few. Data on lime-contributed CO2 and SOC turnover for global acid soils are needed to estimate the potential contribution of agricultural liming to atmospheric CO2. Using Ca13CO3 (13C 99%) as lime and tracer, here we separated lime-contributed and SOC-originated CO2 evolution in an acidic Kuroboku Andisol from Tanashi, Tokyo Prefecture (35˚44′ N, 139˚32′ E) and Kunigami Mahji Ultisol of Nakijin, Okinawa Prefecture, Japan (26˚38′ N, 127˚58′ E). On the average, lime-CO2 was 76.84% (Kuroboku Andisol) and 66.36% (Kunigami Mahji Ultisol) of overall CO2 emission after 36 days. There was increased SOC turnover in all limed soils, confirming priming effect (PE) of liming. The calculated PE of lime (Kuroboku Andisol, 51.97% - 114.95%; Kunigami Mahji Ultisol, 10.13% - 35.61%) was entirely 12C turnover of stable soil organic carbon (SOC) since SMBC, a labile SOC pool, was suppressed by liming in our experiment. Our results confirmed that mineralization of lime-carbonates is the major source of CO2 emission from acid soils during agricultural liming. Liming can influence the size of CO2 evolution from agricultural ecosystems considering global extent of acid soils and current volume of lime utilization. We propose the inclusion of liming in simulating carbon dynamics in agricultural ecosystems.
1. Introduction
Agricultural liming has increased with agricultural intensification and periodic use has become necessary to counteract acidification of cultivated soils [1,2] brought by inorganic fertilization, cultivation of N-fixing crops, and crop removal. The chemical liberation of CO2 from lime has been recognized to contribute significantly to the CO2 emissions from agricultural soils [3,4]. However, the default methodology of the Intergovernmental Panel for Climate Change that assumes that all carbon in applied lime dissolve as CO2 [5] tends to overestimate lime contribution to atmospheric CO2. This is challenged by several authors [6,7]. Biological theory suggests that the dissolution of carbonate minerals can act as either a net source or sink for CO2 [6], depending whether the reaction occurs with either strong acids or carbonic acid. The dissolved “soil CO2”, from root and microbial respiration exists in equilibrium with the weak acid H2CO3. Soil CO2 reacts with the lime involving dolomite as an example:
 .
.
This case is a sink for soil CO2 since the reaction produces two moles of CO2-equivalent ( ) for every mole of gaseous CO2 taken up. Most of the dissolution of carbonate minerals in moderately acid, neutral and alkaline soils can be pointed to carbonic acid weathering. This is the major natural process of limestone weathering and the primary source of alkalinity of most surface and groundwaters [8]. If, however, H+ comes in contact with the
 , it will be consumed and CO2 will be produced [6]. During nitrification of
  to
to , strong acids such as HNO3 may be present, and the dissolution of carbonate minerals acts as a CO2 source:
This reaction becomes important at pH < 5 and greatly enhances the dissolution rate of lime [9]. Experimental data is still insufficient to reliably estimate how much of the applied lime is released as CO2 to the atmosphere [5], and its effect to the soil organic carbon (SOC) pools.
Results on effects of lime on CO2 emissions are highly diverse [10]; hence, a refinement of the CO2 emissions as a consequence of liming in acid soils is needed. The use of tracers allows the separation of lime and SOC-CO2, which is impossible using conventional methods. In the present study, we separated limeand SOC-CO2 using Ca13CO3 (13C 99%) as lime and tracer. Specifically, the study aimed to determine (1) the relative contribution of applied lime and SOC to CO2 evolution; and (2) measure the priming effect (PE) of lime to SOC.
2. Materials and Methods
2.1. Soil Sampling and Incubation Experiment
Two acid soils high and low in carbon content (Table 1): a Kuroboku Andisol from Tanashi, Tokyo Prefecture (35˚44′ N 139˚32′ E) and Kunigami Mahji Ultisol of Nakijin, Okinawa Prefecture, Japan (26˚38′ N 127˚58′ E) were used. The soil samples were sieved in 2-mm copper sieve after air drying for two to three days. Visible roots and other organic debris were handpicked during sieving. In a separate experiment, the field capacity (FC) of the samples was measured for moisture adjustments in the experimental treatments. To determine the amount of lime (Ca13CO3; 13C 99 %) needed to raise the soil pH to 6.5 (results in Table 1), a separate liming experiment using the calcium carbonate and aeration method [11] was done. Laboratory incubation was conducted at 20˚C constant temperature for 36 days in transparent 500-ml glass bottles [12]. Experimental units consisted of 10 g soil adjusted to 70 (FC70) and 30% (FC30) of the soils’ field capacity. The lime was incorporated to the soil before sealing the bottles. Air and moisture were replenished inside the bottles every six days. This was done by passing the air in a canister of de-ionized water. The inlet and outlet valves of the experimental bottles were allowed open for two minutes for this purpose. Sufficient number of experimental units was prepared to allow for three replicates per treatment.
2.2. Gas Chromatography-Mass Spectrometry
CO2 evolution was measured once every 24 hours during the first 12 days and thereafter at three days interval. Gas samples (3 ml) were obtained using a 5-ml plastic syringe (Nipro, Japan) fitted with 0.70 × 38.00 mm needle (Nipro, Japan). These were injected in transparent 3-ml capacity pre-evacuated glass vials fitted with a rubber septum. From there, 0.3 milliliter gas sample was injected into a GCMS2010 chromatograph (Shimadzu Corporation, Japan) coupled to a GCMS 2010Plus gas chromatograph mass spectrometer (Shimadzu Corporation, Japan) to distinguish 12CO2 and 13CO2 evolution. Priming effect (PE, %) was calculated as:
PE = 100[(12CO2 – Climed – 12CO2 – Cnon-limed)/12CO2 – Cnon-limed].
2.3. Soil Microbial Biomass Carbon
Before and after incubation, soil microbial biomass carbon (SMBC) was measured using the chloroform-fumigation method [13] to determine the effect of lime to microbial growth. The organic carbon in the extracts was measured using a TOC-VCSN organic carbon analyzer (Shimadzu Corporation, Japan). SMBC was calculated using the formula [14]:
SMBC(mg·kg–1) = 0.45[TOCfumigated – TOCnon-fumigated].
3. Results and Discussion
3.1. Lime-C (13CO2-C) in Evolved CO2
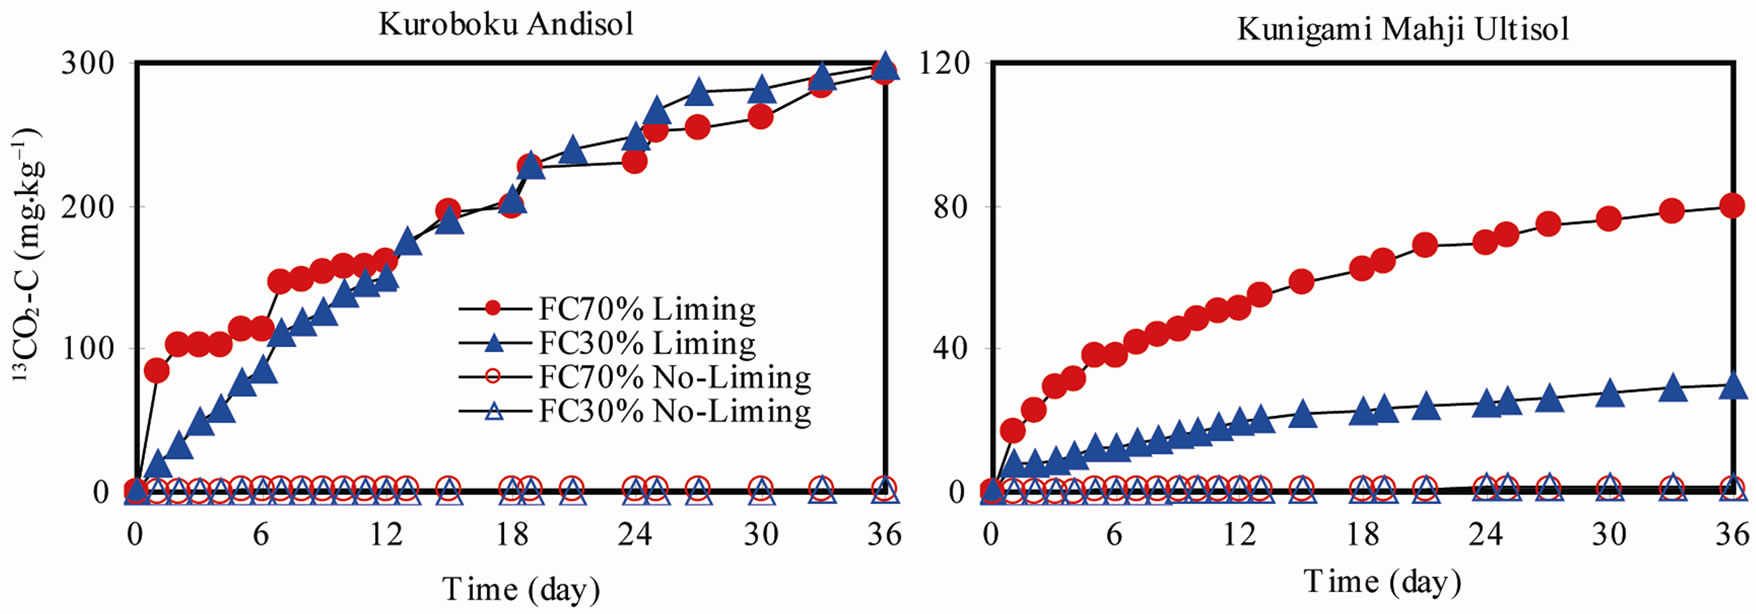
Lime solubilization was highly dependent on the availability of sufficient soil moisture which influenced limeCO2 evolution (Figure 1). In Kuroboku Andisol at FC70, 13CO2-C evolution was dramatic in the first 24 hours after lime application, where 83. 93 mg·kg–1 has evolved. Cumulative 13CO2-C evolution after 36 days was 292.87 mg·kg–1, which was 22.8% of applied Ca13CO3-C. At FC30, the slope of increase of cumulative 13CO2-C was almost uniform during the first 12 days after lime application. Cumulative 13CO2-C was 297.28 mg·kg–1, which corresponded to 23.1% of the Ca13CO3-C. The wide difference in 13CO2-C evolution between FC70 and FC30 was only highly evident during the early stage of incubation. At latter stage (starting at 12 days), the difference in 13CO2-C between FC70 and FC30 was small. At this stage, soil moisture would have been similar, explaining the nearly equivalent amounts of solubilized Ca13CO3 and evolved 13CO2-C. This trend was also observed in Kunigami Mahji Ultisol, where abrupt lime solubilization also occurred within 24 hours. Cumulative 13CO2-C evolution was 79.44 mg·kg–1, which was 14.1% of applied Ca13CO3-C at FC70. At FC30, the slope was almost uniform starting from 48 hours (2 days) after liming. Cumulative 13CO2-C evolution was 29.93 mg·kg–1, which corresponded to 5.3% of applied Ca13CO3-C. Our data showed that when the soil tends to be dry, the applied

Table 1. Some physico-chemical properties of Kuroboku Andisol and Kunigami Mahji Ultisol.
 (a) (b)
Figure 1. 13CO2-C evolution in (a) Kuroboku Andisol and (b) Kunigami Mahji Ultisol after lime (Ca13CO3; 99% 13C) application.
lime may not be solubilized at once. After 36 days, less than 25% of applied Ca13CO3-C evolved as CO2 in all limed soils, indicating that most of the lime was retained in soil. However, lime-CO2 was 74.37% - 79.32%, and 62.32% - 70.4% of CO2-C evolutions from Kuroboku Andisol, and Kunigami Mahji Ultisol, respectively. This showed that most of the CO2 evolution in limed soils originated from lime. Biasi et al. [15], found that “more than 50%” of CO2 release was attributable to lime-carbonates in a similar short-term incubation study.
3.2. 12C Turnover and Soil Microbial Biomass Carbon
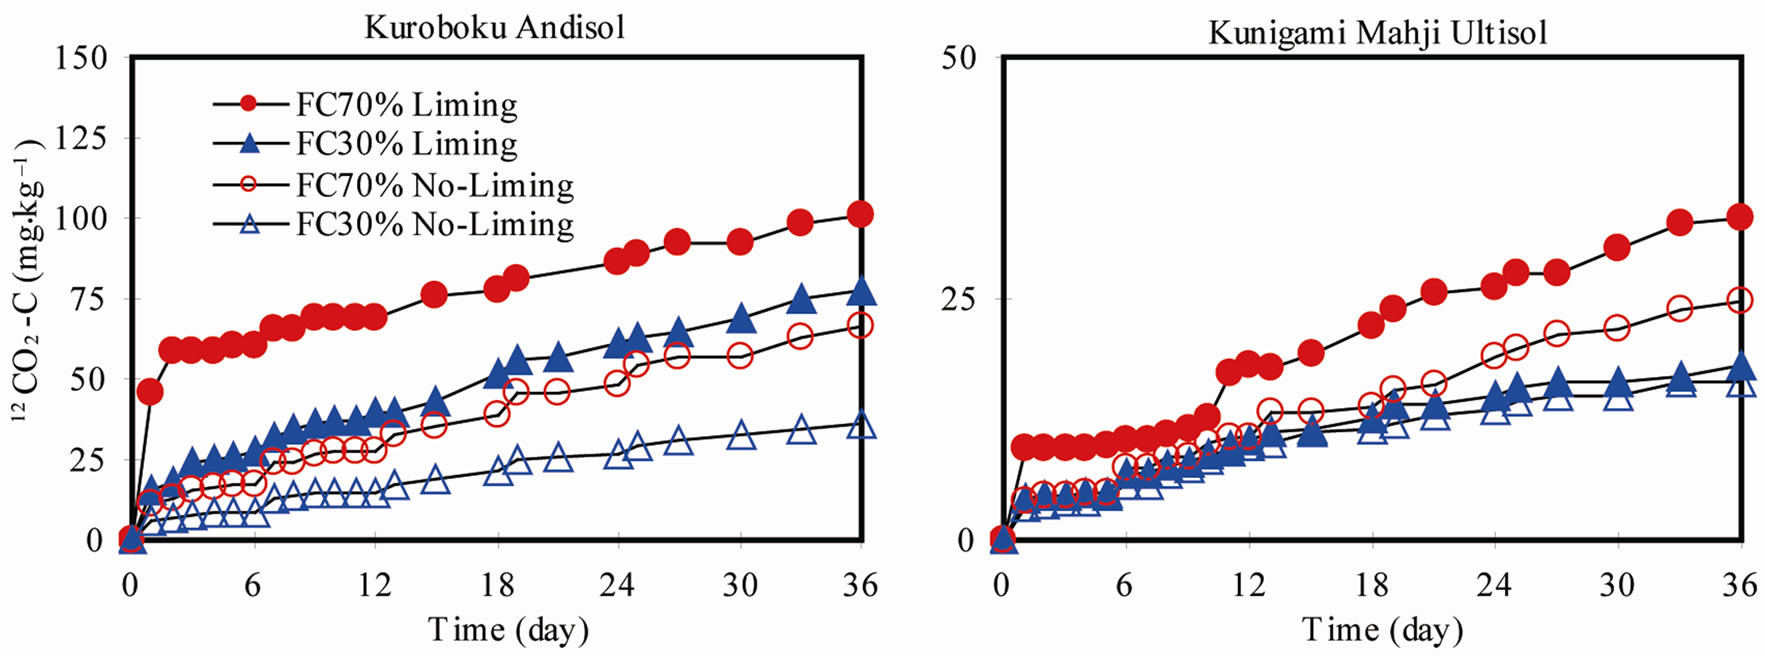
In our experiment, evolved 12CO2-C entirely originated from SOC turnover, since there was no source of 12C other than the SOC. Cumulative 12CO2-C was consistently higher in limed treatments of both soils (Figure 2). In Kuroboku Andisol, cumulative 12CO2-C at FC70, 36 days after liming was 100.91, compared to 66.4 mg·kg–1 in the non-limed treatment. At FC30, cumulative 12CO2- C was 77.51 and 36.06 mg·kg–1 in the limed and non- limed treatments, respectively. In Kunigami Mahji Ultisol, cumulative 12CO2-C was 33.4 in the limed treatment and 24.63 mg·kg–1 in the non-limed at FC70. At FC30, limed and non-limed soils had cumulative 12CO2-C of 18.1 and 16.43 mg·kg–1, respectively. The higher emission in Kuroboku Andisol than in Kunigami Mahji Ultisol can be explained by the difference in their carbon contents (Table 1). The rate of SOC loss is higher in soils with high initial SOC levels than those with low initial levels [16]. Our data confirmed that there was increase in SOC turnover when lime is added to acid soils. This is priming effect of lime application. Priming effects are strong short-term changes in the turnover of soil organic matter caused by comparatively moderate treatments of the soil [17].
To determine whether the increases in 12CO2-C evolution in the limed soils were a result of the flush in micro-
 (a) (b)
Figure 2. 12CO2-C evolution in (a) Kuroboku Andisol and (b) Kunigami Mahji Ultisol after lime (Ca13CO3; 99% 13C) application.
bial population, we compared SMBC in limed and nonlimed soils at the end of incubation. SMBC is a measurable fraction of labile SOC, having turnover times of days to months [18]. It is generally accepted that lime application to soil causes a change in microbial biomass, and microbial dynamics and diversity [19,20]. Some workers reported 20-fold increase in bacterial population in 32 days [21] and by about 12% increase in SMBC [22].
SMBC was suppressed in all limed treatments (Figure 3), contrary to previous findings [e.g. 23]. This confirmed the suppressive effect of liming on microbial growth. Bååth et al. [24] also found a strong decrease in the number of fungi and bacteria after the use of lime in a spruce forest, despite an increase in pH. At higher soil pH, fungi cannot function optimally and as the acidic habitat changes, their role is taken over by different microorganisms, possibly prokaryotes [20]. New populations could have been activated with the rise in pH. After liming, the increase in pH allowed a wide range of prokaryotes to develop. This consequently limited thespectrum of fungal species and resulted to the decrease in SMBC in our experiment. The rise in soil pH may have allowed microbial communities able to use SOC. Fontaine et al. [25] proposed a similar mechanism involving organic matter. Therefore, the extra 12CO2-C in limed treatments cannot be explained by increase in SMBC, since liming significantly suppressed the microbial population in our experiment. According to the theory of stressed ecosystems [26], the rise in CO2 was a result of increased respiration of the stressed microbial community due to liming.
3.3. Priming Effect of Lime Application
Extra 12CO2-C evolution from Kuroboku Andisol was 34.51 and 41.45 mg·kg–1 in the FC70 and F30 treatments,
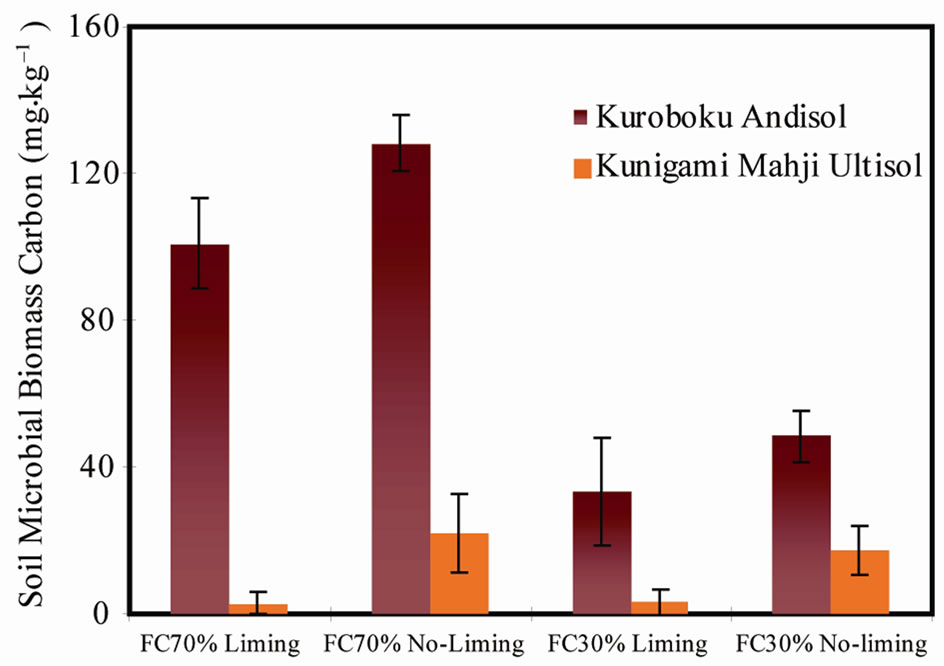
Figure 3. Change in soil microbial biomass carbon (SMBC) after 36 days.
respectively (Figure 4). In Kunigami Mahji Ultisol, lime-induced extra 12CO2-C evolution was 8.77 (FC70) and 1.66 (FC30) mg·kg–1. Calculated PE for Kuroboku Andisol was 51.97% - 114.95%, while 10.13% - 35.61% for Kunigami Mahji Ultisol. These corresponded to 0.03% - 0.04% and 0.07% - 0.35% of SOC, respectively. Priming effect of this magnitude can significantly contribute to atmospheric CO2 concentrations considering present global area of acid soils that periodically receive lime. Small SOC turnover could significantly alter CO2 concentration in the atmosphere [27].
For example, in the US in 2001, an estimated 4.4 - 6.6 million tons CO2 was produced from the total lime applications, equivalent to 22% of applied lime [7]. In Brazil, average lime-derived CO2 emission during 1990- 2000 was 7.2 million tons·y–1 [28] which was almost 1% of the total greenhouse gas emissions of Brazil in 1994 [29]. Reports of agronomically significant increases in mineralization after liming [4,23] did not identify which specific SOC pool was the source of extra CO2 evolution. Here we have confirmed that the extra 12CO2-C evolution in our limed treatments is real priming effect [17]. This originated from a stable SOC pool, and not from the labile SOC, as evidenced by the decrease in SMBC (Figure 3). Dumale et al. [12] put forward earlier observations after finding significant decline in mineral-associated organic carbon, a stable SOC fraction, after fresh organic matter is added to the soil.
4. Conclusions
The magnitude of lime-CO2 during liming of acid soils could significantly impact global CO2 emissions from agricultural ecosystems considering present global volume of lime utilization and continued increase in area of
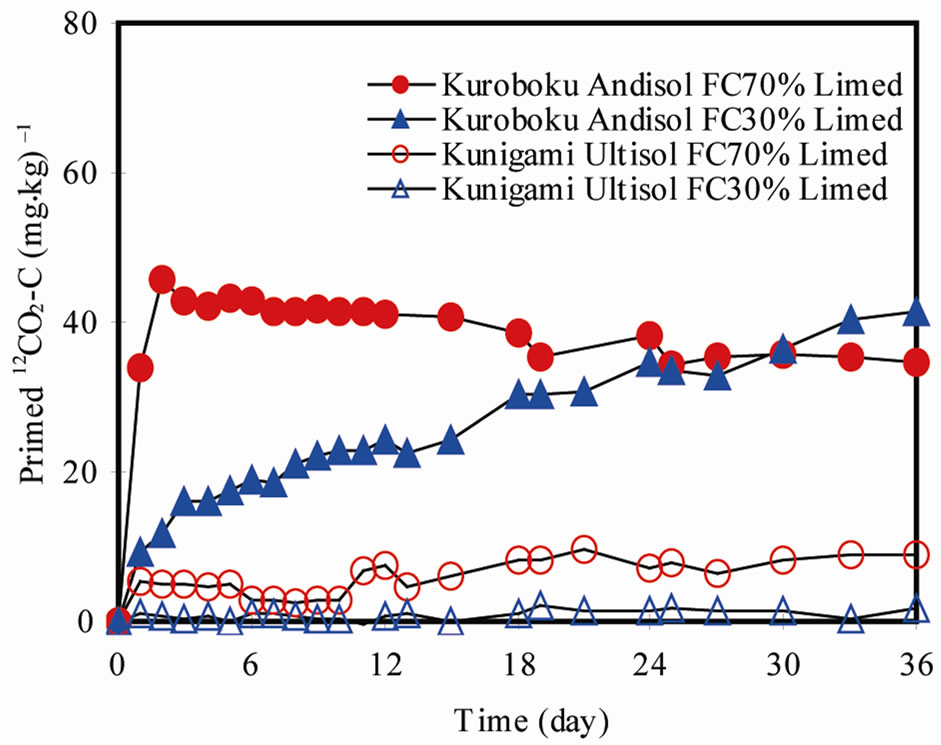
Figure 4. Primed 12CO2-C in limed Kuroboku Andisol and Kunigami Mahji Ultisol.
world’s acid soils. Further, brief and small SOC turnover (priming effect) from limed acid soils can also influence global atmospheric CO2 and could alter carbon storage capacities of these soils. To this end, data on SOC turnover and the extent of lime-contributed CO2 emission in the world’s major acid soils are needed. More research must be done in this area. We need to incorporate the effect of lime utilization in our present soil organic matter models and CO2 cycling simulation studies in agricultural ecosystems.
5. Acknowledgements
The authors thank Mr. Hiromi Imoto for his assistance and expertise in the instrumentations, and to all members of the Laboratory of Soil Physics and Soil Hydrology, Department of Biological and Environmental Engineering of the University of Tokyo for their assistance in soil sampling.
REFERENCES
- J. Fisher, A. Diggle and B. Bowden, “Quantifying the Acid Balance for Broad-Acre Agricultural Systems,” A. D. Robson, Handbook of Soil Acidity, CRC Press, Boca Raton, Florida, 2003, pp. 117-133.
- K. R. Helyar and W. M. Porter, “Soil Acidification, Its Measurement and the Processes Involved,” A. D. Robson, Soil Acidity and Plant Growth, Elsevier, New York, 1989, pp. 61-101.
- G. P. Robertson, E. A. Paul and R. R. Harwood, “GreenHouse Gases in Intensive Agriculture: Contributions of Individual Gases to the Radiative Forcing of the Atmosphere,” Science, Vol. 289, No. 5486, 2001, pp. 1922-1925. doi:10.1126/science.289.5486.1922
- J. A. Baldock, M. Aoyama, J. M. Oades, C. Susanto and D. Grant, “Structural Amelioration of a South Australian Red-Brown Earth Using Calcium and Organic Amendments,” Australian Journal of Soil Research, Vol. 32, No. 3, 1994, pp. 571-594. doi:10.1071/SR9940571
- IPCC, “IPCC Guidelines for National Greenhouse Gas Inventories: Agriculture, Forestry and other Land Use,” Vol. 4, IPCC/OECD/IEA, Japan, 2006.
- S. K. Hamilton, A. L. Kurzman, C. Arango, L. Jin and G. P. Robertson, “Evidence for Carbon Sequestration by Agricultural Liming,” Global Biogeochemical Cycles, Vol. 21, 2007, GB2021. doi:10.1029/2006GB002738
- T. O. West and A. C. McBride, “The Contribution of Agricultural Lime to Carbon Dioxide Emissions in the United States: Dissolution, Transport, and Net Emissions,” Agricultural Ecosystems and Environment, Vol. 108, No. 2, 2005, pp. 145-154. doi:10.1016/j.agee.2005.01.002
- W. Stumm and J. Morgan, “Aquatic Chemistry: Chemical Equilibria and Rates in Natural Waters,” 3rd Edition, John Wiley & Sons Ltd., Hoboken, New Jersey, 1996.
- L. N. Plummer, D. L. Parkhurst and T. M. Wigley, “Critical Review of the Kinetics of Calcite Dissolution and Precipitation,” C. Daniel, R. L. Melchior, et al. (eds.), Chemical Modeling of Aqueous Systems, American Chemical Society, Washington, D.C., 1979, pp. 537-573.
- P. J. Martikainen, “Microbial Processes in Boreal Forest Soils as Affected by Forest Management Practices and Atmospheric Stress,” In: G. Stotzky and J. M. Bollag, Eds., Soil Biochemistry, Marcel and Dekker, Inc., New York, 1996, pp. 195-232.
- A. Chiba and H. Shinke, “Estimation of Lime Requirement of Soil with Calcium Carbonate and Aeration Method,” Japanese Journal of Soil Science and Plant Nutrition, Vol. 48, No. 7-8, 1997, pp. 237-242.
- W. A. Dumale Jr., T. Miyazaki, T. Nishimura and K. Seki, “CO2 Evolution and Short-Term Carbon Turnover in Stable Soil Organic Carbon from Soils Applied with Fresh Organic Matter,” Geophysical Research Letters, Vol. 36, 2009, p. 6. doi:10.1029/2008GL036436
- E. D. Vance, P. C. Brookes and D. S. Jenkinson, “An Extraction Method for Measuring Soil Microbial Biomass C,” Soil Biology & Biochemistry, Vol. 19, No. 6, 1987, pp. 703-707. doi:10.1016/0038-0717(87)90052-6
- J. Wu, R. G. Joergensen, B. Pommerening, R. Chaussod and P. C. Brookes, “Measurement of Soil Microbial BioMass C by Fumigation-Extraction—An Automated Procedure,” Soil Biology & Biochemistry, Vol. 22, No. 8, 1990, pp. 1167-1169. doi:10.1016/0038-0717(90)90046-3
- C. Biasi, S. E. Lind, N. M. Pekkarinen, J. T. Huttunen, N. J. Shurpali, N. P. Hyvönen, M. E. Repo and P. J. Martikainen, “Direct Experimental Evidence for the Contribution of Lime to CO2 Release from Managed Peat Soil,” Soil Biology & Biochemistry, Vol. 40, No. 10, 2008, pp. 2660-2669. doi:10.1016/j.soilbio.2008.07.011
- L. K. Mann, “Changes in Soil Carbon Storage after Cultivation,” Soil Science, Vol. 142, 1986, pp. 279-288. doi:10.1097/00010694-198611000-00006
- Y. Kuzyakov, J. K. Friedel and K. Stahr, “Review of Mechanisms and Quantification of Priming Effects,” Soil Biology & Biochemistry, Vol. 32, No. 11-12, 2000, pp. 1485-1498. doi:10.1016/S0038-0717(00)00084-5
- L. A. Sherrod, G. A. Peterson, D. G. Westfall and L. R. Ahuja, “Soil Organic Carbon after 12 Years in No-Till Dryland Agroecosystems,” Soil Science Society of America Journal, Vol. 69, No. 5, 2005, pp. 1600-1608. doi:10.2136/sssaj2003.0266
- V. Acosta-Martinez and M. A. Tabatabai, “Enzyme Activities in a Limed Agricultural Soil,” Biology and Fertility of Soils, Vol. 31, No. 1, 2000, pp. 85-91. doi:10.1007/s003740050628