Theoretical Economics Letters
Vol.4 No.1(2014), Article ID:42795,8 pages DOI:10.4236/tel.2014.41005
Do Clusters Influence Productivity in China’s Software Industry?
Accenture Institute for High Performance, London, UK
Email: mark.purdy@accenture.com
Copyright © 2014 Mark J. Purdy, Xiao Chang. This is an open access article distributed under the Creative Commons Attribution License, which permits unrestricted use, distribution, and reproduction in any medium, provided the original work is properly cited. In accordance of the Creative Commons Attribution License all Copyrights © 2014 are reserved for SCIRP and the owner of the intellectual property Mark J. Purdy, Xiao Chang. All Copyright © 2014 are guarded by law and by SCIRP as a guardian.
Received November 30, 2013; revised December 30, 2013; accepted January 6, 2014
KEYWORDS
Firm Clusters; Educational Clusters; Productivity; Research and Development; Software Industry
ABSTRACT
Based on data from 2007 to 2011 across 29 provinces in China, this paper employs a panel-based econometric model to investigate the impact of clusters (of firms and educational institutions) and R & D investment in driving productivity in China’s software industry. In respect of clusters, our results show that a one percent increase in the density of firm clusters leads to a 0.10 percent increase in productivity; for clusters of educational institutions, a significantly positive impact on productivity in coastal regions has been identified. In terms of R & D investment, a one percent increase in R & D expenditure per R & D worker leads to a 0.22 percent increase in productivity, although the effect is significantly reduced in coastal region. For policymakers, the results of this study shed light on the effectiveness of different levers in narrowing regional productivity gaps. It can also help business leaders make better decisions regarding their innovation activities.
1. Introduction
For some years, debate has raged in the economic geography and regional policy literature around the role of industry clusters in advancing key economic goals related to innovation, productivity, employment and GDP growth. The promotion of industry clusters has become a part of the industrial-policy arsenal for policymakers in several advanced economies, notably the European Union. For emerging economies, clusters can be appealing because of their potential role in helping economies move up the value chain while also narrowing significant regional economic disparities in GDP and employment.
With the notable exceptions of Silicon Valley and some other well-known clusters, however, the empirical evidence relating to the economic impact of clusters is relatively sparse. Little distinction is made between different types of clusters, for example, pure industry clusters as opposed to those centered on knowledge networks. Moreover, there is a scant evidence relating to the impact of clusters compared with other instruments for promoting regional productivity and innovation such as investment in research and development (R & D).
In this paper, we set out to explore the impact of clusters on labor productivity. We focus on productivity because it is an important variable in advancing GDP growth and in raising living standards; it is also critical to addressing significant regional economic disparities in China, particularly between coastal and inland regions.
We examine the productivity effects of clusters in a specific industry vital to China’s future economic growth: the software industry. This is a key sector underpinning the hard-won economic success the country currently enjoys, enabling businesses to innovate more readily and increase their competitiveness in world markets. Defined as the business of developing and publishing software and related services, the sector plays a crucial role in China’s strategy to move up the value chain.
Given its central role in powering China’s future, the industry is growing rapidly. It reached 2.5 trillion RMB last year, with year-on-year growth of 28.5%, according to the Ministry of Industry and Information Technology of China [1]. Moreover, software is one of the key fields that the Chinese government is promoting in the 12th 5- year plan for economic development [2].
Significant regional disparities exist in the development of China’s software industry. For example, in 2012, software industry revenue in Beijing was 361,209 million RMB, while Ningxia province, which is one of the least developed regions, generated just 635 million RMB [3]. What’s more, software revenues in the country’s 15 major cities contributed fully 55% of the national total [4]. Closing this gap represents a major challenge for China.
Because innovation seemingly breeds innovation, technology firms often appear to thrive around peers. The successes of Silicon Valley in the United States and Zhongguancun Science Park in China are well-known examples of this phenomenon. Recently, China’s Ministry of Science and Technology formulated plans to accelerate the development of national high-tech parks [5]. The obvious question raised by these plans involves the actual impact that clusters have on productivity, especially in the software industry.
To answer it, we employed a panel-based econometric approach to investigate the impact of clusters on productivity relative to the influence of other factors, such as R & D investment. Our findings shed light on the key levers available to policy makers and business strategists looking to stimulate productivity growth.
2. Existing Theory and Evidence on the Productivity Effects of Clusters
The idea of clusters is not new. Marshall (1920) introduced the concept of “agglomeration economies.” He suggested that they could help companies reduce three types of transport costs, namely those associated with moving goods, people and ideas [6]. More recently, Porter (2000) defined clusters as geographic concentrations of interconnected companies. He argued that the prevalence of clusters reveals important insights about the microeconomics of competition and the role of location in competitive advantage [7].
While trends supporting globalization, increased mobility and ubiquitous communication appear to have diminished the traditional role that “economic geography” plays, Porter claimed that the competitive influence of clusters continues to grow. Clusters can enhance productivity in several ways. They provide improved access to specialized inputs and workers and better information, as well as increased “complementarities” (the benefits of offering complementary products and marketing and aligning activities among cluster participates more advantageously). They also typically deliver better access to institutions, public goods and infrastructure; provide greater incentives for achieving high productivity; and increase the ease with which companies can measure the performance of in-house activities. Clusters allow firms to raise their current efficiency levels by getting closer to the “productivity frontier [8]”.
Dayasindhu [2001] noted that “embeddedness” and knowledge transfer are key elements of industry clusters that lead to global competitiveness. In this case, embeddedness means the extent to which industry relationships and the structure of the overall network of social relationships affect economic behavior. Industry clusters can help companies that are moving up the value chain by offering sophisticated services and products no one single organization could have developed alone [9].
Zhou and Xin [2003] revealed that in advanced countries, technology hubs play a crucial role in accumulating and sharing knowledge. In emerging markets, in contrast, clusters appear to improve the learning capacity of local firms due to the presence of other allied enterprises and related research and development facilities. When analyzing the development of Zhongguancun in Beijing, the authors argued that the cluster owes its unique position in China to the concentration of research institutions and universities, the presence of local research facilities, a mobile labor force and a rewarding environment [10].
However, researchers disagree on the extent of the positive impact that clustering has on productivity. One argument holds that two forms of organizational interdependence occur within communities: mutualism and competition. Mutualism exists because multiple technology communities can benefit from their interdependence through knowledge spillover, learning effects and the creation of a technology “commons” of infrastructure, standards and skilled labor. Nevertheless, competition also increases when closely located firms battle for finite resources such as technology entrepreneurs, scientists, engineers, technology project managers and venture capitalists. All of these are in short supply in China. Based on data from China’s national technology development zones from 1988 to 2000, researchers identified an inverted U-shaped relationship between regional community density and growth (measured in terms of sales revenue growth rates) [11].
A contrary view involves Wang and Lin’s [2008] research regarding the geographical distribution of China’s information and communications technology (ICT) industry. The analysis found no significant relationship between clustering (measured in terms of employment location quotient1) and economic performance (labor productivity and capital profitability) [12]. This finding contradicts the expectation that cluster effects lead to high productivity.
The existing research provides some clues as to the relationship between clusters and productivity in China’s technology industry. However, most studies focused on the broader ICT sector while relatively little research concentrated on the software industry. Moreover, much of the research that does exist involves case studies and overlooks important issues such as timeand regionspecific effects.
To gain a clearer picture of the impact clusters have on the productivity of China’s software industry, we developed a research model capable of providing new insights regarding this issue. We used a fixed-effects econometric approach to disentangle the influence of clusters from other factors that could potentially affect productivity performance, such as R & D investment and broader regional characteristics. In addition, our research looked at two types of clusters: company clusters and knowledge clusters that include educational institutions.
3. Model
The model analyzes data from 2007 to 2011 across 29 provinces in mainland China [13] (except Xizang and Qinghai) and fixed two types of effects: time (years) and regions (provinces). This approach controls for the impact from time-specific effects (such as natural disasters and financial crises occasionally occurring in any particular year) and unquantifiable regional factors (such as infrastructure, quality of human capital, policy environment and government efficiency in a particular region). As a result, the model can more easily isolate the specific impact of factors such as industry clustering and R & D investment in driving productivity differences.
3.1. Variables
In constructing the model, we selected the most suitable dependent, independent and dummy variables that would provide the clarity and granularity the study required.
Dependent variable The model uses value-added per employee as the dependent variable to measure labor productivity because it reflects the effectiveness and efficiency of labor in the production and sale of output [14].
Independent variables For independent variables, we defined the drivers of productivity in terms of three categories:
1) Cluster effects.
2) Economic development 3) Research and development (R & D) intensity.
We will examine each independent variable in detail in the following sections.
Dummy variable In addition, the model employs a dummy variable to capture differences in productivity between coastal and non-coastal regions (see Table 1). In China, coastal provinces feature higher levels of development than non-

Table 1. China’s 12 coastal provinces (dummy variables).
coastal provinces in many aspects. In a research paper published in 1997, Belthon M. Fleisher and Jian Chen found that coastal provinces had total factor productivity rates that were roughly twice as large as those in nonoastal areas. They estimated that higher education spending and foreign direct investment helped explain the productivity gap [15]. More recently, a study based on data collected from the first national economic census (2004) covering China’s ICT sector revealed that manufacturing in these industries has a strong tendency to agglomerate in several eastern coastal areas [16].
We tested for interaction effects between the coastal dummy variables and each of the four independent variables. As a result, we can examine whether the independent variables in coastal provinces would have a different impact on productivity compared to their effect in non-coastal provinces.
3.2. Hypotheses
3.2.1. Cluster Effects
Hypothesis 1: Cluster effects have a significantly positive impact on productivity.
To test this idea, we defined two variables to represent two types of cluster effects: density of firms and density of educational institutions. Density of firms is the ratio of the number of software firms in a province to the number of top-tier cities in that province (see Table 2). Similarly, density of educational institutions is the ratio of the number of colleges and universities in a province to the number of top-tier cities in that province.
Rather than using a measure of area such as square kilometers as the denominator, we chose the number of top-tier cities in a province. Our research revealed that in a number of cases, using area as the denominator dilutes the value of density because some provinces have very large rural areas where technology firms rarely locate. In practice, technology firms largely gravitate to top-tier cities.
In the software industry, knowledge spillovers help firms explore growth opportunities beyond the company
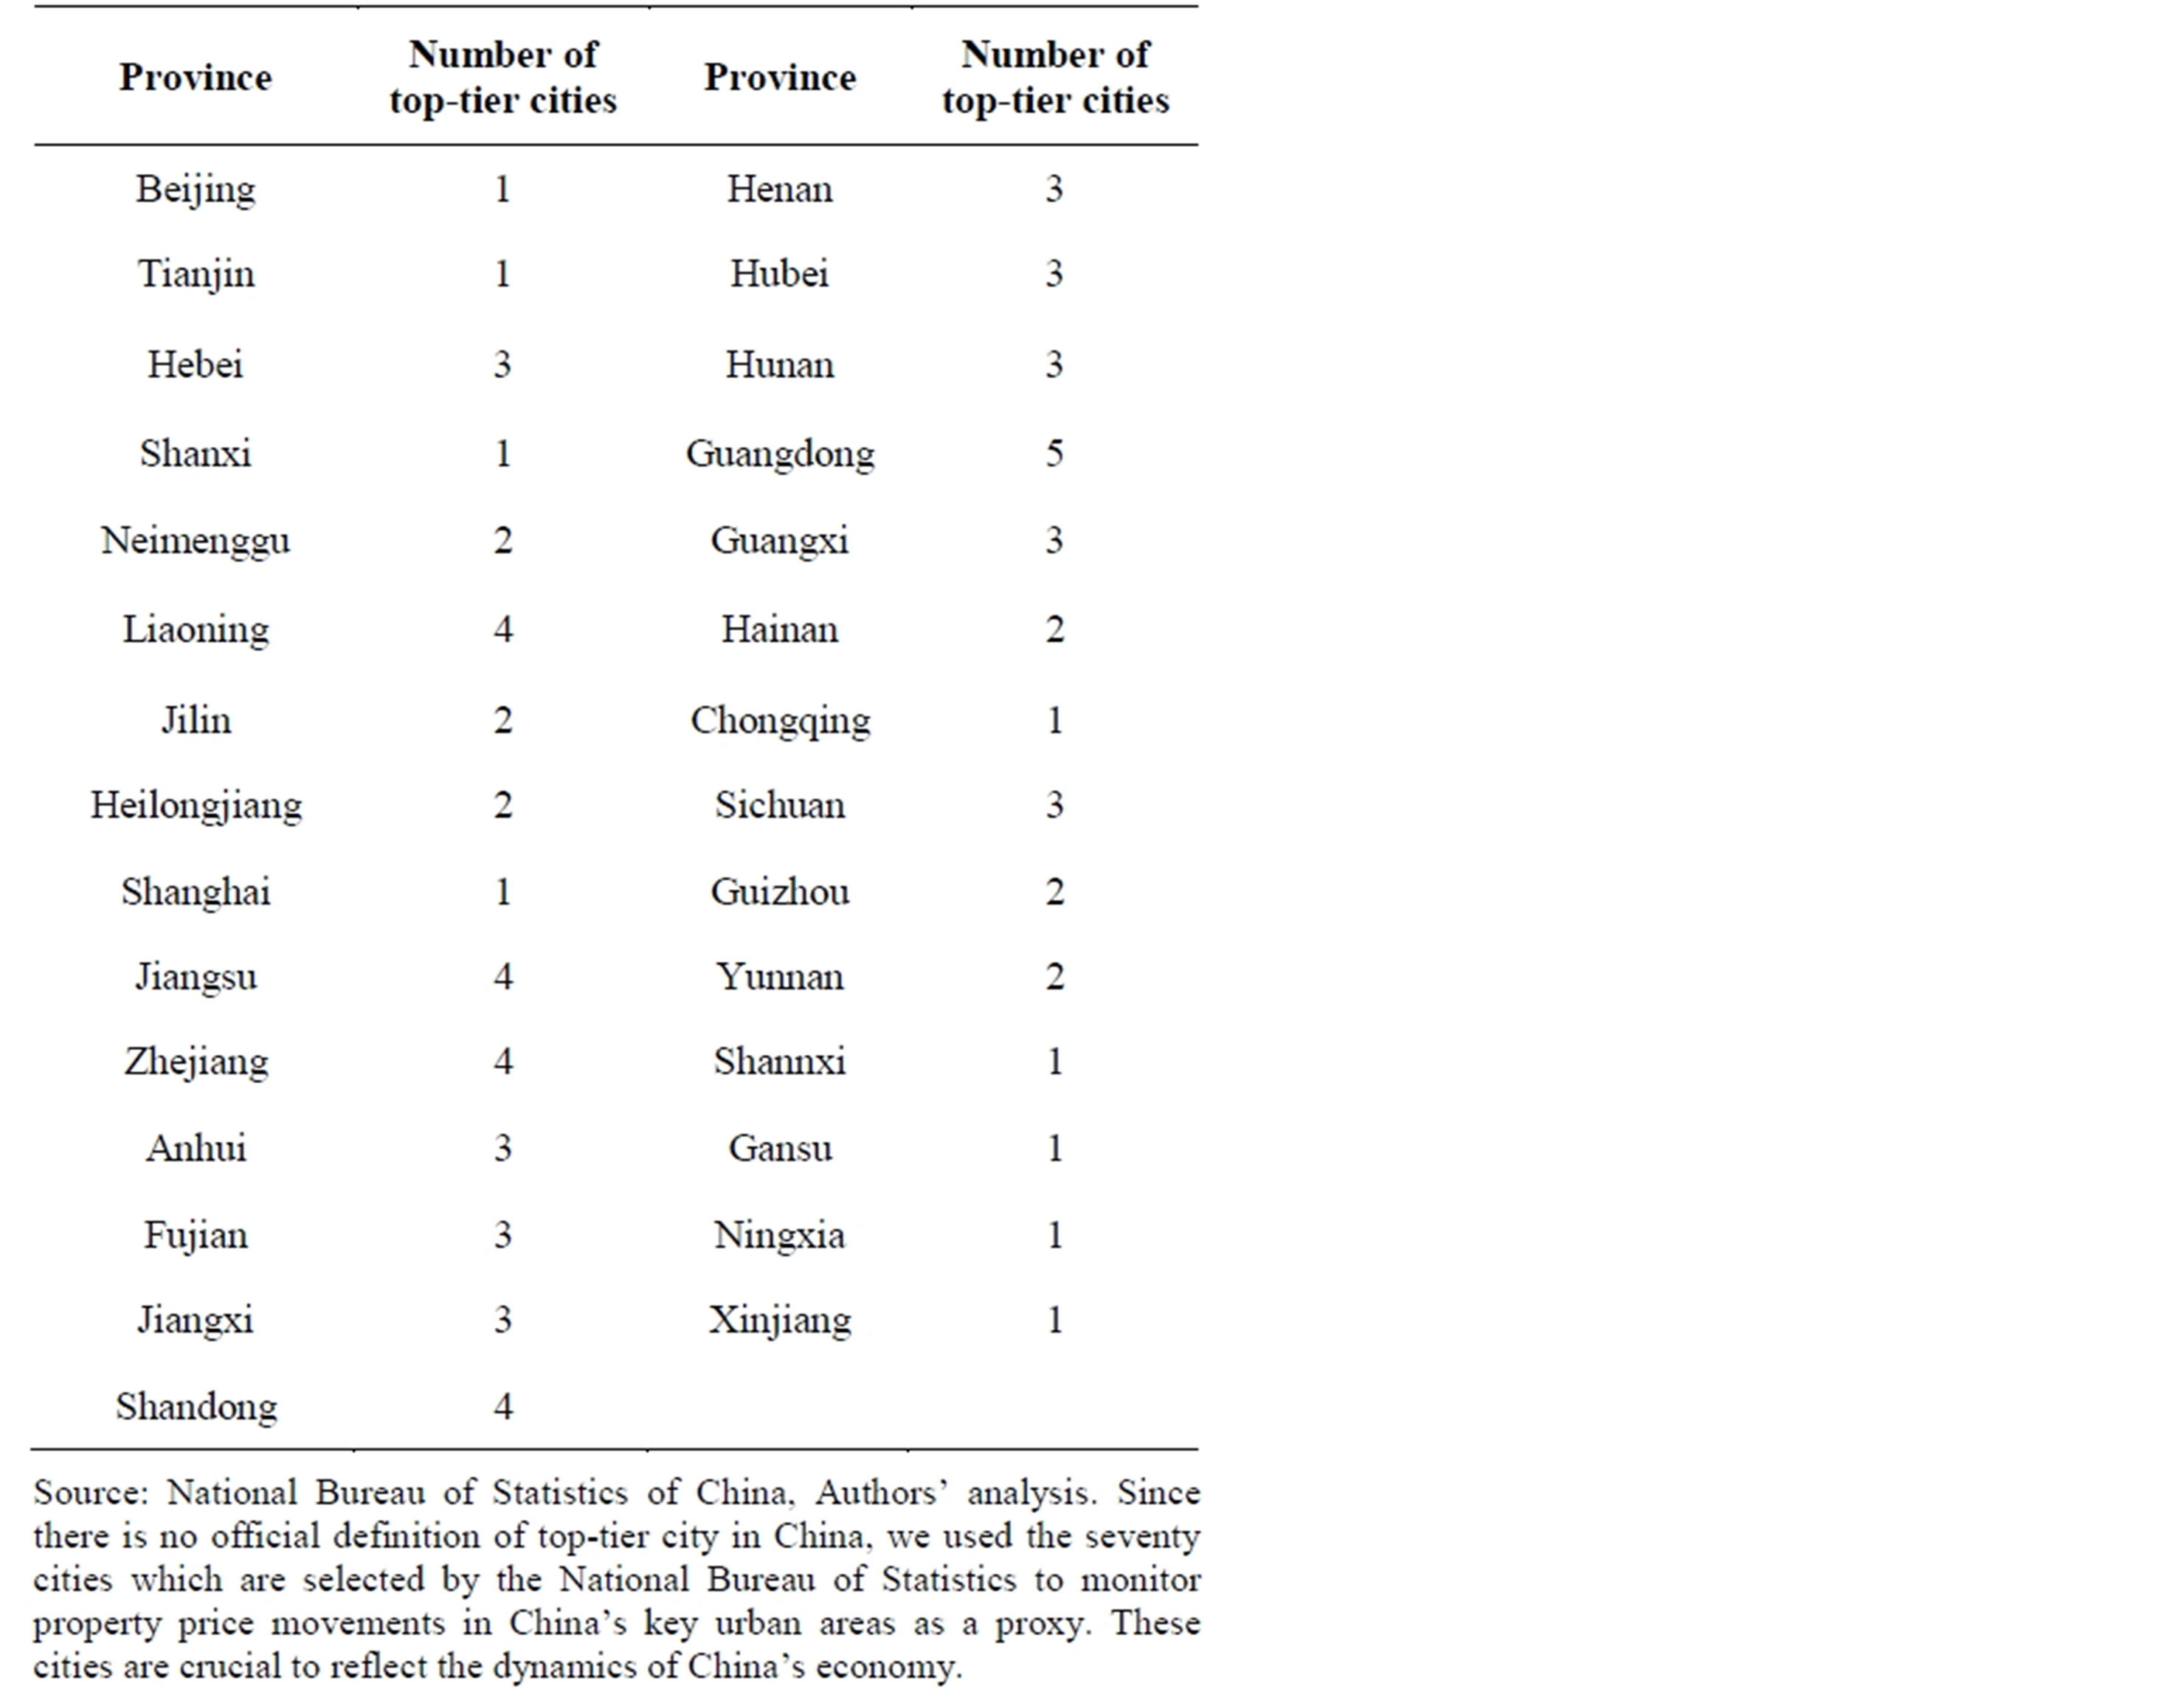
Table 2. Summary of number of top-tier cities in 29 provinces (China).
level. In respect to local governments, they often design policies to provide local players with competitive advantages in terms of capital or access to R & D facilities. For example, Zhongguancun has introduced a series of talent attraction policies to support the development of the technical cluster [17]. Moreover, software companies benefit from the efficiency and ease of hiring highly skilled scientists and engineers from local colleges and universities. Students are encouraged to enroll with colleges and universities located close to firms because doing so gives them better access to job opportunities after graduation. As a result, educational institutions and software firms link inter-penetratively. Therefore, we expect both density of firms and density of educational institutions to have positive impacts on productivity.
3.2.2. Economic Development
Hypothesis 2: GDP per capita has a significantly positive impact on productivity.
Gross domestic product per capita (GDP per capita) is an important macro-factor when it comes to distinguishing relative economic performance across regions. Generally, we would expect productivity levels to drive GDP per capita, not the reverse. However, GDP per capita also reflects other factors (such as the quality of the institutional environment, human capital endowments and the ability to attract skilled migrants) that could in theory influence productivity levels. We thus use GDP per capita as a proxy to test for the presence of these development effects on productivity levels across regions. The Economist magazine compared China’s GDP per capita by province in 2010 and concluded that huge regional gaps existed [18]. Give this economic disparity, it is important to test the degree to which it could influence productivity performance.
3.2.3. Research and Development Intensity
Hypothesis 3: R & D expense per worker has a significantly positive impact on productivity.
We used R & D expense per R & D worker to examine the intensity of R & D input by firms in the software industry. Companies investing in R & D aim to achieve greater efficiency and stimulate output growth. Normally, researchers use the R & D-to-sales ratio to represent the intensity of R & D investment. However, this metric cannot directly determine the level of productivity.
We argue that R & D expense-to-worker ratio is a better indicator. First, it is more focused on the output of product or process innovation—more resources associated with each staffer in the R & D function typically engenders greater opportunities to boost productivity. Second, the greater product or process innovation from the R & D function is highly likely to stimulate productivity growth firm wide. Third, using another metric such as R & D-to-sales ratio would result in “simultaneity” (i.e., one or more of the independent variables is jointly determined with the dependent variable) in our model, causing the dependent variable (value-added per employee) and the independent variable (R & D-to-sales ratio) to influence each other because they both use revenue as a factor.
3.3. Correlation Test
We performed a correlation test on the four independent variables to determine whether multicollinearity (a statistical phenomenon where two or more explanatory variables correlate strongly with each other, which can affect the accuracy of some results) exists in our regression model. The results show that none of the pairs is strongly correlated (no multicollinearity), so the estimated parameters in our model should be reasonably robust. (See Table 3)
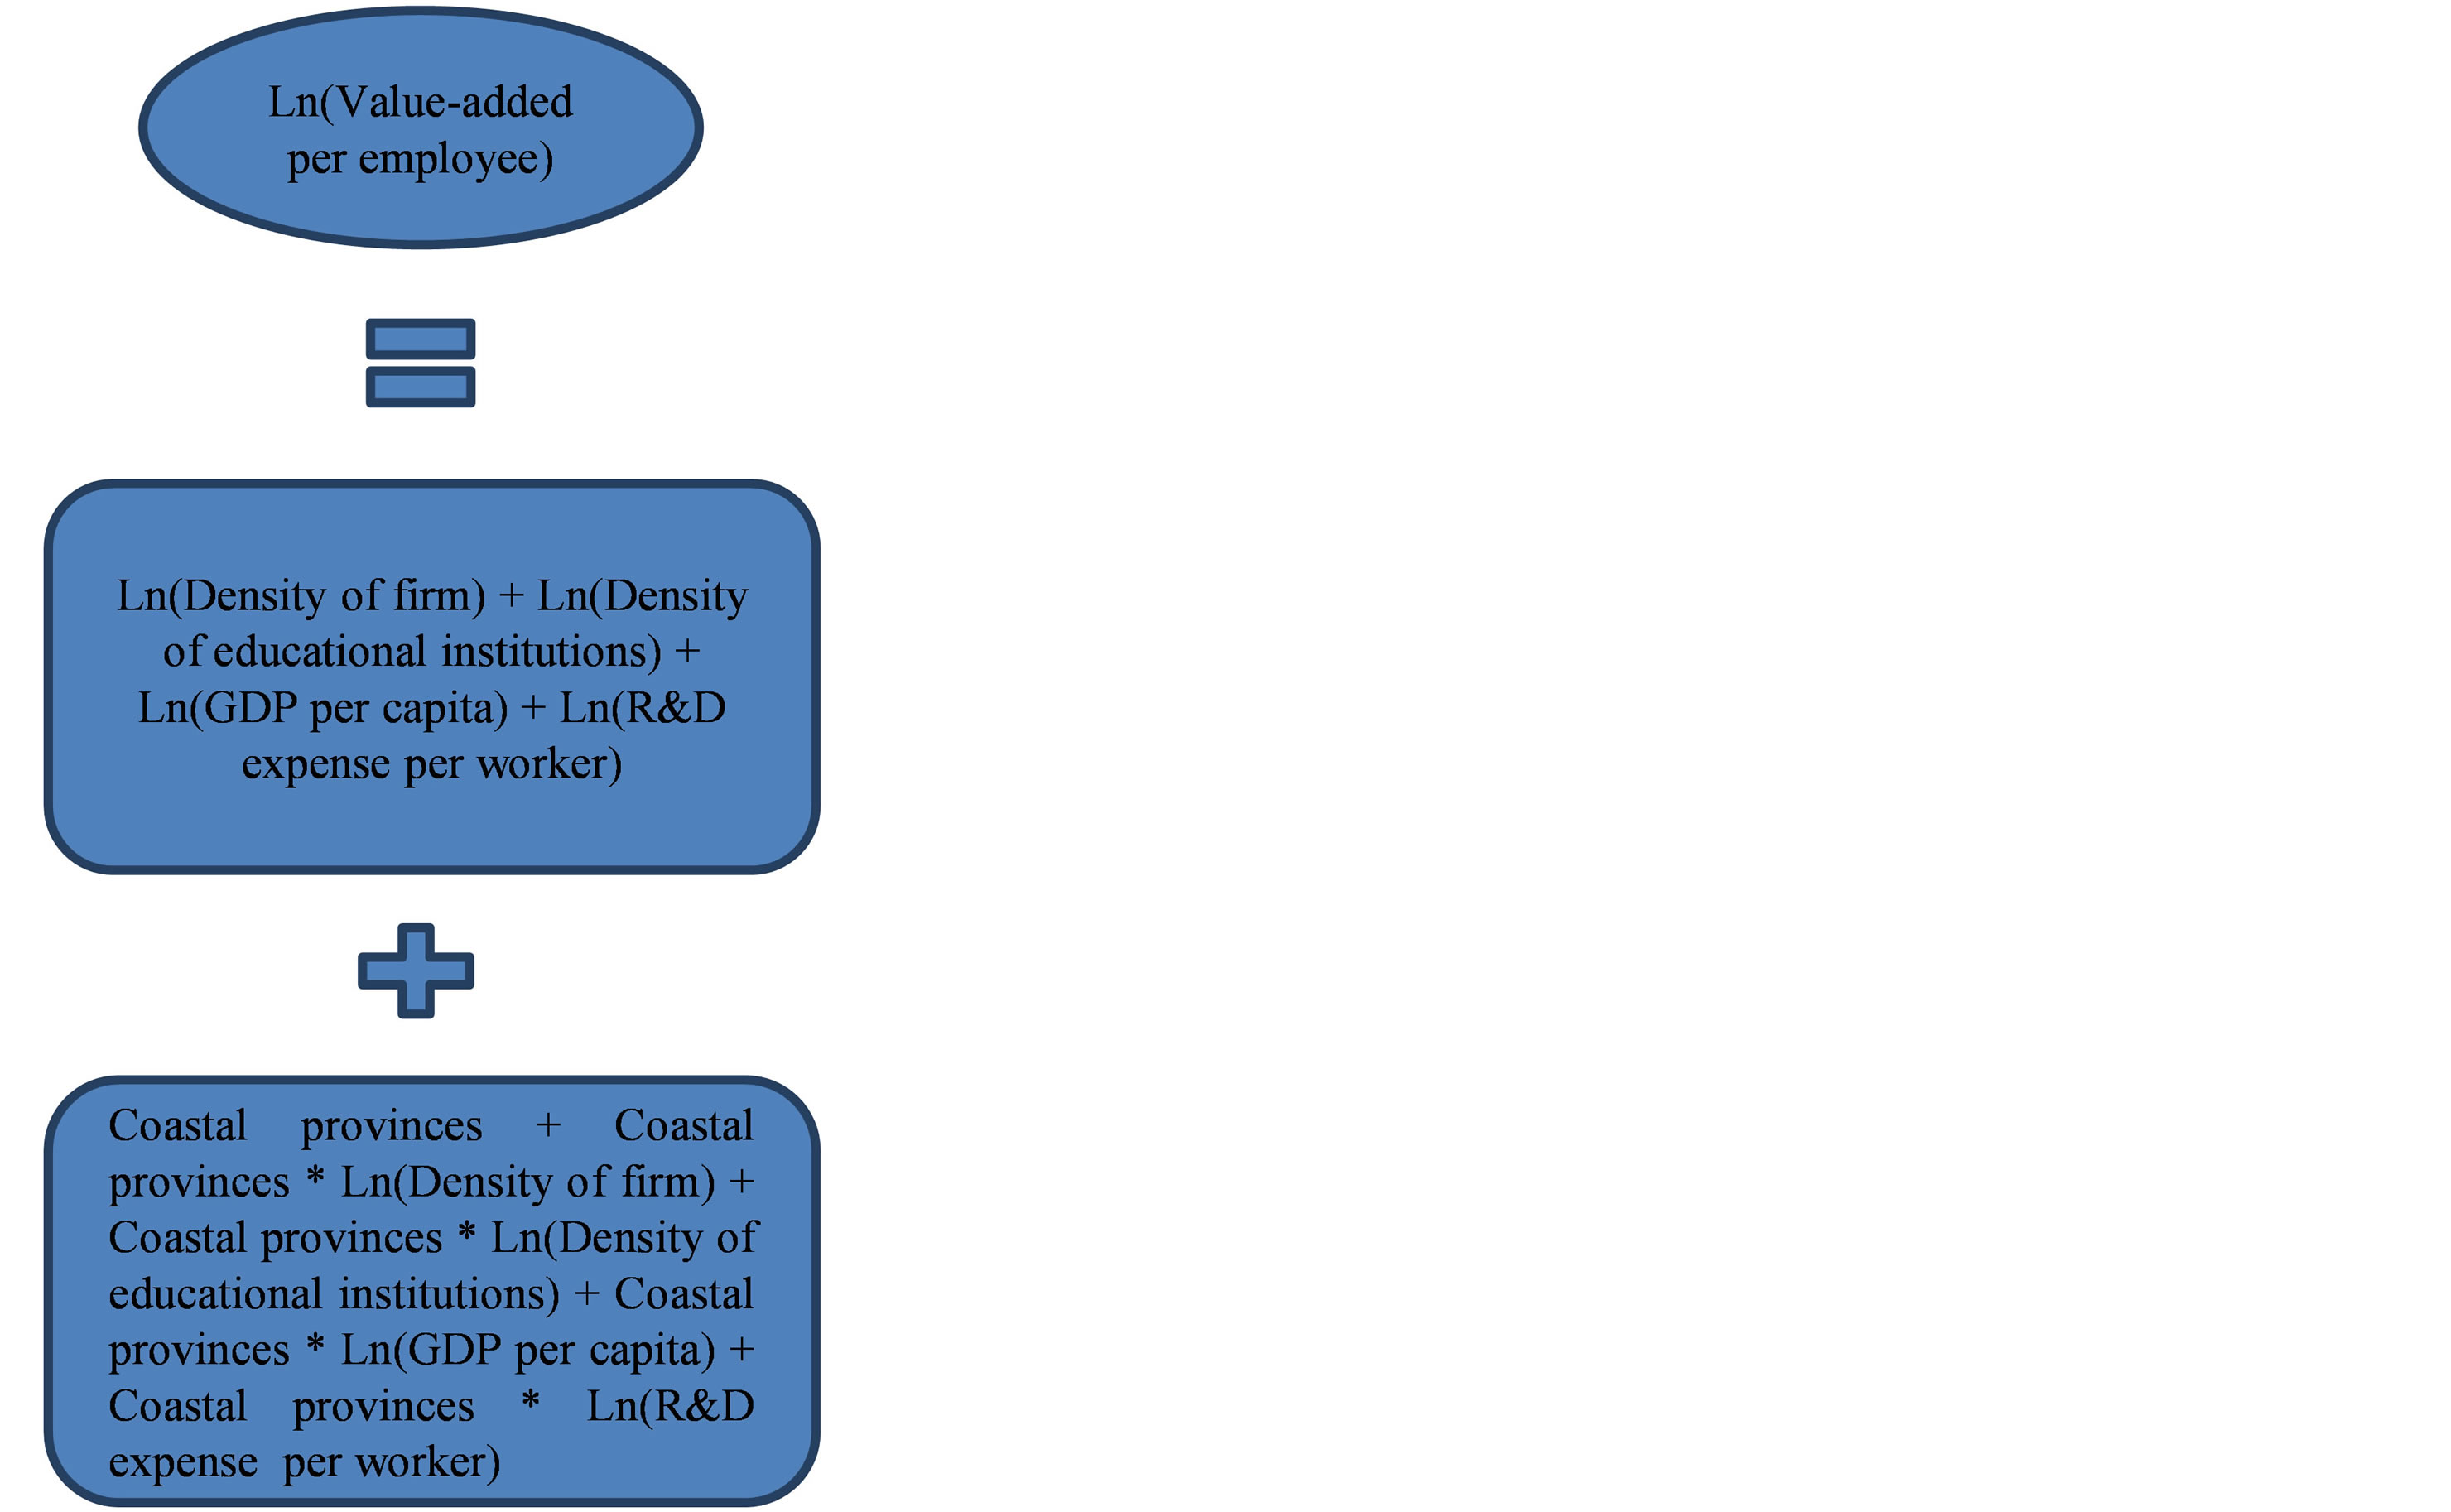
3.4. Model Specification
The model is specified as follows:
4. Model Results
We found that four out of nine independent variables were statistically significant in explaining the variation in productivity. All of these estimated parameters are significant at 1% significance level (see Table 4).
Ln(Value-added per employee) =3.33 + 0.10 × Ln(Density of firm) + 0.22 × Ln(R & D expense per worker) + 0.29 × [Coastal provinces × Ln(Density of educational institutions)] – 0.16 × [Coastal provinces × Ln(R & D expense per worker)]
4.1. Interpreting the Model Results
The estimated model provides an insight into the key determinants of productivity differences in China’s software industry.
Hypothesis 1: Cluster effects have a significantly positive impact on productivity.
4.1.1. Density of Firms
A one percent increase in the density of firms leads to a 0.10 percent increase in productivity. This tells us that the greater the density of software firms in a region, the higher the productivity in that region. The result confirms our expectation of the positive impact on productivity from clusters of firms.
4.1.2. Density of Educational Institutions
In coastal provinces, the density of educational institutions significantly influences firms’ productivity: a one percent increase in the density of educational institutions in coastal provinces leads to a 0.29 percent increase in productivity. However, we did not find such an effect for non-coastal regions. We noticed that the average density of educational institutions in non-coastal provinces is broadly similar to that of coastal provinces (37.53 versus 36.55). Given similar densities, the different impact on productivity may reflect differences in the quality of educational institutions. In China, large numbers of wellknown universities are in coastal provinces, especially for science and engineering disciplines. The proximity to prestigious colleges and universities helps firms reach highly capable workers easier and faster.
wang#title3_4:spHypothesis 2: GDP per capita has a significantly positive impact on productivity.
We hypothesized that GDP per capita was a proxy for economic development and other factors such as institutional quality and human capital endowments and as a result could have a positive impact on productivity growth. However, the coefficient on GDP per capita was not significant (the p-value is 0.55). The effect of GDP per capita on productivity might have been diluted as we fixed the effect of provinces in the model.
Hypothesis 3: R & D expense per worker has a significantly positive impact on productivity.
Across all provinces, a one percent increase in R & D expense per worker leads to a 0.22 percent increase in productivity. The result is consistent with our expectation: the more investment in R & D, the higher productivity in return.
However, in coastal provinces, we noticed a drag effect of the change in R & D inputs relative to the change in productivity. A one percent increase in R&D expense per worker does not lead to a 0.22 percent rise in productivity, but a rather smaller response of 0.06 percent: there is a negative drag effect of 0.16 percent from the interactive term of the coastal dummy with R & D investment. Two things could account for this: first, labor costs and various fixed costs are significantly higher in coastal provinces than in non-coastal provinces, which may offset the rise in productivity from R & D investment. Second, as the level of investment is already reaching full capacity in coastal provinces, there may be diminishing marginal returns to the additional R & D investment.
4.2. Implications
As China seeks to rebalance its economy toward a sustainable economic growth model, the role of domestic demand-led growth is becoming more important. Cheap labor no longer drives economic growth. The International Labour Organization has found that real average wages in China more than tripled over the decade from 2000 to 2010 [19]. Consequently, finding ways to in-
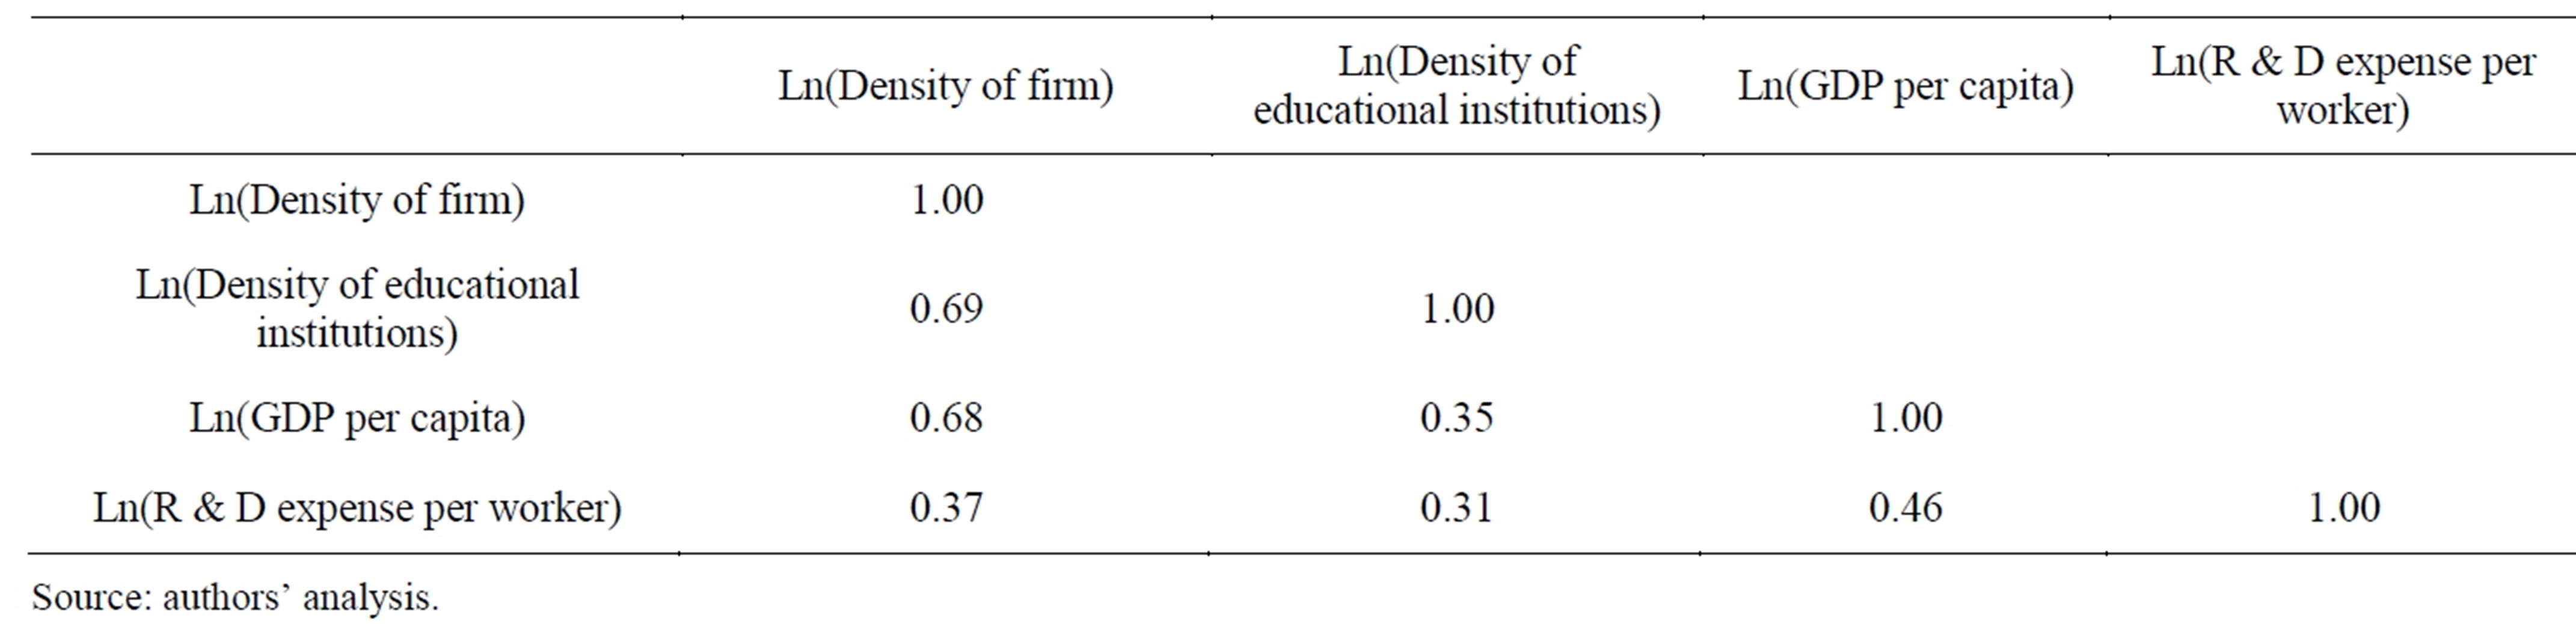
Table 3. Correlation test among independent variables.
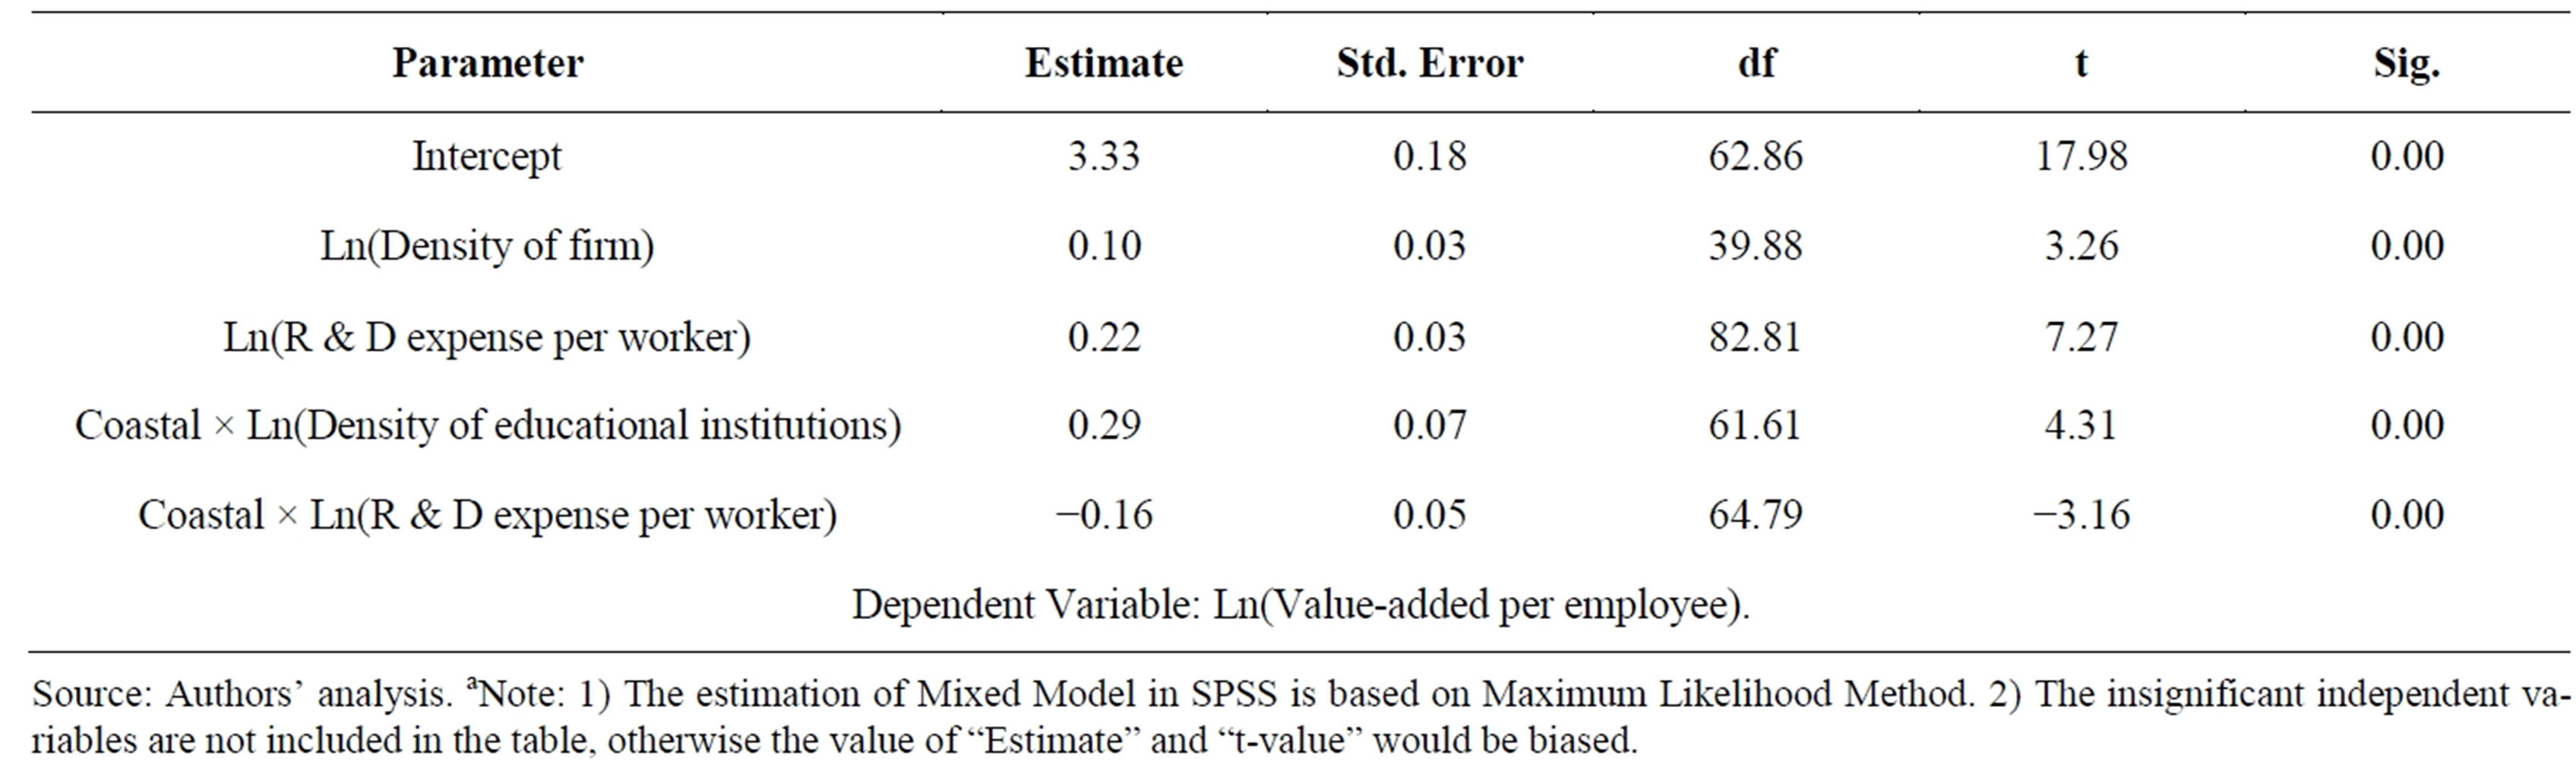
Table 4. Model estimation resultsa.
crease labor productivity has become an important issue for decision-makers in China. In fact, China set a target of a 10 percent increase in overall labor productivity, according to the Industrial Restructuring and Upgrading Plan (2011-2015) [20].
Our research confirms the important role clusters play in driving productivity in China’s software industry. It highlights in particular four practical considerations for policy makers and business leaders.
1) Software firms will benefit by locating in regions with a greater density of other firms in the same industry Our research has shown that the clustering of similar firms in the software industry has a positive impact on productivity. Players benefit from the knowledge spillover and the improved learning capabilities that result from having other companies located nearby. This insight explains in part the phenomenon of China’s highly concentrated software industry.
2) Coastal and non-coastal regions have the same degree of productivity growth potential associated with the cluster effect of firms Observers often claim that coastal regions have greater growth potential in returns per unit of investment compared to non-coastal areas, and as a result, large investments from government and private institutions have flowed into these regions.
This observation is borne out by data on value-added per employee in the software industry. The actual average value-added per employee in coastal regions was 56.31 thousand RMB higher than in non-coastal regions (see Table 5).
However, our model finds no difference between coastal and non-coastal regions in terms of the impact on productivity from investing in clusters of firms. A one percent increase in the density of firms will increase productivity in coastal and non-coastal regions by the same degree. The difference in observed productivity levels actually reflects differences in the average density of firms: the average density of firms in coastal regions is more than four times higher than in non-coastal regions. Thus, to close the gap in productivity, policy makers and business leaders should seek to stimulate the growth of more clusters of firms in non-coastal regions.
3) Decision makers can choose whether to invest in clusters of firms and/or R & D to stimulate productivity growth Clusters and R & D both have roles to play in improving productivity. Decision makers therefore have a choice of whether to invest more in R & D or in clusters of firms. Holding “region” constant, investing in R & D has a bigger impact on productivity than does firm density (0.22 versus 0.10). However, in coastal regions there is a negative drag effect on productivity from the interaction between the coastal region dummy and the R & D variable of 0.16, giving a net elasticity of 0.06 (0.22 - 0.16). As a result, investments in clusters of firms (with
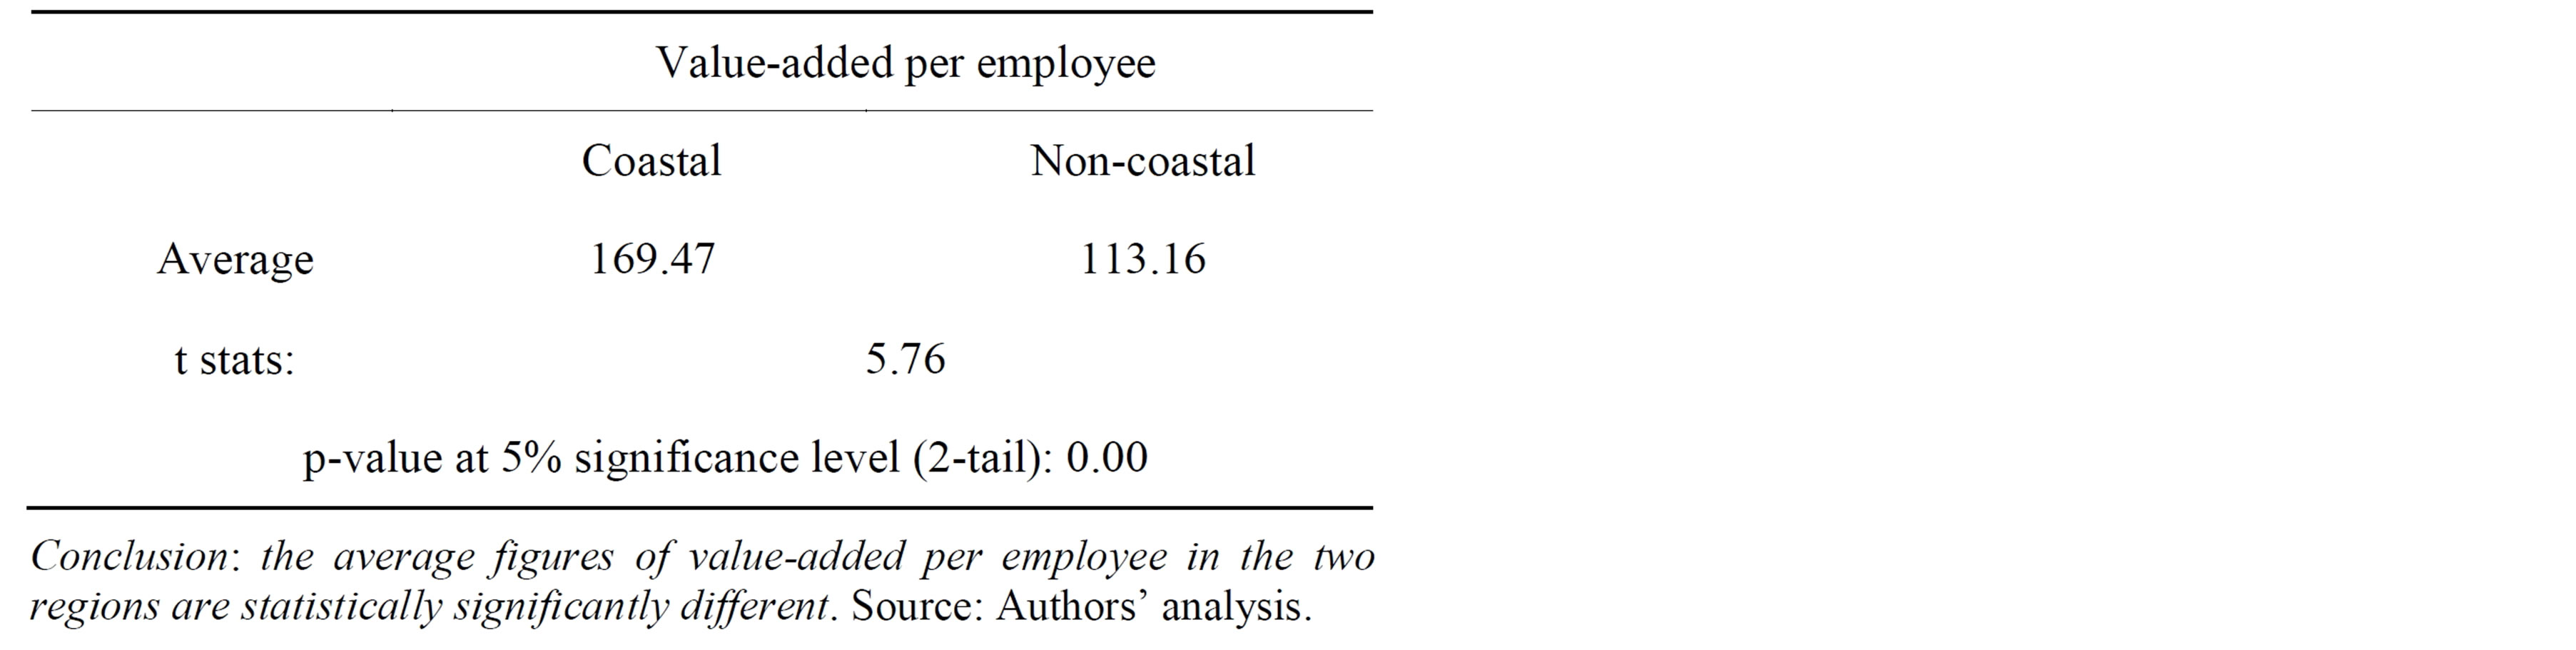
Table 5. T-tests to compare the difference in productivity (2007–2011) (in thousand RMB).
its elasticity of 0.10) may be a safer and higher return strategy for coastal regions. For non-coastal regions, investment in R & D may be a higher return strategy (0.22 versus 0.10) as the negative coastal drag effect does not apply.
4) Educational clusters can play a productivity-enhancing role Our research found that the densities of educational institutions in coastal and non-coastal provinces are not very different. However, in coastal regions, clusters of educational institutions have significantly greater impact on productivity compared to the density of firms or R & D investment (0.29 versus 0.10 and 0.06, respectively). Consequently, investing in education in coastal regions is the most effective way to stimulate productivity growth if the institutions maintain their quality levels overtime. For non-coastal regions, the impact of educational clusters is not statistically significant, although the average density of colleges and universities is slightly higher. This may point to issues surrounding the quality of local educational institutions.
5. Conclusion
Our research represents a first step in understanding the impact of clusters in driving regional differences in productivity growth in one key industry—software—that will play a critical role in driving China’s future economic growth. Researchers can apply the same approach to other industries to test if similar effects hold. A better understanding of cluster effects on productivity can assist China’s economic growth by giving policy makers deeper insights into the effectiveness of different levers in closing regional productivity gaps. It can also help business leaders make better decisions regarding their innovation activities.
REFERENCES
- Ministry of Industry and Information Technology of the People’s Republic of China, “The Operation Summary of the Software Industry,” 2012. http://www.miit.gov.cn/n11293472/n11293832/n11294132/n12858477/15136112.html
- China’s Twelfth Five-Year Plan (2011-2015).
- Ministry of Industry and Information Technology of the People’s Republic of China, “Key Economic Indicators of China Software Industry,” 2012. http://www.miit.gov.cn/n11293472/n11293832/n11294132/n12858477/15136108.html
- Ministry of Industry and Information Technology of the People’s Republic of China, “The Operation Summary of the Software Industry,” 2012. http://www.miit.gov.cn/n11293472/n11293832/n11294132/n12858477/15136112.html
- Department of International Cooperation, Ministry of Science and Technology of P.R. China, “China Science and Technology Newsletter,” No. 7, 2013. http://isd.arizona.edu/castusa/newsletter/2013NO.7_EN.pdf
- G. Ellison, E. L. Glaeser and W. R. Kerr, “What Causes Industry Agglomeration? Evidence from Coagglomeration Patterns,” American Economic Review, Vol. 100, No. 3, 2010, pp. 1195-1213. http://economics.mit.edu/files/7597
- M. E. Porter, “Location, competition, and Economic Development: Local Cluster in a Global Economy,” Economic Development Quarterly, Vol. 14 No. 1, 2000, pp. 15-34. http://edq.sagepub.com/content/14/1/15.short
- M. E. Porter, “Location, Competition, and Economic Development: Local Cluster in a Global Economy,” Economic Development Quarterly, Vol. 14 No. 1, 2000, pp. 15-34. http://www.development.wne.uw.edu.pl/uploads/Courses/ied_porter_2000.pdf
- N. Dayasindhu, “Embeddedness, Knowledge Transfer, Industry Clusters and Global Competitiveness: A Case Study of the Indian Software Industry,” Technovation, Vol. 22, No. 9, 2002, pp. 551-560. http://web1.cenet.org.cn/upfile/7509.pdf
- Y. Zhou and T. Xin, “An Innovative Region in China: Interaction between Multinational Corporations and Local Firms in a High-Tech Cluster in Beijing,” Economic Geography, Vol. 79, No. 2, 2003, pp. 129-152. http://onlinelibrary.wiley.com/doi/10.1111/j.1944-8287.2003.tb00205.x/abstract http://www.jstor.org/stable/pdfplus/30032921.pdf?acceptTC=true&acceptTC=true&jpdConfirm=true
- Y. Zhang, H. Y. Li and C. B. Schoonhoven, “Intercommunity Relationships and Community Growth in China’s High-Technology Industries 1988-2000,” Strategic Management Journal, Vol. 30, No. 2, 2009, pp. 163-183. http://onlinelibrary.wiley.com/doi/10.1002/smj.727/pdf
- C. C. Wang and G. C. S. Lin, “The Growth and Spatial Distribution of China’s ICT Industry: New Geography of Clustering and Innovation,” Issues and Studies, Vol. 44, No. 2, 2008, pp. 145-192. http://140.119.170.21/attachments/journal/add/4/44-2-145-192.pdf
- Data Source, China Electronic Information Industry Statistical Yearbook.
- Spring Singapore, “A Guide to Productivity Measurement.” http://www.spring.gov.sg/resources/documents/guidebook_productivity_measurement.pdf
- B. M. Fleisher and J. Chen, “The Coast-Noncoast Income Gap, Productivity and Regional Economic Policy in China,” Journal of Comparative Economics, Vol. 25, No. 2, 1997, pp. 220-236. http://www.sciencedirect.com/science/article/pii/S0147596797914621 http://www.econ.ohio-state.edu/pdf/coastal.pdf
- C. C. Wang and G. C. S. Lin, “The Growth and Spatial Distribution of China’s ICT Industry: New Geography of Clustering and Innovation,” Issues and Studies, Vol. 44, No. 2, 2008, pp. 145-192. http://140.119.170.21/attachments/journal/add/4/44-2-145-192.pdf
- Sohu News, “4 to 6 Enterprises in Zhongguancun Will Be over 100 Billion Yuan in Capital by 2015,” 2013. http://roll.sohu.com/20130527/n377114688.shtml
- The Economist, “China GDP Per Capita, Huge Regional Gap.” http://economistonline.muogao.com/2012/02/china-gdp-per-capita-huge-regional-gap.html http://www.economist.com/content/chinese_equivalents
- International Labour Office, “Global Wage Report 2012/ 13: Wage and Equitable Growth,” 2013. http://www.ilo.org/wcmsp5/groups/public/---dgreports/---dcomm/---publ/documents/publication/wcms_194843.pdf
- Ministry of Commerce People’s Republic of China, “China Publishes First Industrial Restructuring Plan,” 2012. http://english.mofcom.gov.cn/article/counselorsreport/asiareport/201201/20120107936006.shtml
NOTES
1The formula for employment location quotient is the ratio of employment in the ICT industry in a region to the total employment in the region as a proportion of the ratio of total national employment in the ICT industry to total national employment.