Journal of Mathematical Finance
Vol.3 No.3A(2013), Article ID:38562,14 pages DOI:10.4236/jmf.2013.33A005
Leverage and the Maturity Structure of Debt in Emerging Markets
1Department of Accounting and Finance, University of Greenwich Business School, London, United Kingdom
2Escola de Administracao, Universidade Federal do Rio Grande do Sul (UFRGS), Porto Alegre, Brazil
Email: c.mateus@greenwich.ac.uk, prsterra@ea.ufrgs.br
Copyright © 2013 Cesario Mateus, Paulo Terra. This is an open access article distributed under the Creative Commons Attribution License, which permits unrestricted use, distribution, and reproduction in any medium, provided the original work is properly cited.
Received September 4, 2013; revised October 5, 2013; accepted October 16, 2013
Keywords: Capital Structure; Debt Maturity; Dynamic Panel Data Analysis; Latin America; Eastern Europe
ABSTRACT
The aim of this paper is to analyse for a multi-country large emerging market sample the choice between debt and equity simultaneously with the decision between shortand long-term debts. In order to investigate the joint decision among leverage and maturity, we examine an unique sample of 986 firms and 13,490 firm-year observations from Latin America and 686 firms and 7919 firm-year observations from Eastern Europe for the period 1990-2003. We employ dynamic panel data analysis using Generalized Method of moments. The empirical results support three main findings. First, the cross-effects between leverage and maturity behave exactly the opposite between Latin America and Eastern Europe sub-samples. Capital structure and debt maturity are policy complements in Latin America and substitutes in Eastern Europe. Second, there is a significant dynamic effects component in the determination of leverage and maturity. Finally, adjustment to the target maturity is by no means costless and instantaneous with firm facing moderate adjustment costs.
1. Introduction
Most of the empirical research on capital structure has focused on a single decision at a time, that is, each financial decision is taken as independent of the other decisions. It may be the case that most of these decisions are not independent but actually complements or substitutes among each other. If that is the case, a further investigation should be undertaken whether there is interdependence among them or not.
In this paper, we investigate the choice between debt and equity simultaneously with the decision between short-and long-term debt for a large sample of emerging markets from Latin America and Eastern Europe. In order to investigate the joint decision among leverage and maturity, we examine an unique sample of 986 firms and 13,490 firm-year observations from Latin America and 686 firms and 7919 firm-year observations from Eastern Europe for the period 1990-2003. These two regions are ideal for our purposes because they contain a larger number of countries that have gone through extensive privatization during the time period analysed but still in different stages in the transition to capitalism systems and markets development. In fact, Latin America has experienced hyperinflation and economic instability over the 1980s and profound economic reforms in the 1990s, and Eastern Europe has made the transition from centralized to market economies during the 1990s as well.
This paper has several objectives: First, we examine whether in an emerging countries context, the theory of joint capital structure and debt maturity determination, attempts to understand country and regions specific differences. Second, we test whether there is a substantial dynamic component in the determination of the endogenous variables. Third, we analyse whether there are differences in the adjustment costs towards optimal capital structure and debt maturity.
The paper proceeds as follows: Section 2 is dedicated to the literature review. Section 3 presents the data sources and discusses sample selection, macro and firm-level financial information. In Section 4, the model and specification tests are presented. Results are presented in Section 5; Section 6 concludes.
2. Background on Capital Structure and Debt Maturity
Theories in capital structure and debt maturity as well as subsequent empirical work mainly focused in a single decision at a time. The main theories of capital structure can be classified into three groups: tax based, agency cost and asymmetric information theories. Trade-off theory argues that firms establish a debt target and strive to reach it through time. In the theoretical framework firms pursue an optimal capital structure determined by a tradeoff between the tax benefits of increasing debt financing (interest tax shield) and bankruptcy costs that arise from higher debt levels. As imperfections such taxes (corporate and personal), a variable interest rate, credit constraints, and bankruptcy costs are introduced in the model, the trade-off results (i.e. [1-3]).
A second group of the literature encompasses all those explanations that are based on imperfect information assumptions. In his seminal paper [4], argues that the value of the firm depends on its assets in place (whose value do not depend on future investment) as well as growth opportunities (whose value depends on future investment strategy). The implication is that this real option characteristic of the firm induces a transfer of wealth between shareholders and bondholders that may prevent the firm to undertake positive NPV projects (the debt overhandor underinvestment problem). [5] realizes that managers have privileged information regarding both tangible (assets in place) and intangible (growth opportunities) assets and investors are aware of this fact. In light of such imperfect information there may be wealth transfers between old and new shareholders when the firm decides to issue new securities. This information asymmetry affects the firm’s financing-investment decision in a way that causes managers to pass up valuable investment opportunities in order to preserve (old) shareholders’ interests: the underinvestment problem. Other stream of literature suggests the agency theory framework to study the optimal leverage ratio [6,7]. In their perspective, too little debt can lead to an overinvestment problem, as managers seek to sustain growth at the expense of profitability.
Theoretical arguments for the choice of corporate debt maturity can be divided in trade-off considerations and, asymmetric information problems as well. Arguments based on trade-off considerations rely on the proposition that the optimal maturity of debt is determined by the trade-off between the costs of rollover short-term debt vis-à-vis the usually higher interest rate bore by longterm debt. In many senses the arguments rely on explicit transaction costs of different kinds of debt such as flotation and rollover costs as well as tax-shield benefits and implicit bankruptcy costs. The tax-based explanation suggested by [8,9] are perhaps the best known examples. Other hypothesis derives from asymmetric information. In this case, the maturity structure is yet another instrument that firms can use in order to solve the agency problems faced by the various stakeholders of the firm. These agency approaches suggest that firms choose the optimal debt maturity in order to solve information asymmetry that gives rise to the underinvestment and/or overinvestment problems.
Most of the existing literature on capital structure comes from single country analysis. These studies use primarily large listed firms as in [10], for the United States, [11-13] for the United Kingdom, [14] for Spain and [15] for Portugal. A few studies focus on international samples ([16- 20]) and more recently [21-23]. However, all of these studies focus on large listed firms. In [16] the sample was from large listed firms for the G7 countries. They found that the determinants of capital structure in the United States are the same for the other countries. They also find that debt levels do not differ among bank-oriented countries and market-oriented ones. [17] finds for a sample of G5 countries that the mean leverage among countries appears to be similar. However, he highlights that some of the differences can occur because of the differences in tax policies, agency problems, and information asymmetries and shareholder/creditors conflicts. [18] finds for 10 developing countries that capital structure choices are affected by the same variables as in developed countries. [19], using the same sample as [16] but with more recent data found that the overall leverage in 2001 is lower than in 1991 and the determinants of capital structure is the United States lose some of the explanatory power overseas. [20] using a sample of listed firms provided evidence that neither the trade-off nor pecking order model offer a suitable description of the capital structure policies in Europe. They also document that the notional environment do matter for capital structure decisions. [21] uses a large sample of listed firms for 42 countries equally divided between developed and developing countries covering the years from 1997 to 2001. They stated that country-specific factors do matter in determining and affecting the leverage choice around the countries analysed. [22] analyses how firms operating in capital market-oriented economies (United States and United Kingdom) and bank-oriented economies (France, Germany and Japan) determine their capital structure. They find that leverage is affected by the market conditions in which the firm operates and overall the capital structure of a firm is heavily influenced by corporate governance, tax systems and the level of investor protection. Finally [23], using a sample of 39 developed and developing countries for the period 1991 to 2006 suggest that a firm’s capital structure is determined more by the country in which it is located than by its industry affiliation. They find as well that country’s legal and tax systems, level of corruption explain a significant portion of the variation in leverage.
Regarding debt maturity, most empirical studies have concentrated on the United States. [24,25] pioneer studies have taken different empirical approaches to the problem. While [25] investigates the maturity structure of firm’s total indebtedness, [24] focuses on the maturity of single bond issues. These are the two most common empirical approaches in the literature. The first approach is followed by [26-32]. The second approach is preferred by [33-35] who also investigate bond issues finding evidence of market timing of bond issues. Few studies investigate debt maturity in an international setting. [36] investigates the maturity structure of 604 and 750 nonfinancial firms from the United Kingdom and Italy, respectively. They find support for the hypothesis that firm chooses the maturity of their liabilities to match those in their assets. Their results are in line with those of [37,38] and find that debt maturity depends on both firm-specific and country-specific factors, opening the question of the degree of influence of each group of factors on the maturity structure. Larger sets of countries are studied by [39] who explored the hypothesis that the financial development of a country determines the maturity of its firms’ debt. They find support for the hypothesis that legal and institutional differences among countries explain a large part of the leverage and debt maturity choices of firms. [23] also studies the subject for 11 industries in 39 countries and their results largely support [39] findings.
In a joint determination of capital structure and debt maturity perspective [40] build the argument that a firm chooses leverage and debt maturity to maximize its value given a set of exogenous firm characteristics. Their empirical results suggest that capital structure and debt maturity are substitutes in addressing financial problems.
3. Data, Variables and Methodology
3.1. Macro Financial Data
This study focus in emerging markets countries that have gone through substantial changes in the past couple of decades. Two geographic distinguish groups are studied: Latin America, which has experienced hyperinflation and economic instability over the 1980s and profound economic reforms in the 1990s and, Eastern Europe that have made the transition from centralized to market economies about the same period of time. Both groups of countries have gone through extensive privatization as documented in [41,42] in the case of Latin America and [43,44] for Eastern Europe.
In Table 1 is provided a country-level summary statistics on key economic indicators and financial indicators for these countries for the period 1990 to 20031. The countries sampled are Argentina, Brazil, Chile, Colombia, Mexico, Peru and Venezuela (henceforth called “Latin America 7” or simply “LA-7”) and Bulgaria, Czech Republic, Latvia, Lithuania, Poland, Romania and the Russian Federation (henceforth called “Eastern Europe 7” or simply “EE-7”).
In both groups of countries is observed highly inflationary environments in the period 1990-2003, although the high average annual inflation is influenced by the hyper-inflationary early 1990s in some countries (e.g. Argentina, Bulgaria, Brazil and Mexico). In addition, inflation has been more resilient in Romania and Russian Federation (henceforth simply “Russia”) during the same period. Due to this inflationary environment, countries in the sample display depressing growth, particularly in Eastern Europe. The average annualized growth rates are often negative for the EE-7, and generally below 3 percent in Latin America2. The economies in the sample are in general small, with three large outliers: Brazil, Mexico and Russia, which have GDPs above US$300 billion in constant US dollars (2000). In terms of financial structure, Latin American economies showed in general a more developed stage than Eastern European ones. The EE-7 has a larger ratio of liquid liabilities to GDP than the LA-7 that might be reflect of the higher inflation rate, since central bank assets are proportionally bigger in the LA-7. In both groups the credit to the private sector is similar, but EE-7 countries seem to be more bank-based than the LA-7 given the larger bank deposits to GDP and bank concentration. Interestingly, the net interest margin is higher for the LA-7 indicating a less competitive bank market. Private bond markets are equally incipient for both groups of countries, while public bond markets are at least three times larger. This might suggest that the government crowds out private issuers in such markets. Stock markets are greater in Latin America, in both absolute and relative terms, although Eastern European markets are relatively more actively traded. In all other aspects, Latin American stock markets seem more developed: they trade a larger number of companies and those companies have larger market capitalization than their counterparts in the EE-7. This is not a surprise since stock markets in Latin America date from the beginning of the 20th century while in Eastern Europe such markets have just begun trading about two decades ago.
In summary, these are economies that have a recent history of unstable economies, combining higher inflation with lower growth. These economies are predominantly bank-based, although the LA-7 has comparatively more developed stock markets, and public bond markets are much larger than private ones moving towards market based more quickly than eastern European countries.
3.2. Firm-Level Data and Variables
The primary data sources are from the Economatica Pro

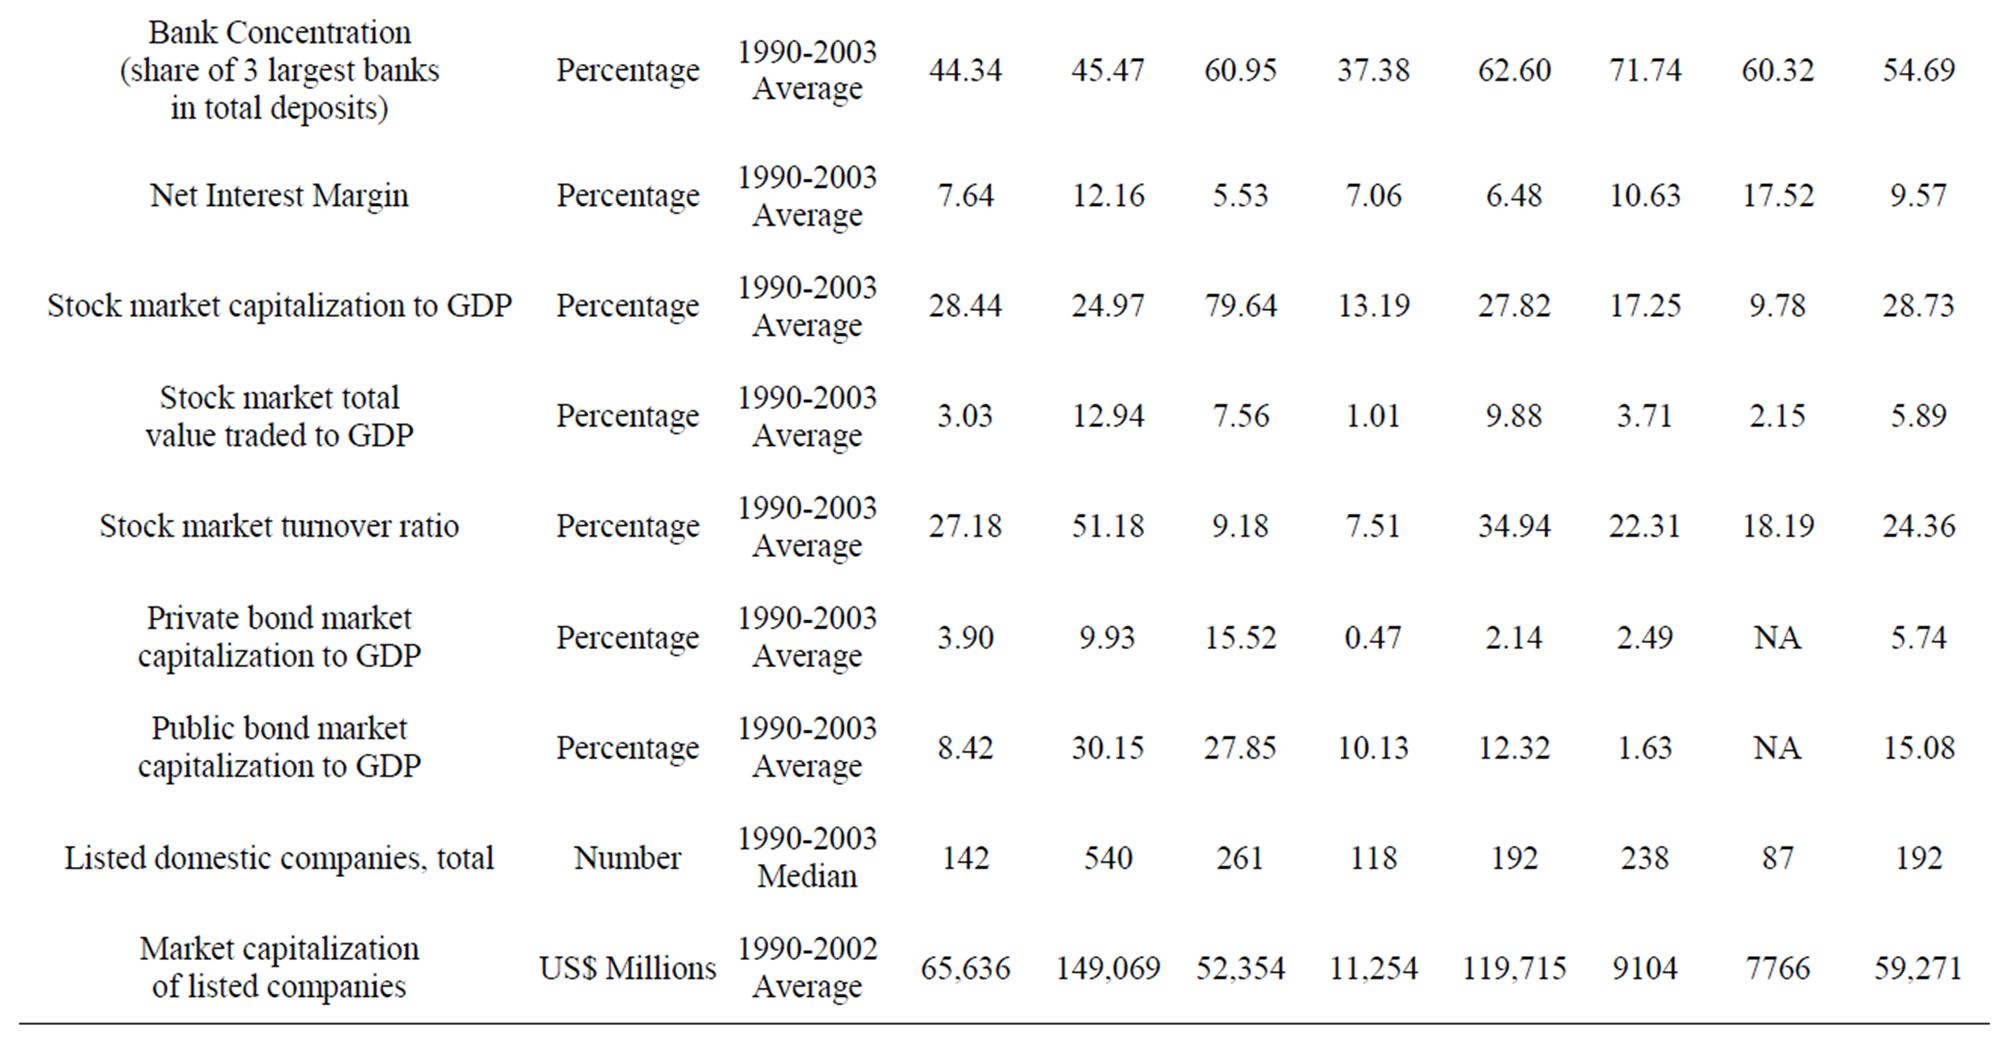
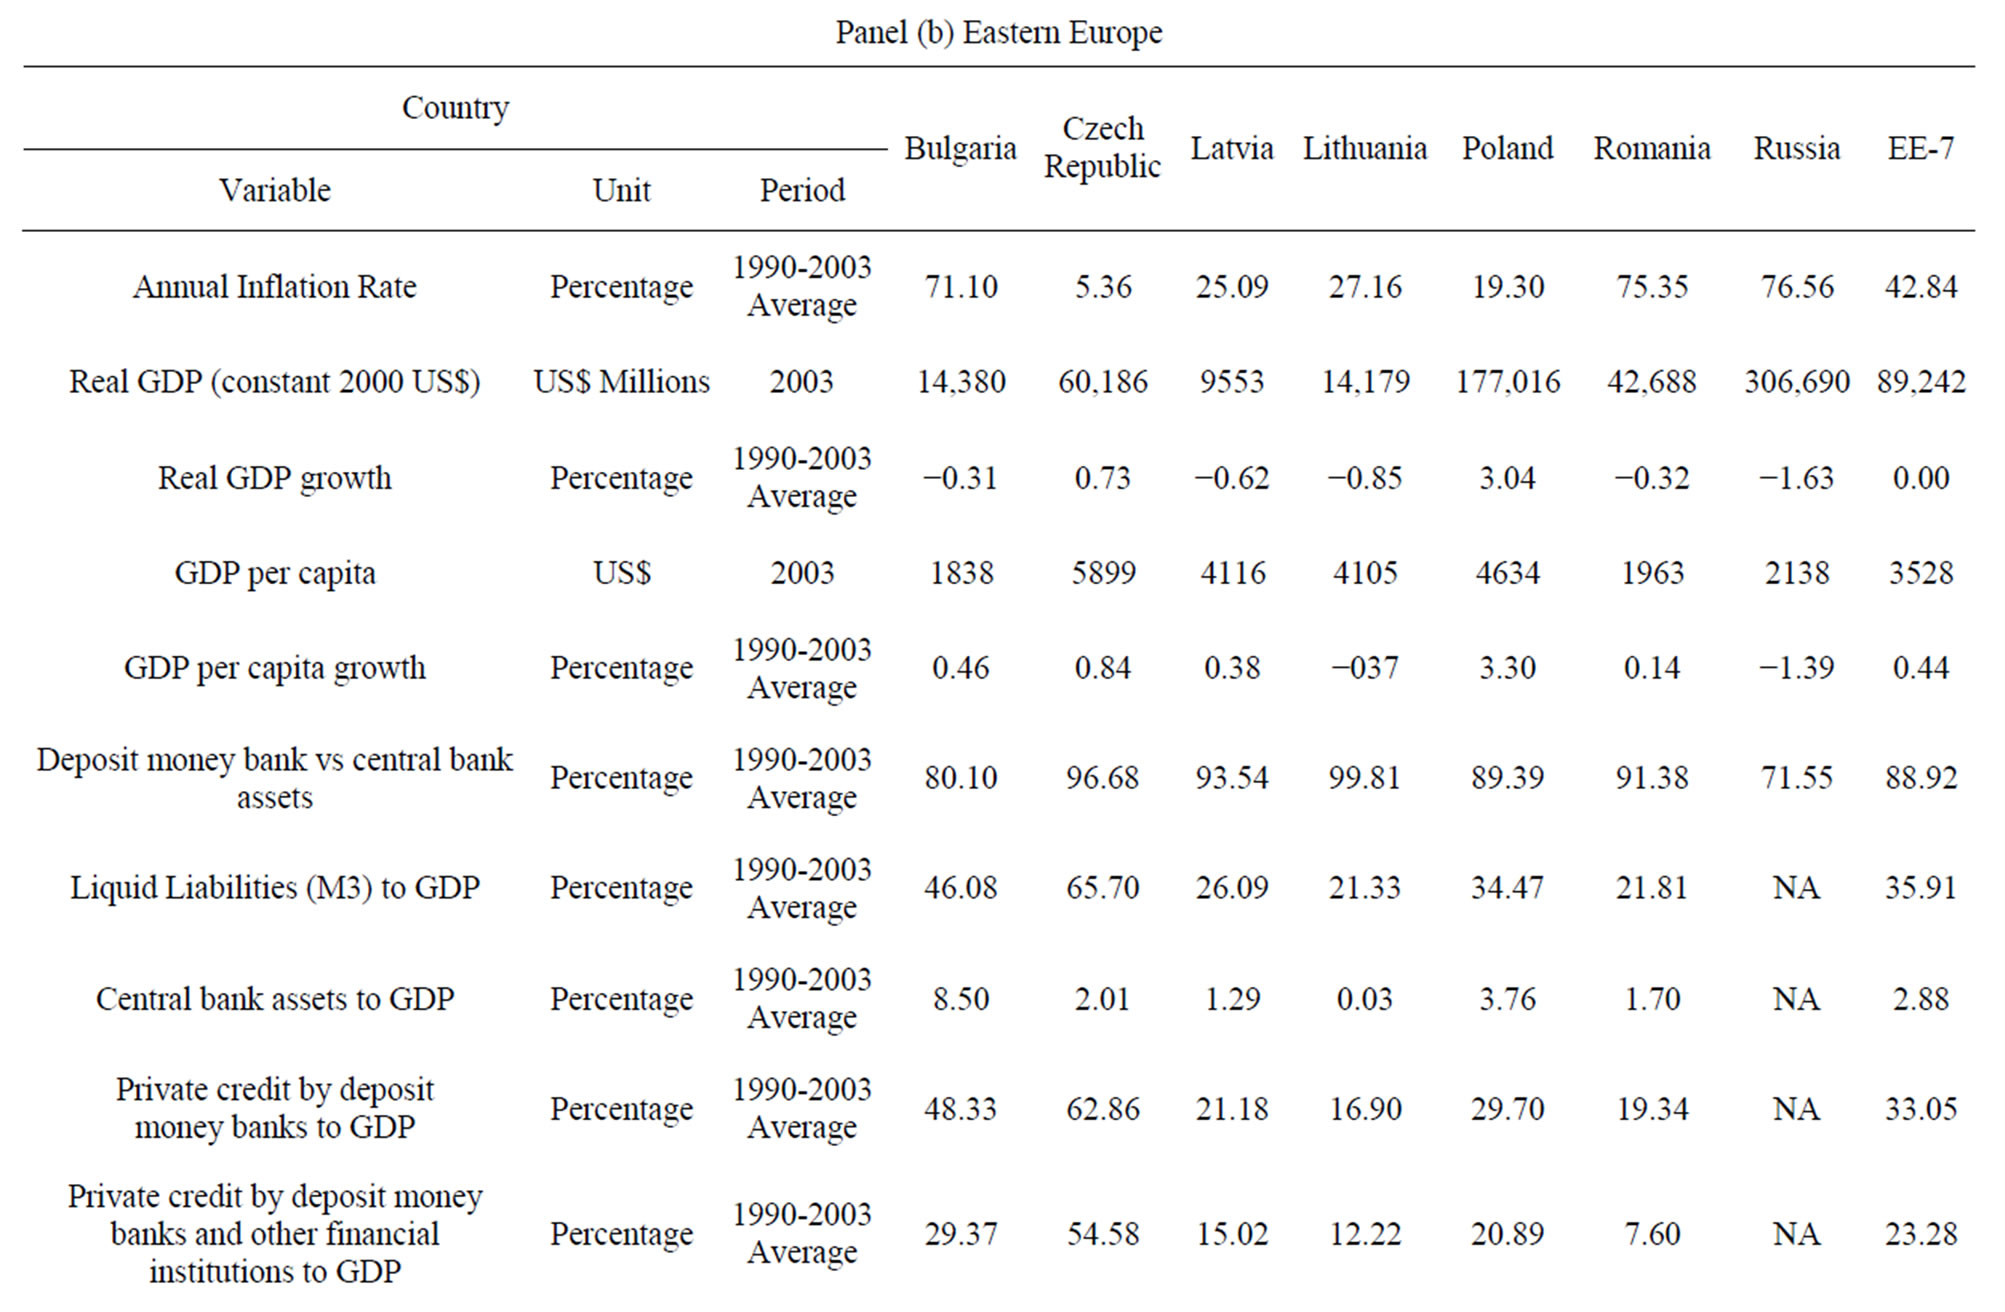

Table 1. Macro financial data. The table presents key economic and financial indicators from the financial structure database (World Bank, 2005a) and World Development Indicators Online (World Bank, 2005b). The sample consists of yearly observations for each country over the period 1990 to 2003 (unless indicated otherwise), depending on data availability. EE-7 refers to the simple average of country-level data for Bulgaria, Czech Republic, Latvia, Lithuania, Poland, Romania and the Russia, and “LA-7” refers to the simple average of country-level data for Argentina, Brazil, Chile, Colombia, Mexico, Peru and Venezuela.
database for the Latin America countries (Economatica 2003) and from the 2004 version of Amadeus (Analyse major Database from European Sources) Database by Bureau Van Dijk for the Eastern European countries. We only considered listed firms, the level of analysis is each firm and observations are yearly during the period 1990- 2002 for Latin America and 1994-2003 to Eastern Europe. The database contains 1242 unique firms for the LA-7 and 693 industrial firms for the EE-7 over the period covered. After excluding financial firms as well as firms with missing data for key variables (discussed later), the sample is reduced to 986 firms and 13,490 firm-year observations from Latin America and 686 firms and 7,919 firm-year observations from Eastern Europe3. Table 2 presents the distribution of firms by country and region.
The dependent variables in our study are proxies for leverage and maturity of debt and measured as long-term debt over book equity (i.e. the debt-equity-to-ratio “Leverage”) and long-tern financial debt over short-term loans plus long-term financial debt (i.e. “Maturity”)4.
Table 3 panels (a) and (b) shows the summary statistics of Leverage and Maturityfor the LA-7 and EE-7 countries, respectively. One can highlight that Brazil heavily influences the Latin America sample while the most influential countries in Eastern Europe are Poland, Russia and Bulgaria. On the other hand, Venezuela has little impact on the Latin America sample as well as Latvia in the Eastern Europe group of firms. There is evidence of substantially higher maturity ratios for EE-7 compared with LA-7 (0.59 and 0.48, respectively), being Mexico and Poland the countries with larger values in each sub-sample (0.54 and 0.76, respectively). In terms of Leverage, long term debt corresponds to 105 percent and 19 percent of equity to LA-7 and EE-7 countries, respectively. Brazil has the highest level of leverage for the whole 14 countries (170 percent) while Poland has the lowest level (8 percent).
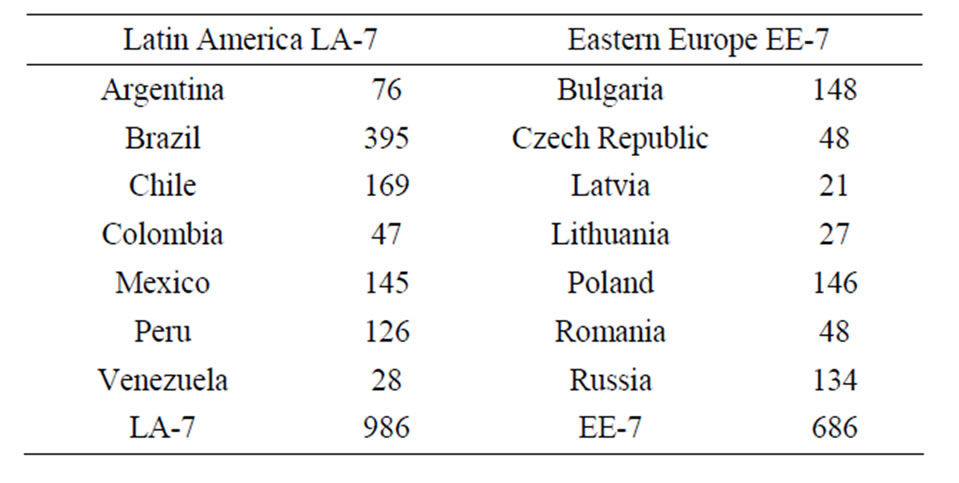
Table 2. Firms by country and region. The sample consists of 986 firms from Argentina, Brazil, Chile, Colombia, Mexico, Peru and Venezuela (Economatica Pro database, 2003) over the period 1990-2002 and 686 firms from Bulgaria, Czech Republic, Latvia, Lithuania, Poland, Romania and Russia (Amadeus database, 2004) over the period 1994- 2003.
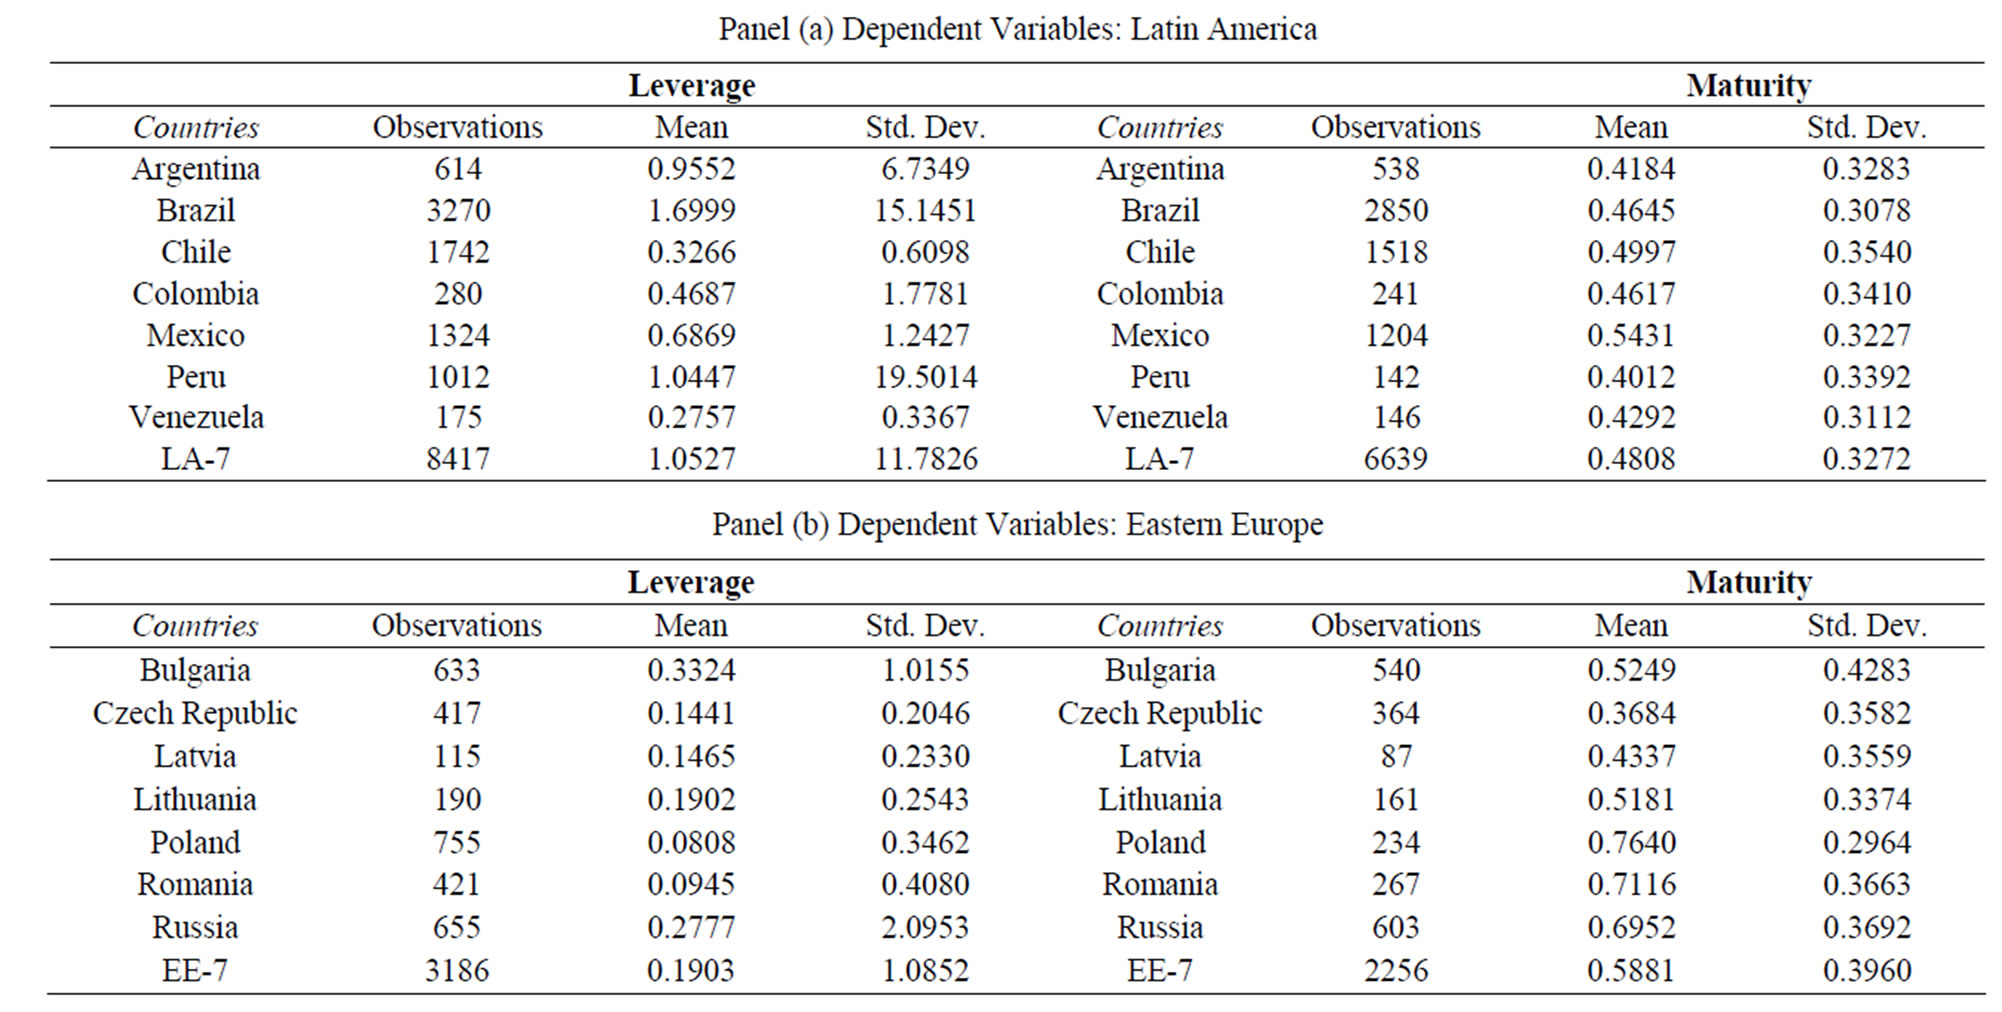
Table 3. Summary statistics. The sample consists of 13,490 firm-year observations from Argentina, Brazil, Chile, Colombia, Mexico, Peru and Venezuela (Economatica Pro database, 2003) over the period 1990-2002 and 7919 firm-year observations from Bulgaria, Czech Republic, Latvia, Lithuania, Poland, Romania and Russia (Amadeus database, 2004) over the period 1994-2003. Leverage is calculated as the book value of long-term debt over book value of equity. Maturity is the book value of long-term financial debt over book value of short-term loans plus book value of long-term financial debt. “LA-7” refers to the pooling together of all firm-level data from Argentina, Brazil, Chile, Colombia, Mexico, Peru and Venezuela, while “EE-7” refers to the pooling of firm level data for Bulgaria, Czech Republic, Latvia, Lithuania, Poland, Romania and Russia.
Firm-specific determinant factors for the debt maturity structure are chosen from those often suggested in the literature. The set of firm-specific variables consists of the following: size, growth opportunities, profitability, liquidity, tangibility, tax effects and business risk. In detail the variables are calculated as: 1) size is measured by the natural logarithm of sales; 2) growth opportunities of the firm are assessed by the market-to-book ratio for Latin America firms5 calculated as book value liabilities plus market capitalization over total book value assets; for Eastern Europe firms growth opportunities are measure as the ratio of intangible fixed assets to total fixed assets6; 3) profitability, a proxy for firm and credit quality, is calculated according to the usual return-on-assets ratio by operating income over total book assets; 4) business risk is measured by the degree of operational leverage and calculated as sales divided by operating income; 5) the degree of liquidity as an indicator of cash constraints is given by the current liquidity ratio and measured as current assets over current liabilities; 6) the degree of tangibility of assets as an indicator of collateral value is given by the degree of asset immobilization and measured as net fixed assets over total book assets and finally; 7) the tax effects are measured by the effective average tax rate of the firm the ratio of total taxes charges divided by taxable earnings7. Additionally, we also define a binary variable to control for regulated industries. This variable assumes the value of one if the firm’s main industrial activity belongs to one of the following Industries: Contraction, Electricity, Gas and Oil, Mining, Telecommunications, Transport and Logistics. These Industries are subject to closer government scrutiny even when pursued solely by private companies, and are submitted to stricter regulations than other industries.
Table 4 panels (a) and (b) reports summary statistics for the independent variables of Latin America and Eastern European firms, respectively. We can highlight that LA-7 firms are larger, with more growth opportunities, are less profitable, have lower business risk and pay less taxes, on average. However, some variables have a larger dispersion around their average. That is the case for example for the business Risk proxy with a standard deviation of 218.00 and 507.45 for LA-7 and EE-7, respectively. Therefore, the average values should be analysed with some concerns suggesting the presence of large outliers that may inflate the standard deviation for this variable and others8.
In Table 5 (Panels (a) and (b)) it is presented the correlation matrix for the independent variables (firm’s characteristics). We can highlight that larger firms tend to be more profitable, with more growth opportunities, have less liquidity, are riskier and have more fixed assets as a proportion of total assets in the case of LA-7 and less so for the EE-7 countries9.
Besides the above variables, we employ a set of dummy variables as instruments. First, the sector where each firm operates is included, given the possible systematic effects that the nature of the firm’s businesses may have over its leverage, in particular the total leverage measures. The different sectors10 are represented by a set of dummy variables based on their classification provided in the databases. The sector “Food and Beverages” is chosen as the base-case so that the instrument set may include an intercept. Similarly, country dummies are used to account for any country-specific variation such as the institutional framework, business environment, and macroeconomic conditions. For this situation “Brazil” is chosen as the base case for Latin America and “Bulgaria” for Eastern Europe.
4. Model and Specification Tests
4.1. The Empirical Model
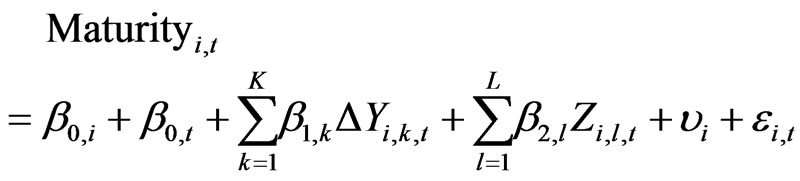
A panel data analysis is performed according to the following general (static) model:

(Equation (1))
where,  and
and  are the stacked vec-

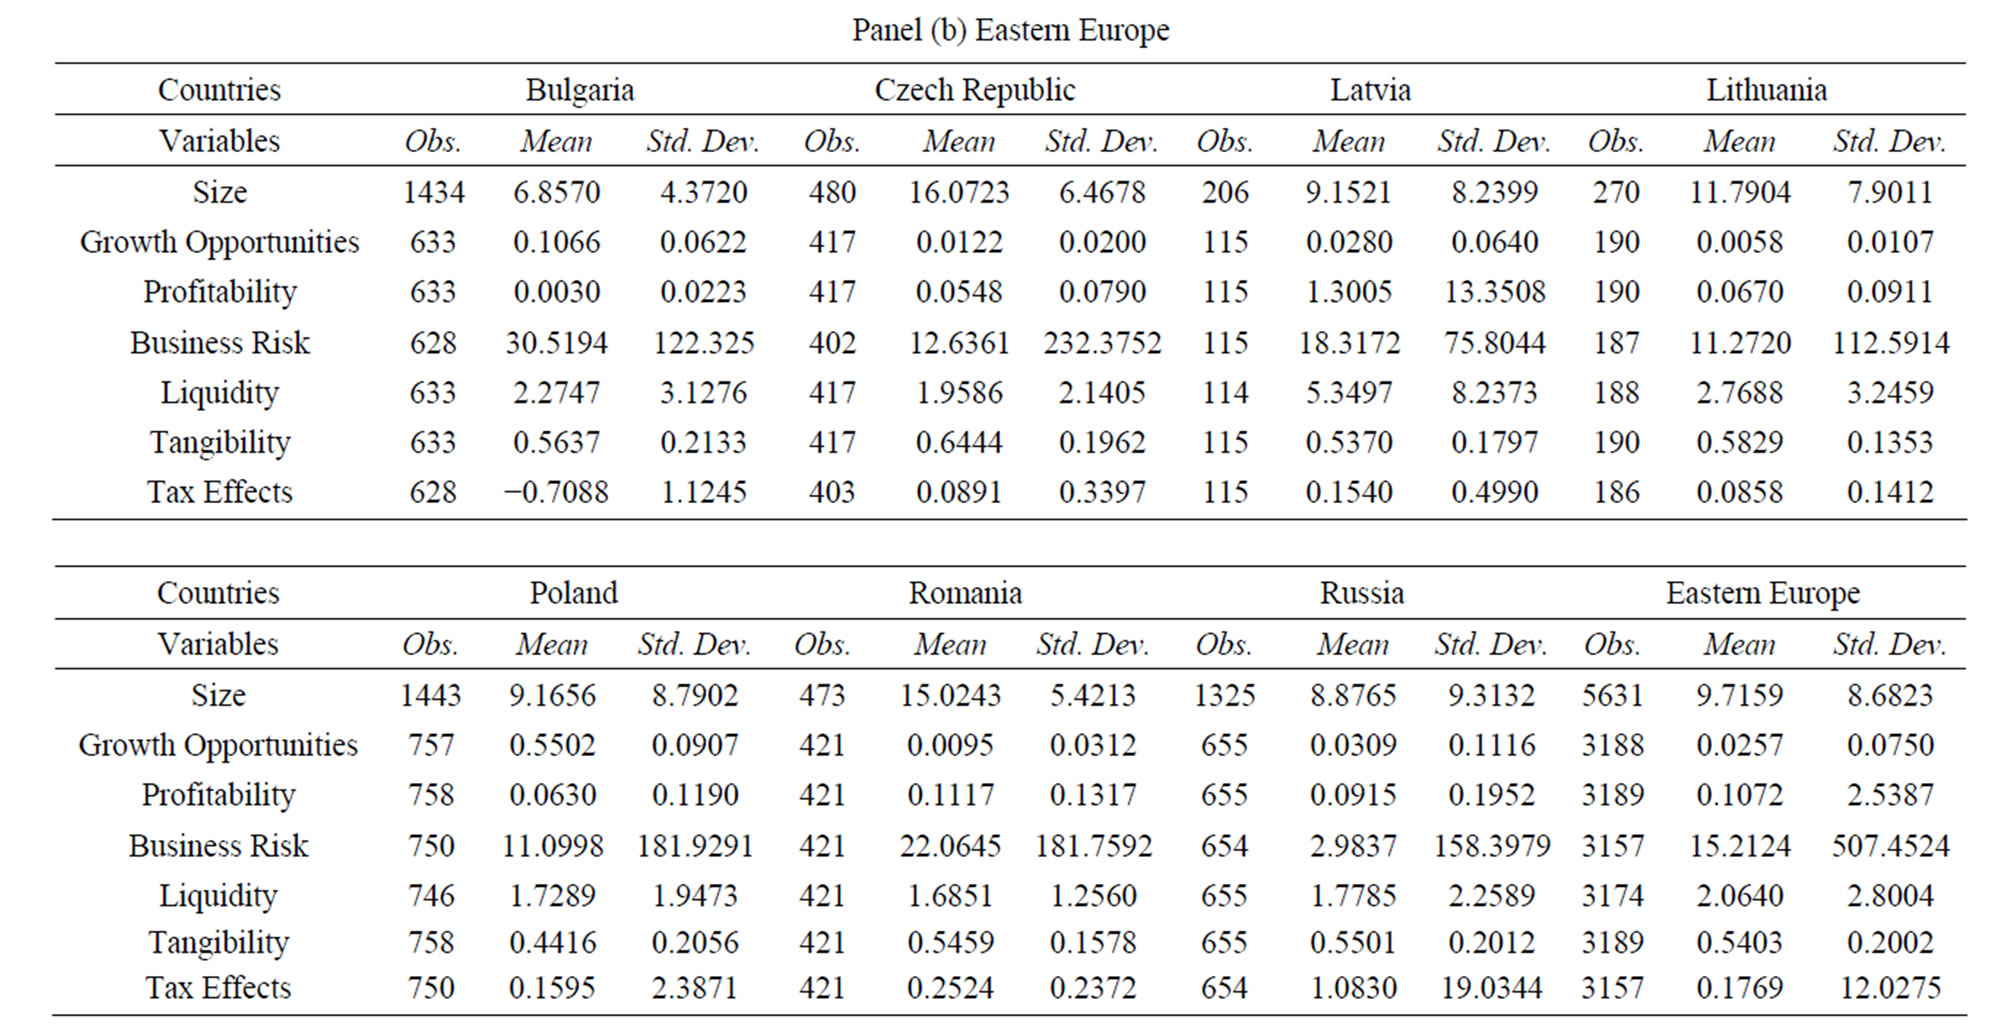
Table 4. Summary statistics for independent variables. (a) The sample consists of 13,490 firm-year observations from Argentina, Brazil, Chile, Colombia, Mexico, Peru and Venezuela (Economatica Pro database, 2003) over the period 1990-2002. Size is the natural logarithm of total sales. Growth opportunities are equal to the book value of liabilities plus market capitalization over book value of total assets. Profitability is equal to operating income over book value of total assets. Business Risk is calculated as sales over operating income. Liquidity is book value of current assets over book value of current liabilities. Tangibility is defined as net fixed assets over book value of total assets. Tax Effects is equal to taxes over taxable earnings. “Latin America” refers to the pooling together of all firm-level data from Argentina, Brazil, Chile, Colombia, Mexico, Peru and Venezuela; (b) The sample consists of 7919 firm-year observations from Bulgaria, Czech Republic, Latvia, Lithuania, Poland, Romania and Russia (Amadeus database, 2004) over the period 1994-2003. Size is the natural logarithm of total sales. Growth Opportunities are the ratio of intangible fixed assets to total fixed assets. Profitability is equal to operating income over book value of total assets. Business Risk is calculated as sales over operating income. Liquidity is book value of current assets over book value of current liabilities. Tangibility is defined as net fixed assets over book value of total assets. Tax Effects is equal to taxes over taxable earnings. “Eastern Europe” refers to the pooling together of all firm-level data from Bulgaria, Czech Republic, Latvia, Lithuania, Poland, Romania and Russia.
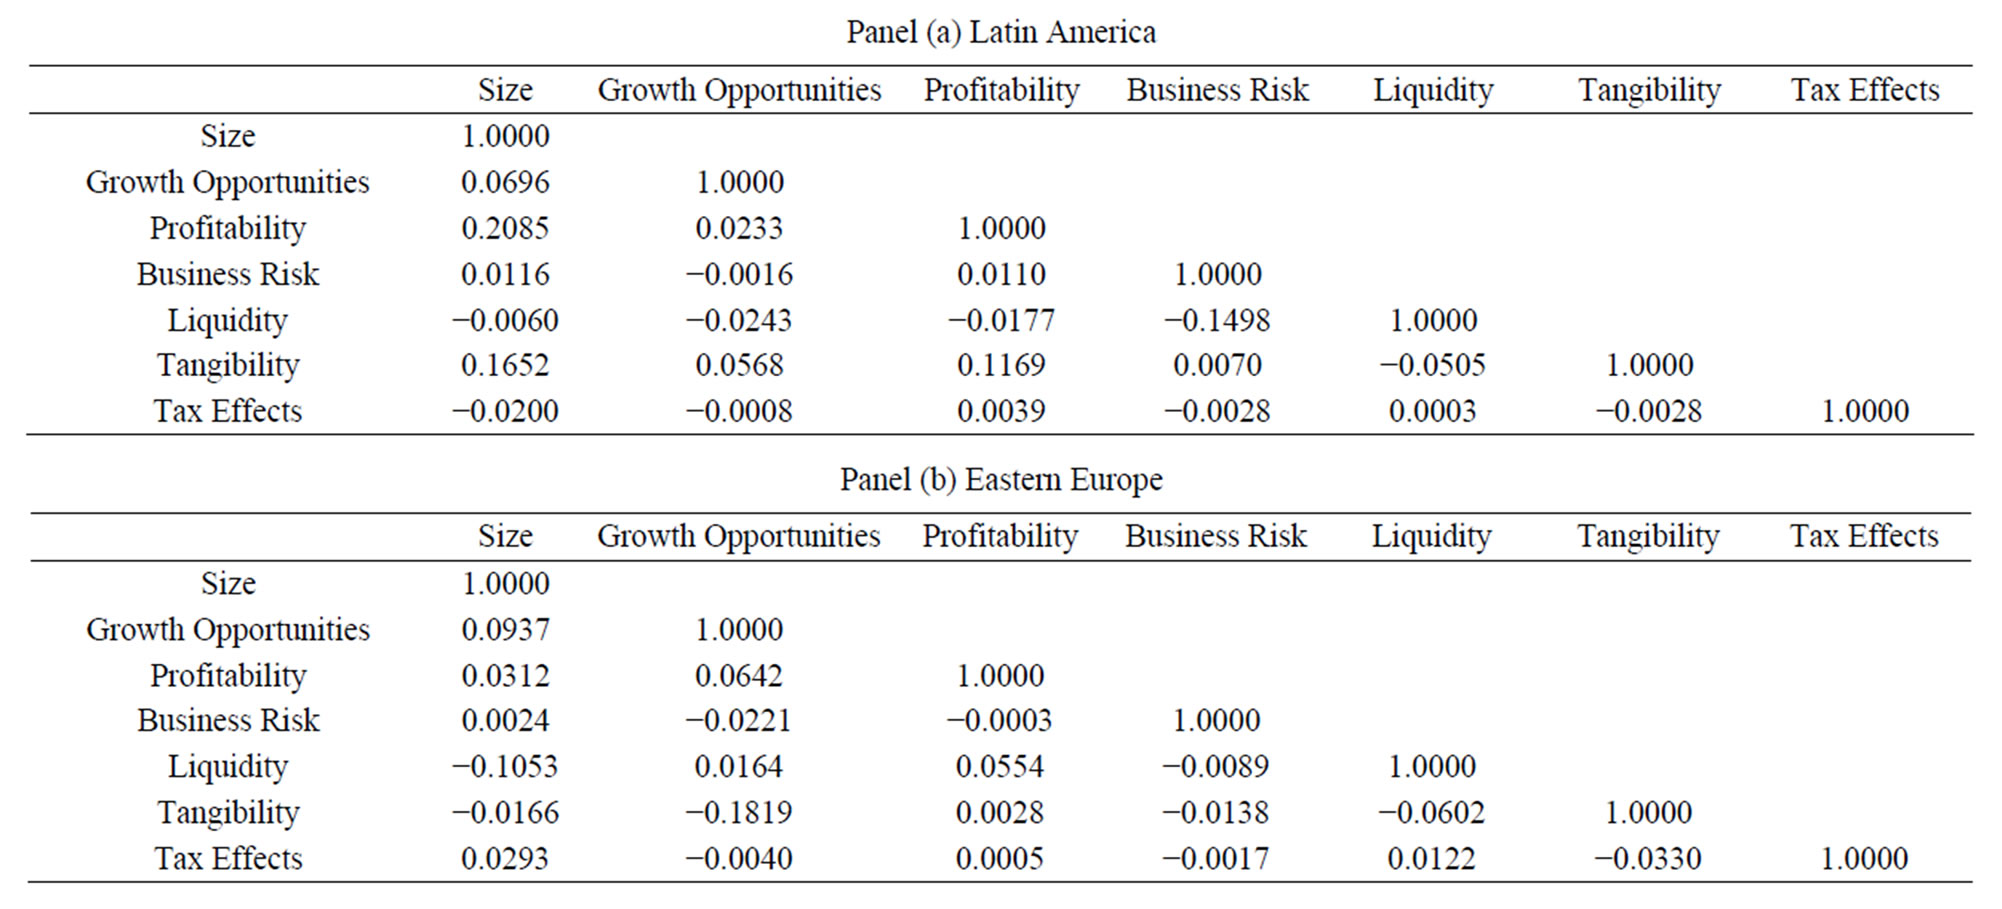
Table 5. Correlation matrices. (a) The sample consists of 13,490 firm-year observations from Argentina, Brazil, Chile, Colombia, Mexico, Peru and Venezuela (Economatica Pro database, 2003) over the period 1990-2002; (b) The sample consists of 7919 firm-year observations from Bulgaria, Czech Republic, Latvia, Lithuania, Poland, Romania and Russia (Amadeus database, 2004) over the period 1994-2003.
tors of the dependent (endogenous) variables ((the ith- firm leverage and maturity ratios on the tth-period),  is the matrix of K firm-specific independent (explanatory) variables (including industry dummies in the simple pooling and random-effects models),
  is the matrix of L country dummies (in the simple pooling and random-effects models),
  is the firm-specific intercept in the fixed-effects model,
  is the period-specific intercept,
  and
and  are the matrices of coefficients,
  is the firm-specific error term in the random-effects model, and
  is a vector of error terms. Due to the nature of the data (panel data) we test the model for fixed and random effects. Once it is established that the fixedeffects model provides a good fit for the model then the lagged endogenous variable is added to Equation (1), which is then first-differenced yielding the dynamic system below:
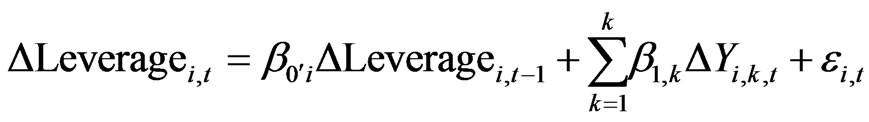
(Equation (2))

One advantage of this specification is that the rate of adjustment of the firm towards its optimal capital structure and maturity (assuming that the optimal capital and maturity structures are determined by the exogenous variables ) can be estimated as
 . If adjustment costs are high, the rate of adjustment is expected to be small (
 approaching zero), while a very high rate of adjustment (
 approaching one) suggests the presence of negligible adjustment costs.
4.2. Preliminary Specification Tests
Our analysis starts to determine which model (simple polling, fixed-effects, or random-effects) is more appropriate to the sample data. We perform two independent specification tests: The F-test of Simple Pooling versus Fixed-effects model and the Hausman test of randomeffects versus fixed effects. The results are shown in Table 6 (Panels (a) and (b)). The results (Panel (a)) strongly reject the single intercept hypothesis, both for the LA-7 and for the EE-7. In panel (b) the Hausman specification test is performed to test which model of variable intercepts across firms better fits the data. This test is particularly appropriated in situations wher N (the number of cross-sectional units) is large relative to T (the number of time periods) which is precisely the case of our sample. The test rejects the random-effects specification for the leverage equation in the LA-7 and the maturity equation for the EE-7. However, for the remaining cases it cannot reject such specification for both groups of countries.
5. Results
5.1. Dynamic Panel Data Estimation Results
Preliminary runs of the fixed-effects model of Equation (1) revealed a substantial presence of autocorrelation in the residuals. This finding raises the question that the maturity choice of the firm may be dynamic, i.e., current

Table 6. Specification tests. (a) This test statistic is for testing the null hypothesis that firms’ intercept in the basic fixed-effects panel data model are all equal, against the alternative hypothesis that each firm has its own (distinct intercept). The test assumes identical slopes for all independent variables across all firms, and it is distributed F(df1, df2). “All” refers to the pooling together of all firm-level data for Argentina, Brazil, Chile, Colombia, Mexico, Peru, Venezuela, Bulgaria, Czech Republic, Latvia, Lithuania, Poland, Romania and Russia. “LA-7” refers to the polling together of all firm-level data for Argentina, Brazil, Chile, Colombia, Mexico, Peru, Venezuela while “EE-7” refers to the polling of firm-level data for Bulgaria, Czech Republic, Latvia, Lithuania, Poland, Romania and Russia. The data covers the period 1990-2003. Endogenous variables are: Leverage is equal to long-term book liabilities divided by book value of equity and Maturity is equal to long term debt divided by total debt. P-values are in parenthesis. ***, ** and * represents significant at the 1%, 5% and 10% levels; (b) This test statistic is for testing the null hypothesis of the random-effects specification against the alternative hypothesis of the fixed-effects specification in the basic panel data model, and it is distributed Χ2 (df). “All” refers to the pooling together of all firm-level data for Argentina, Brazil, Chile, Colombia, Mexico, Peru, Venezuela, Bulgaria, Czech Republic, Latvia, Lithuania, Poland, Romania and Russia. “LA-7” refers to the polling together of all firm-level data for Argentina, Brazil, Chile, Colombia, Mexico, Peru, Venezuela while “EE-7” refers to the polling of firm-level data for Bulgaria, Czech Republic, Latvia, Lithuania, Poland, Romania and Russia. The data covers the period 1990-2003. Endogenous variables are: Leverage is equal to long-term book liabilities divided by book value of equity and Maturity is equal to long term debt divided by total debt. P-values are in parenthesis. ***, ** and * represents significant at the 1%, 5% and 10% levels.
maturity may depend on past maturity. [22] explicitly models such possibility, and suggest that a dynamic rather than static panel data analysis may be adequate. However, the usual OLS and GLS estimators are biased and inconsistent when the lagged dependent variable is included in the right-hand side of the panel data model11. In order to overcome this problem, GMM estimation is used instead. Therefore, Equation (2) is estimated by Generalized Method of Moments (GMM) using as instruments first-order lagged values of the levels of explanatory variables, sector dummies, country dummies, and a constant. Standard errors are heteroskedasticity robust according to the method proposed by [49] and are also robust to autocorrelation. Table 7 reports the results for all countries pooled together and Table 8 for each region separately12.
One major result is that maturity equations perform slightly better than the leverage ones. When all countries are polled together (in Table 7) the dummy variable used to signal the difference between the two regions, becomes significant for the leverage equation but not for the maturity one. This result indicates that the level of debt is different between the two samples. Another interesting result is that it is easier for the firm to change the maturity of its debt than to adjust its leverage ratio. At the same time, adjustment to the target maturity is by no means costless and instantaneous. The estimated rate of adjustment to an optimal capital structure ranges between 0.55 and 0.64 an indication that firms in the sample face moderate adjustment costs, being these adjustments costs in general higher for capital structure than for debt maturity, and this is a pattern between the LA-7 and the EE-7 samples. The cross-effects between leverage and maturity behave exactly the opposite between the LA-7 and the EE-7 (Table 8). While maturity has a significant positive contemporaneous effect on leverage (and vice versa) for the LA-7, it has a significant negative effect in the EE-7. This finding indicates that these policy variables are complements in Latin America and substitutes in Eastern Europe. One possible explanation for this difference in results for each group of countries is their particular institutional and economic environments differences for the period of the analysis. Latin America stock markets seem more developed (trade more companies and have larger market capitalization than their counterparts in Eastern Europe) and therefore Latin American firms obtained a financial advantage that allows them use financing alternatives in their favour, reinforcing each other. Regarding the explanatory variables, it is worth to underscore that the two variables pointed out by [27] as the
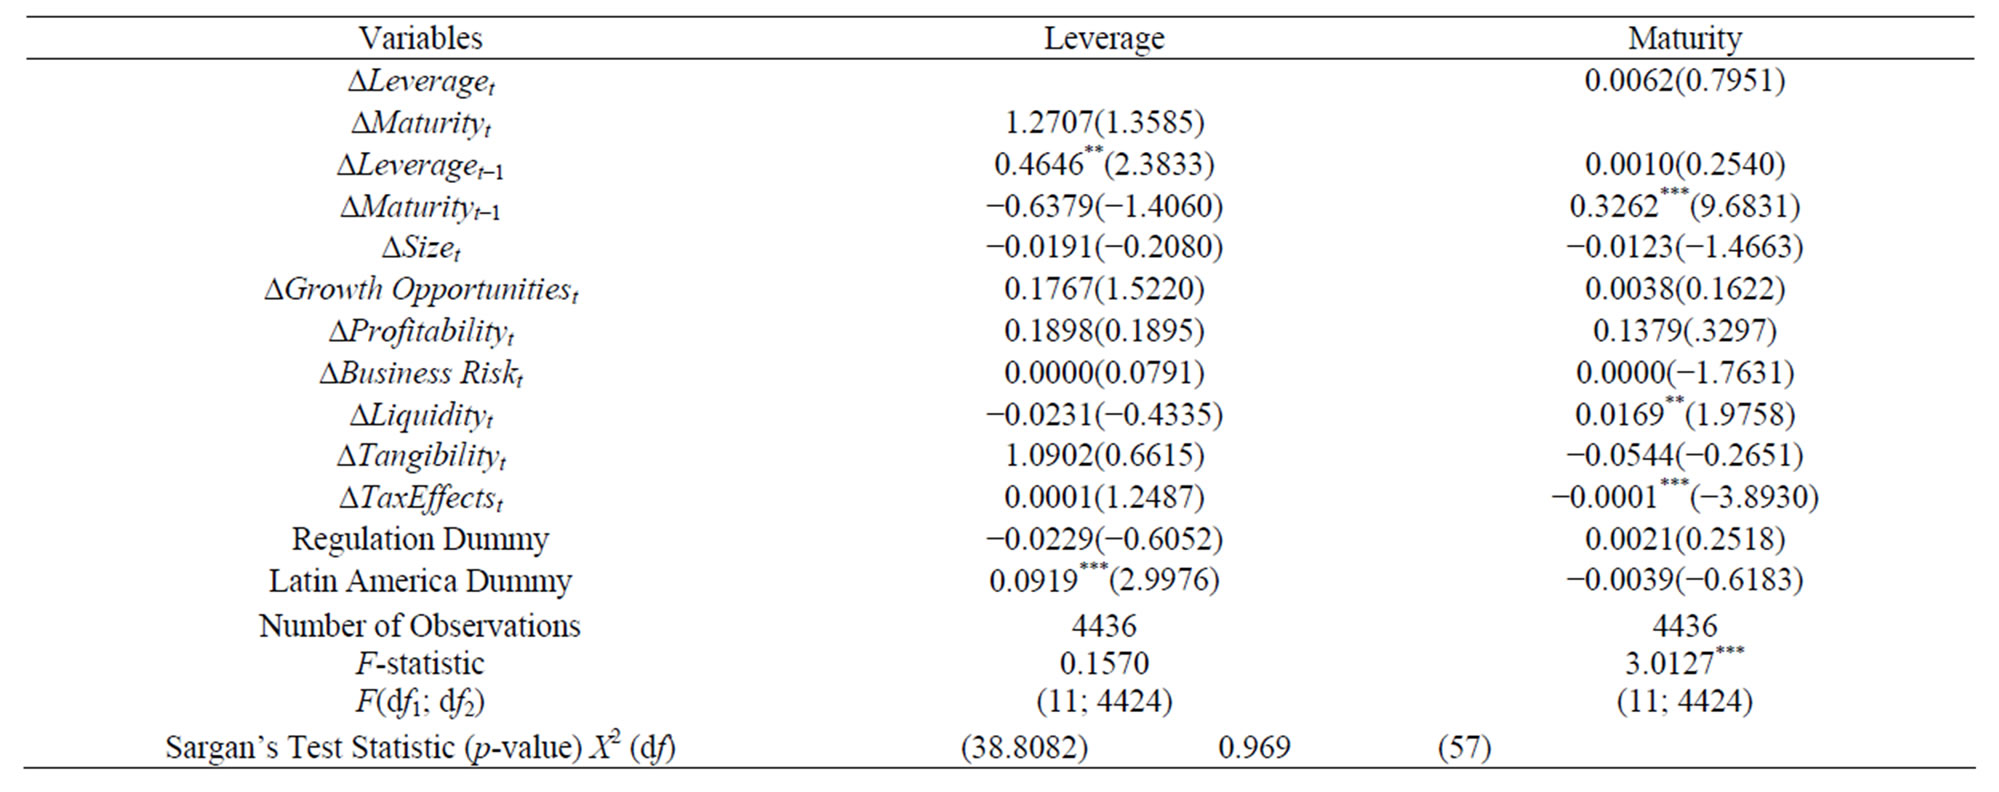
Table 7. Panel data analysis of maturity ratios for Pooled Countries. First-differences model so that idiosyncratic firm-effects constant through time are eliminated. The following model are estimated ΔLeveragei,t = β0,1ΔLeveragei,t−1 + β1,kΔY1,k,t + εi,t and ΔMaturityi,t = β0,1ΔMaturityi,t−1 +
 β1,kΔY1,k,t + εi,t by Generalized Method of Moments (GMM) using as instruments first order lagged values of the levels of explanatory variables, industry and country dummies and constant. Estimation period is from 1990 to 2003. The sample refers to the polling together of all firm-level data for Argentina, Brazil, Chile, Colombia, Mexico, Peru, Venezuela, Bulgaria, Czech Republic, Latvia, Lithuania, Poland, Romania and Russia. Dependent variables are Leverage equal to long-term book liabilities divided by book value of equity and Maturity is equal to Long-term debt divided by total debt. Reported t-statistics are calculated using heteroskedasticity-robust standard errors (White) and are also robust for autocorrelation (Bartlett Kernel); t-statistics in parenthesis and ***, ** and * represents significant at the 1%, 5% and 10% levels.

Table 8. Panel data analysis of maturity ratios for Latin America and Eastern Europe. First-differences model so that idiosyncratic firm-effects constant through time are eliminated. The following model are estimated ΔLeveragei,t = β0,1ΔLeveragei,t−1 + β1,kΔY1,k,t + εi,t and ΔMaturityi,t = β0,1ΔMaturityi,t−1 +
 β1,kΔY1,k,t + εi,t by Generalized Method of Moments (GMM) using as instruments first order lagged values of the levels of explanatory variables, industry and country dummies and constant. Estimation period is from 1990 to 2003. “Latin America” refers to the pooling together of all firm-level data for Argentina, Brazil, Chile, Colombia, Mexico, Peru and Venezuela. “Eastern Europe” refers to the polling together of all firm-level data for Bulgaria, Czech Republic, Latvia, Lithuania, Poland, Romania and Russia. The sample refers to the polling together of all firm-level data for,. Dependent variables are Leverage equal to long-term book liabilities divided by book value of equity and Maturity is equal to Long-term debt divided by total debt. Reported t-statistics are calculated using heteroskedasticity-robust standard errors (White) and are also robust for autocorrelation (Bartlett Kernel); t-statistics in parenthesis and ***, ** and * represents significant at the 1%, 5% and 10% levels.
major theoretical determinants of the joint decision, Growth Opportunities and the Regulation dummy, are not significant in any equation and sample. Additionally, Size is found significant in Latin America, but not in Eastern Europe; Liquidity is significant in both samples and for all equations, being in general positive (more liquid firms choose less and shorter debt); Tax Effects are also significant and positive (except for the leverage equation of the EE-7), indicating that more heavily taxed firms choose a higher level of indebtedness and longer maturity.
5.2. Sensitivity Analyses
One question that emerges from the cross-country approach chosen in this paper is whether a single country may be driving the results. In order to check for the robustness of the findings, we apply [50] global sensitivity analysis approach. We therefore re-estimate Equation (2) by dropping all observations of a given country at a time. We also check for the influence of any single year over the results by dropping all observations of a given year at a time and that of a single industry by dropping all firms of an industry at a time. Results of these sensitivity analyses support the robustness of the previous findings. The average coefficients for independent variables are similar to the results reported above, and so are the t-statistics. In particular, the significance is in general confirmed in the [50] histograms for those variables that are significant in the whole sample analysis presented in Table 8 (lagged leverage and lagged maturity, contemporaneous leverage and maturity, size, liquidity, and tax effects).
6. Conclusions
This paper investigates the choice between debt and equity simultaneously with the decision between short-and long-term debt for a large sample of emerging markets from Latin America and Eastern Europe. This was done by using a unique sample of 986 firms and 13,490 firmyear observations from Latin America and 686 firms and 7919 firm-year observations from Eastern Europe for the period 1990-2003. The paper sets out to address three research questions: are capital structure and debt maturity decisions taken simultaneously? Secondly, is there a dynamic component in the determination of the optimal capital structure and debt maturity? Thirdly, are adjustments costs towards optimal capital structure and debt maturity important?
The empirical results support three main findings: first, the cross-effects between leverage and maturity behave exactly the opposite between Latin America and Eastern Europe sub-samples. Capital structure and debt maturity are policy complements in Latin America and substitutes in Eastern Europe; secondly, there is a significant dynamic effects component in the determination of leverage and maturity; finally, adjustment to the target maturity is by no means costless and instantaneous with firm’s facing moderate adjustment costs.
REFERENCES
- F. Modigliani and M. Miller, “Corporate Income Taxes and the Cost of Capital: A Correction,” American Economic Review, Vol. 53, No. 3, 1963, pp. 433-443.
- M. H. Miller, “Debt and Taxes,” Journal of Finance, Vol. 32, No. 2, 1977, pp. 261-275.
- H. DeAngelo and R. W. Masulis, “Optimal Capital Structure under Corporate and Personal Taxation,” Journal of Financial Economics, Vol. 8, No. 1, 1980, pp. 3-29. http://dx.doi.org/10.1016/0304-405X(80)90019-7
- S. Myers, “Determinants of Corporate Borrowing,” Journal of Financial Economics, Vol. 5, No. 2, 1977 pp. 147- 175. http://dx.doi.org/10.1016/0304-405X(77)90015-0
- S. Myers and S. Majluf, “Corporate Financing and Investment Decisions When Firms Have Information That Investors Do Not Have,” Journal of Financial Economics, Vol. 13, No. 2, 1984, pp. 187-221. http://dx.doi.org/10.1016/0304-405X(84)90023-0
- M. C. Jensen and W. H. Meckling, “Theory of the Firm: Managerial Behaviour, Agency Costs and Ownership Structure,” Journal of Financial Economics, Vol. 3, No. 4, 1976, pp. 305-360. http://dx.doi.org/10.1016/0304-405X(76)90026-X
- M. C. Jensen, “Agency Costs of Free Cash Flow, Corporate Finance and Takeovers,” American Economic Review, Vol. 76, 1986, pp. 323-339.
- I. E. Brick and A. Ravid, “On the Relevance of Debt Maturity Structure,” Journal of Finance, Vol. 40, No. 5, 1985, pp. 1423-1437. http://dx.doi.org/10.1111/j.1540-6261.1985.tb02392.x
- I. E. Brick and A. Ravid, “Interest Rate Uncertainty and the Optimal Debt Maturity Structure,” Journal of Financial and Quantitative Analysis, Vol. 26, No. 1, 1991, pp. 63-81. http://dx.doi.org/10.2307/2331243
- S. Titman and R. Wessels, “The Determinants of Capital Structure Choices,” The Journal of Finance, Vol. 43, 1988, pp. 1-19. http://dx.doi.org/10.1111/j.1540-6261.1988.tb02585.x
- A. Bevan and J. Danbolt, “Capital Structure and Its Determinants in the UK: A Decompositional Analysis,” Applied Financial Economics, Vol. 12, No. 3, 2002, pp. 159- 170. http://dx.doi.org/10.1080/09603100110090073
- A. Ozkan, “Determinants of Capital Structure and Adjustment to Long Run Target: Evidence from UK Company Panel Data,” Journal of Business Finance and Accounting, Vol. 28, No. 1-2, 2001, pp. 175-198. http://dx.doi.org/10.1111/1468-5957.00370
- M. Bennet and R. Donnelly, “The Determinants of Capital Structure: Some UK Evidence,” British Accounting Review, Vol. 25, No. 1, 1993, pp. 43-59. http://dx.doi.org/10.1006/bare.1993.1005
- A. Miguel and J. Pindado, “Determinants of Capital Structure: New Evidence from Spanish Panel Data,” Journal of Corporate Finance, Vol. 7, No. 1, 2001, pp. 77-99. http://dx.doi.org/10.1016/S0929-1199(00)00020-1
- J. Bartholdy and C. Mateus, “Debt and Taxes for Private Firms,” International Review of Financial Analysis, Vol. 20, No. 3, 2011, pp. 177-189. http://dx.doi.org/10.1016/j.irfa.2011.02.012
- R R. ajan and L. Zingales, “What Do We Know about Capital Structure? Some Evidence from International Data,” The Journal of Finance, Vol. 50, No. 5, 1995, pp. 1421-1460. http://dx.doi.org/10.1111/j.1540-6261.1995.tb05184.x
- J. Wald, “How Firm Characteristics Affect Capital Structure: An International Comparison,” Journal of Financial Research, Vol. 22, 1999, pp. 161-187.
- L. Both, V. Aivazian, A. Demirguc-Kunt and V. Maksimovic, “Capital Structures in Developing Countries,” The Journal of Finance, Vol. 56, No. 1, 2001, pp. 87-130. http://dx.doi.org/10.1111/0022-1082.00320
- R. Aggarwal and S. Jamdee, “Determinants of Capital Structure: Evidence from the G-7 Countries,” Working Paper, 2003.
- P. Gaud, M. Hoesli and A. Bender, “Debt-Equity Choice in Europe,” Fame Research Paper Series, 2005, p. 152.
- A. De Jong, R. Kabir and T. Nguyen, “Capital Structure around the World: The Roles of Firmand Country-Specific Determinants,” Journal of Banking and Finance, Vol. 32, No. 9, 2008, pp. 1954-1969. http://dx.doi.org/10.1016/j.jbankfin.2007.12.034
- A. Antoniou, Y. Guney and K. Paudyal, “The Determinants of Capital Structure: Capital Market-Oriented versus Bank-Oriented Institutions,” Journal of Financial and Quantitative Analysis, Vol. 43, No. 1, 2008, pp. 59-92. http://dx.doi.org/10.1017/S0022109000002751
- J. Fan, S. Titman and G. Twite, “An International Comparison of Capital Structures of Debt and Maturity Choices,” Journal of Financial and Quantitative Analysis, Vol. 47, No. 1, 2012, pp. 23-56. http://dx.doi.org/10.1017/S0022109011000597
- K. Mitchell, “The Call, Sinking Fund and Term-To-Maturity Features of Corporate Bonds: An Empirical Investigation,” Journal of Financial and Quantitative Analysis, Vol. 26, No. 2, 1991, pp. 201-222. http://dx.doi.org/10.2307/2331265
- J. Morris, “Factors Affecting the Maturity Structure of Corporate Debt,” Working Paper, University of Colorado, Denver, 1992.
- J. C. Easterwood and P. R. Kadapakkam, “Agency Conflicts, Issue Costs and Debt Maturity,” Quarterly Journal of Business and Economics, Vol. 33, No. 3, 1994, pp. 69- 80.
- M. J. Barclay and C. W. Smith Jr., “The Maturity Structure of Corporate Debt,” Journal of Finance, Vol. 50, No. 2, 1995, pp. 609-631. http://dx.doi.org/10.1111/j.1540-6261.1995.tb04797.x
- M. J. Barclay and C. W. Smith Jr., “On Financial Architecture: Leverage, Maturity and Priority,” Journal of Applied Corporate Finance, Vol. 8, No. 1, 1996, pp. 4-17. http://dx.doi.org/10.1111/j.1745-6622.1996.tb00679.x
- M. Stohs and D. Mauer, “The Determinants of Corporate Debt Maturity Structure,” Journal of Business, Vol. 69, No. 3, 1996, pp. 279-312. http://dx.doi.org/10.1086/209692
- S. A. Johnson, “An Empirical Analysis of the Determination of Corporate Debt Ownership Structure,” Journal of Financial and Quantitative Analysis, Vol. 32, No. 1, 1997, pp. 47-69. http://dx.doi.org/10.2307/2331316
- F. Scherr and H. Hulburt, “The Debt Maturity Structure of Small Firms,” Financial Management, Vol. 30, No. 1, 2001, pp. 85-111. http://dx.doi.org/10.2307/3666392
- E. Lyandres and A. Zhdanov, “Underinvestment or OverInvestment? The Effect of Debt Maturity on Investment,” William E. Simon Graduate School of Business Administration Working Paper, 2003.
- K. Mitchell, “The Debt Maturity Choice: An Empirical Investigation,” Journal of Financial Research, Vol. 16, No. 4, 1993, pp. 309-320.
- J. Guedes and T. Opler, “The Determinants of the Maturity of Corporate Debt Issues,” Journal of Finance, Vol. 51, No. 1, 1996, pp. 1809-1833. http://dx.doi.org/10.1111/j.1540-6261.1996.tb05227.x
- M. Baker, R. Greenwood and J. Wurgler, “The Maturity of Debt Issues and Predictable Variation in Bomd Returns,” Harvard Business School Working Paper, 2002.
- F. Schiantarelli and A. Sembenelli, “The Maturity Structure of Debt: Determinants and Effects on Firms’ Performance,” World Bank Policy Research Working Paper, 1997.
- D. Heyman, M. Deloof and H. Ooghe, “The Debt Maturity Structure of Small Firms in a Creditor Oriented Environment,” Universiteit Gent Working Paper, 2003.
- A. Antoniou, Y. Guney and K. Paudyal, “The Determinants of Debt Maturity Structure: Evidence from France, Germany and the UK,” European Financial Management, Vol. 12, No. 2, 2006, pp. 161-194. http://dx.doi.org/10.1111/j.1354-7798.2006.00315.x
- A. Demirguc-Kunt and V. Maksimovic, “Institutions, Financial Markets and Firm Debt Maturity,” Journal of Financial Economics, Vol. 54, No. 3, 1999, pp. 295-336. http://dx.doi.org/10.1016/S0304-405X(99)00039-2
- M. J. Barclay, L. M. Marx and C. W. Smith Jr., “The Joint Determination of Leverage and Maturity,” Journal of Corporate Finance, Vol. 9, No. 2, 2003, pp. 149-167. http://dx.doi.org/10.1016/S0929-1199(02)00003-2
- W. Glade and R. Corona, “Bigger Economies, Smaller governments: Privatization in Latin America,” Westview Press, Boulder, 1996.
- L. Manzetti, “Regulatory Policy in Latin America: PostPrivatization Realities,” Lynne Rienner Publishers, Boulder, 2000.
- R. Frydman, A. Rapczynski and J. Earle, “The Privatization process in Central America,” Central European University Press, Budapest, 1993.
- T. Boeri and G. Perasso, “Privatisation and Corporate Governance: Some Lessons from the Experience of Transitional Economies,” In: M. Balling, E. Hennessy and R. O’Brien, Eds., Corporate Governance, Financial Markets and Global Convergence, Kluwer Academic Press, Alphen aan den Rijn, 1998, pp. 77-86. http://dx.doi.org/10.1007/978-1-4757-2633-6_4
- T. W. Anderson and C. Hsiao, “Estimation of dynamic models with error components,” Journal of the American Statistical Association, Vol. 76, No. 375, 1981, pp. 598- 606. http://dx.doi.org/10.1080/01621459.1981.10477691
- L. P. Hansen, “Large sample properties of generalized method of moments estimators,” Econometrica, Vol. 50, No. 4, 1982, pp. 1029-1054. http://dx.doi.org/10.2307/1912775
- M. Arellano and S. R. Bond, “Some tests of specification for panel data: Monte Carlo evidence and an application to employment equations,” Review of Economic Studies, Vol. 58, No. 2, 1991, pp. 277-297. http://dx.doi.org/10.2307/2297968
- B. H. Baltagi, “Econometric Analysis of Panel Data,” John Wiley & Sons, Hoboken, 1995.
- H. White, “A Heteroskedasticity-Consistent Covariance Matrix Estimator and a Direct Test for Heteroskedasticity,” Econometrica, Vol. 48, No. 4, 1980, pp. 817-838. http://dx.doi.org/10.2307/1912934
- E. Leamer, “Sensitivity Analyses Would Help,” The American Economic Review, Vol. 75, No. 3, 1985, pp. 308-313.
NOTES
1These indicators are collected from World Bank’s World Development Indicators and World Bank’s Financial Structure Database.
2Chile has been an exception with a growth rate of more than 5 percent a year over the sample period.
3In order to reduce the survival bias, firms are allowed to leave and enter the dataset over time. The final sample is an unbalanced panel.
4We choose book values instead of market values because the reliability of market based figures for emerging markets for the studied time period is questionable (in particular with respect to debt valuation), due secondary markets are thin, trade is often infrequent and data availability is difficult.
5Nevertheless book values are chosen in this study, we use a market based variable in this case since stock markets in Latin America are much more liquid than debt markets. Therefore, the use of the market-to-book ratio here seems reasonable.
6The majority of Eastern European firms in our sample did not have stock market data available in the database used (Amadeus by Bureau Van Dijk) therefore we choose this variable with an alternative measure.
7The more correct way to measure the effect of taxes on maturity structure would be calculating the Miller Tax Term, i.e.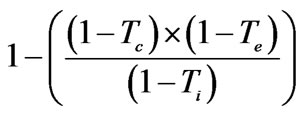 , where Tc is the corporate tax rate, Ti is the personal tax rate and Te is the tax rate on equity income. However, obtaining reliable tax rates over several years for seven different countries can prove difficult. In this study, we choose the average effective tax rate as a substitute, following [18].
8In order to account for such cases in the Business Risk variable and others, in the data analyses that follows we take appropriate remedial measures.
9Since the correlations are generally low in our sample, there are no multicollinearity problems among the independent variables.
10Firms are classified in one of the following 19 sectors, according to their primary NAICS (Latin America) or NACE (Eastern Europe) codes: Agriculture, Chemical, Construction, Electricity, Electronic, Food and Beverages, Gas and Oil, Machinery, Manufacturing, Mining, Pulp and Paper, Retailing and Wholesaling, Services, Software, Steel, Telecommunications, Textile, Transport and Logistics, and Vehicles and Parts.
11See [45-48] for further discussion.
12One important issue when estimating via GMM is to make sure that the instrument set is adequate. We report in Tables 7 and 8 the Sargan’s test statistic for the null hypothesis that moment restrictions are orthogonal.