Open Journal of Animal Sciences
Vol.3 No.2(2013), Article ID:29915,7 pages DOI:10.4236/ojas.2013.32017
Short communication: Supplementing with vitamin E may alter the fibrinolytic capacity of cattle
![]()
1Department of Animal Sciences, Oregon State University, Corvallis, USA; *Corresponding Author: alfred.r.menino@oregonstate.edu
2USDA, Agricultural Research Service U.S. Meat Animal Research Center, Reproduction Research Unit, Clay Center, USA
Copyright © 2013 Anthony K. McNeel, Alfred R. Menino Jr. This is an open access article distributed under the Creative Commons Attribution License, which permits unrestricted use, distribution, and reproduction in any medium, provided the original work is properly cited.
Received 12 January 2013; revised 23 February 2013; accepted 28 March 2013
Keywords: Bovine; Cystic Ovarian Disease; Retained Placenta; Fibrinolysis
ABSTRACT
Vitamin E supplementation has been reported to decrease the incidence of cystic ovarian disease (COD) and retained placenta (RP) in cattle however the mechanism of action is not known. In humans, vitamin E supplementation twofold the daily requirements decreases plasma plasminogen activator inhibitor-1 (PAI-1) activity. As proteolysis may be involved in both COD and RP, vitamin E may be reducing these disorders in cattle through its effects on PAI-1. To evaluate the effects of vitamin E on plasma PAI-1 activity in cattle, six non-lactating beef cows (n = 3 per treatment) were injected with 0 (Control) or 2750 IU of vitamin E (Vitamin E) IM once every four days for 24 days (Day 0 = first day of treatment). Blood samples were collected every two days for 28 days starting on Day 0 and plasma PAI-1 and tissue-type plasminogen activator (tPA) concentrations and activities were determined. No differences (P > 0.05) were observed due to vitamin E supplementation in plasma PAI-1 and tPA concentrations and activities or concentrations and activities adjusted relative to the Day 0 value for each cow. Day of treatment was a significant effect in all tPA measurements. The ratio of adjusted PAI-1 to tPA concentrations did not differ (P > 0.05) due to vitamin E supplementation however the ratio of PAI-1 to tPA activity tended to be greater (P = 0.097) in Control compared to Vitamin E cows (1.0 ± 0.1 and 0.7 ± 0.1, respectively). These data suggest vitamin E supplementation may contribute to the reduced incidence of COD and RP in cattle by shifting the ratio of plasma PAI-1 to tPA activity to a state favoring proteolysis.
1. INTRODUCTION
Vitamin E or α-tocopherol is a common dietary supplement for cattle and several investigators have observed a reduced incidence of both cystic ovarian disease (COD) [1] and retained placenta (RP) [2] when more than the minimum daily requirements are provided. Both COD and RP are reproductive diseases particularly prominent in lactating dairy cattle. Cystic ovarian disease is defined as a follicle at least 2.5 cm in diameter which persists for at least 10 days [3]. The pathogenesis of COD has been an area of significant research during the last 30 years with multiple pathologies proposed [4,5]. Polycystic ovarian syndrome (PCOS) in women is phenotypically similar to COD and is associated with elevated plasma plasminogen activator inhibitor-1 (PAI-1) concentrations and activities [6,7]. Plasminogen activator inhibitor-1 is the principal inhibitor of tissue-type plasminogen activator (tPA) and both have primary roles in fibrinolysis [8]. The PA system is also an integral component of the proteolytic cascade in ovulation, directly through the production of plasmin, and indirectly through plasmin activation of matrix metalloproteases (MMP) [9]. Inhibition of PA activity by elevated PAI-1 may interrupt this cascade and lead to ovulatory dysfunction.
Plasma vitamin E concentrations are associated with a decreased incidence of RP as an increase of 1 µg/ml oneweek pre-partum reduced the risk of RP by 20% [10]. Bovine placentomes express both MMP-2 and -9 during the third phase of parturition [11] and placentomes from cows with RP have reduced MMP expression and activity compared to normal placentomes [12]. As PA indirectly activate MMP through the production of plasmin, a reduction in PAI-1 would favor plasmin production, subsequent MMP activation and overall proteolysis at the cotyledonary-caruncular interface. In humans, dietary supplementation with vitamin E twofold the daily requirements significantly reduced plasma PAI-1 concentrations [13]. Given evidence vitamin E reducing the incidence of COD and RP in cattle and plasma PAI-1 in humans, the objective of this preliminary study was to evaluate the effects of vitamin E supplementation on plasma PAI-1 and tPA concentrations and activities in non-lactating beef cattle.
2. MATERIALS AND METHODS
2.1. Animals
Six cross-bred beef cows were housed in the same pen at the Oregon State University Beef Center. Cows were provided access to same grass hay and water ad libitum four weeks prior to and during the course of the experiment. Cows were allocated into one of two groups (Control and Vitamin E; n = 3 per group) and were sorted among treatments by age with each group having a mean age of 5.3 years. All experiments were performed in accordance with the Oregon State University Institutional Animal Care and Use Committee.
2.2. Vitamin E Supplementation
Animals in the Vitamin E group received 2750 IU (2.75 × the recommended minimum dose) of vitamin E (dl-α-tocopherol) in an injectable solution IM (ROCAVIT E, Hoffman-LAROCHE, Nutley, NJ) once every four days for 24 days beginning on Day 0 (Day 0 = day of first injection). Likewise, Control animals received an equal volume of the vehicle in ROCAVIT E, identical to the solution used to suspend the vitamin E (20% ethanol, 1% benzyl alcohol and 79% sterile-DPBS, v:v).
2.3. Blood Collection
Blood samples were collected via jugular or coccygeal venipuncture every two days for 28 days starting on Day 0 (total of 15 blood draws per cow) using 10 ml Vacutainer (Becton, Dickinson and Company, Franklin Lakes, NJ) blood collection tubes containing 100 µl of 0.5 M EDTA, pH 8.0 as the anti-coagulant. Samples were transported back to the laboratory within 1 h of collection. Plasma was separated from whole blood by centrifugation at 2500 × g for 15 min. Aliquots of plasma were aspirated from the top half of the plasma column and samples were stored at −20˚C in 0.5 ml microcentrifuge tubes until analysis.
2.4. Assays
2.4.1. Plasminogen Activator Inhibitor-1 Concentration
Plasma PAI-1 concentrations were quantified using the IMUCLONE® Rat PAI-1 ELISA (American Diagnostica Inc., Stamford, CT). Briefly, 100 µl of standard or unknown were incubated in duplicate with 100 µl of anti-rat PAI-1 horseradish peroxidase conjugate for two h at RT in the provided microwells. After the initial incubation, microwells were washed five times with 300 µl of wash solution. Two hundred microliters of 3, 3’, 5, 5’ tetramethylbenzidine (TMB) solution were added and the microwells were incubated for 5 min at RT. The reaction was stopped with the addition of 50 µl of 0.45 M H2SO4 to each microwell. Microwells were incubated for 10 min at RT to facilitate color stabilization and absorbance at 450 nm was measured on a microplate reader (Benchmark Microplate Reader, Bio-Rad Laboratories Inc., Hercules, CA). Plasminogen activator inhibitor-1 concentrations were determined from equation of the line calculations. Intraand inter-assay coefficients of variation were 8.1% and 7.6%, respectively.
2.4.2. Plasminogen Activator Inhibitor-1 Activity
Plasminogen activator inhibitor-1 activity in bovine plasma was quantified using Spectrolyse® (pL) PAI-1 (American Diagnostica Inc.) with some modifications. Briefly, 25 µl of plasma were incubated with 25 µl of 40 IU/ml TPA solution in a 1.5 ml microcentrifuge tube for 15 min in a 25˚C water bath to quench α2-antiplasmin activity. Following incubation, 50 µl of acetate buffer were added to the microcentrifuge tube and incubated for 20 min in a 39˚C water bath. At the end of this incubation, 1 ml of distilled water was added to the tube and mixed. Twenty microliters of diluted standard or plasma were aliquoted to individual microwells in duplicate. To each microwell, 200 µl of ice cold Plasminogen Activator Reagent was added and the microtiter plate was covered and incubated for 90 min at 39˚C. The reaction was stopped using 50 µl of provided Stop Reagent and absorbance at 405 nm was measured on a microplate reader within 30 min. Activity of PAI-1 was determined according to manufacturer’s instructions. Intraand interassay coefficients of variation were 2.5% and 7.5%, respectively.
2.4.3. Tissue-Type PA Concentration
Plasma tPA concentrations were measured in duplicate using the IMUBIND® tPA ELISA (American Diagnostica Inc.). Briefly, 50 µl of the reconstituted supplied PBSEDTA-TWEEN 20 (PET) buffer were added to each of the provided microwells with 20 µl of either standards or plasma. The 96-well plate was covered with an acetate sheet and agitated on a plate shaker at 500 - 600 rpm at RT for 1 h. The acetate sheet was removed and 50 µl of the detection antibody conjugate solution were added to each well. The acetate sheet was replaced and the plate was agitated for an additional 15 min at 500 - 600 rpm at RT. Microwells were emptied and washed with 300 µl of PET buffer four times. After the last wash, 100 µl of chromogenic substrate were added to each microwell, the plate was again covered with the acetate sheet and agitated on a plate shaker for 15 min at 500 - 600 rpm at RT. The reaction was stopped by the addition of 50 µl of Stop solution (1.5 M H2SO4) to each microwell and the plate was allowed to stabilize for 10 min in the dark at RT. Absorbance at 490 nm was measured within 30 min of adding the stop solution using a microplate reader. Concentrations of tPA were determined using equation of the line calculations. Intraand inter-assay coefficients of variation were 5.5% and 9.5%, respectively.
2.4.4. Tissue-Type PA Activity
Plasma tPA activity was quantified using a chromogenic assay. Ten microliters of tPA standards or plasma, 90 µl of 1 × Tris-Imidazole buffer (0.003 M Tris, 0.003 M imidazole, 0.023 M NaCl, pH 8.0) and 10 µl of 5 nmol/ml SPECTROZYME® (American Diagnostica Inc.), a tPA specific chromogenic substrate, were aliquoted into a 96-well microtiter plate, covered and incubated at 39˚C for 2 h. Plasma samples incubated with chromogenic substrate were designated as CH. An additional replicate was prepared for plasma samples where the SPECTROZYME® reagent was replaced with 10 µl of the Tris-Imidazole buffer and designated as NC. Absorbance was measured at 405 nm on a microplate reader. For plasma samples, the NC absorbance was subtracted from the CH absorbance. For the standards, the absorbance for 0 IU/mL was subtracted from all standards before activeties were determined by equation of the line calculations. Intraand inter-assay coefficients of variation were 1.2% and 11.8%, respectively.
2.5. Statistical Analysis
Plasma PAI-1 and tPA concentrations and activities and the ratios of plasma PAI-1 to tPA concentrations and activities were analyzed by repeated measures ANOVA where vitamin E supplementation, day of blood collection and the vitamin E supplementation × day of blood collection interaction were the main effects. Differences between means were determined using Duncan’s multiple comparison’s test if significant differences were observed in the ANOVA. All analyses were performed using the Number Cruncher Statistical System software program [14].
3. RESULTS
Plasma PAI-1 antigen concentrations were similar (P > 0.05) between Control and Vitamin E cows (4.0 and 7.4 ng/ml, respectively; pooled s.e. = 4.9 ng/ml). Neither day of collection nor the vitamin E × day of collection interaction was a significant source of variation in plasma PAI-1 concentrations.
Plasma PAI-1 activities also did not differ (P > 0.05) between Control and Vitamin E cows (18.9 and 21.2 IU/ml, respectively; pooled s.e. = 1.5 IU/ml). Day of collection and the interaction between vitamin E × day of collection were not significant sources of variation in plasma PAI-1 activity.
No difference (P > 0.05) was observed in plasma tPA concentrations between Control and Vitamin E cows (1.0 and 0.5 ng/ml, respectively; pooled s.e. = 0.4 ng/ml). Plasma tPA concentrations differed (P < 0.01) by day of collection where concentrations were lower on Days 0, 2, 6, 8, 10, 12 and 28 compared to Days 14, 16, 20 and 22 (Figure 1). The interaction was not significant.
Similar to plasma tPA concentrations, no difference (P > 0.05) was observed in plasma tPA activities between Control and Vitamin E cows (70.6 and 71.7 IU/ml, respectively; pooled s.e. = 3.5 IU/ml). Plasma tPA activity differed (P < 0.01) by day of collection where activities were lower on Day 0 compared to Days 6, 18, 20 and Day 4 compared to Day 18 (Figure 2). The interaction was not significant.
Plasma concentrations and activities of PAI-1 and tPA varied significantly between cows. To reduce this variation, all data were subsequently expressed relative to the Day 0 measurement (adjusted) for each cow and re-analyzed. Neither adjusted PAI-1 concentrations nor activeties differed (P > 0.05) due to vitamin E supplementation (Table 1). Day of collection and the interaction were not sources of variation for either adjusted PAI-1 concentrations or activities.
Adjusted tPA concentrations also did not differ (P > 0.05) due to vitamin E supplementation (Table 1). Although adjusted tPA activity was 1.7-fold greater in Vitamin E compared to Control cows, no difference (P > 0.05) was observed (Table 1). However, day of collection exerted significant effects on both adjusted tPA concentrations and activities. Adjusted tPA concentrations were lower (P < 0.05) on Days 0, 2, 4, 6, 8, 10, 12 and 28 compared to Days 14, 16, 18, 20 and 22 (Figure 3) and adjusted tPA activity was lower (P < 0.05) on Day 0 compared to Day 18 (Figure 4). Neither interaction was significant for adjusted tPA concentrations or activities.
Vitamin E supplementation and the interaction were not significant sources of variation in the ratios of adjusted PAI-1 to tPA concentrations (Table 2). Adjusted
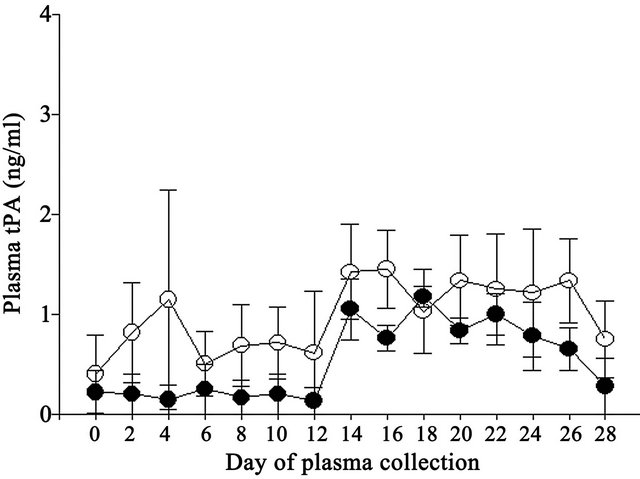
Figure 1. Effect of vitamin E on plasma tPA concentrations in Control (open circles) and Vitamin E (closed circles) cows.
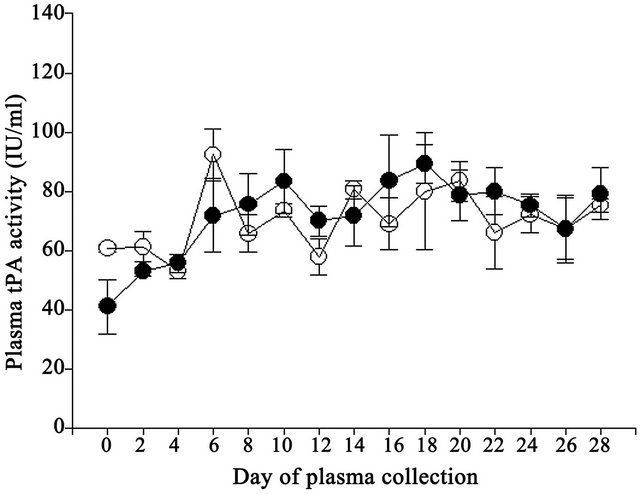
Figure 2. Effect of vitamin E on plasma tPA activities in Control (open circles) and Vitamin E (closed circles) cows.
Table 1. Effect of vitamin E on mean plasma plasminogen activator inhibitor-1 (PAI-1) and tissue-type plasminogen activator (tPA) concentrations and activities adjusted to day 0 in non-lactating cows.
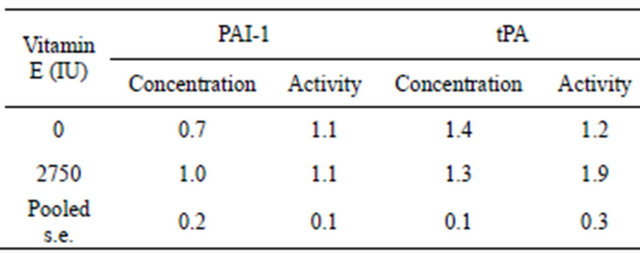
Statistical analysis was performed using repeated measures ANOVA with vitamin E supplementation, day of blood collection and the vitamin E supplementation × day of blood collection interaction as the main effects; n = 45 per treatment group.
PAI-1 to tPA concentration ratios differed by day of collection where ratios were greater (P < 0.05) on Days 2 and 10 compared to Days 18, 22, 26 (data not shown). However, there was a tendency for the ratio of adjusted
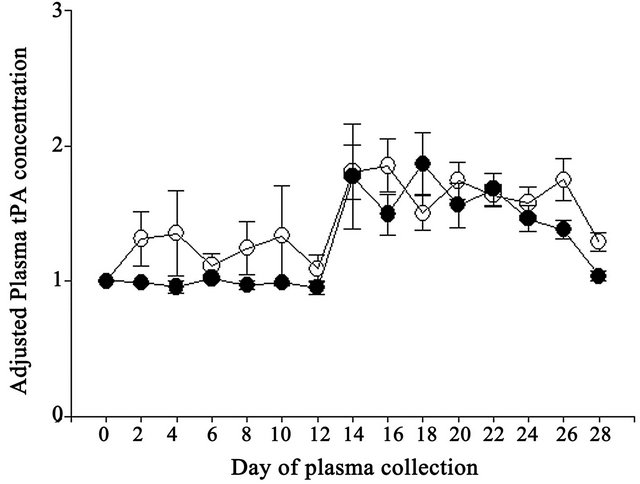
Figure 3. Effect of vitamin E on adjusted plasma tPA concentrations expressed relative to the day 0 measurement in the experimental period in Control (open circles) and Vitamin E (closed circles) cows.
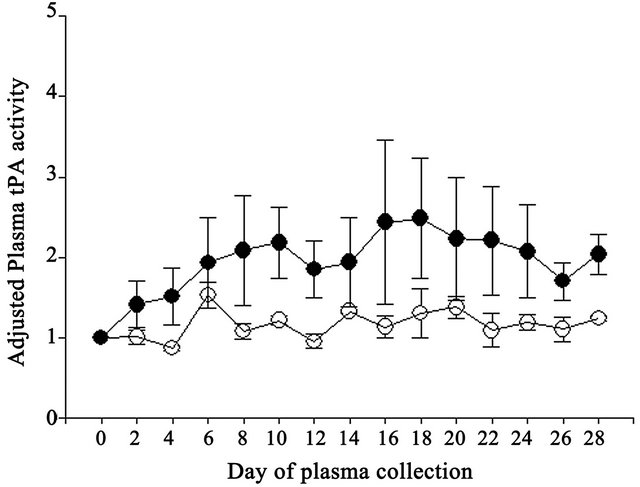
Figure 4. Effect of vitamin E on adjusted plasma tPA activities expressed relative to the day 0 measurement in the experimental period in Control (open circles) and Vitamin E (closed circles) cows.
Table 2. Effect of vitamin E on mean adjusted ratios of plasma plasminogen activator inhibitor (PAI-1) to tissue-type plasminogen activator (tPA) concentrations and activities in non-lactating cows.
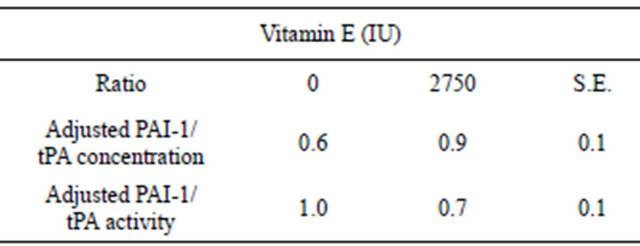
Statistical analysis was performed using repeated measures ANOVA with vitamin E supplementation, day of blood collection and the vitamin E supplementation × day of blood collection interaction as the main effects; n = 45 per treatment group.
PAI-1 to tPA activity to be greater (P = 0.097) in Control compared to Vitamin E cows (Table 2). Neither day of collection nor the interaction was a significant source of variation for the ratios of adjusted PAI-1 to tPA activities (Figure 5).
4. DISCUSSION
Supplementing cows with vitamin E at a comparabledose and treatment regimen similar to what reduced PAI-1 in humans [13] failed to alter plasma PAI concentration and activity. Nothing is known of the interaction of vitamin E with the fibrinolytic pathway in cattle and this is the first study of its kind to investigate this relationship. Although plasma PAI-1 and tPA concentrations and activities did not differ, there was a tendency (P = 0.097) for vitamin E to shift the adjusted ratio of PAI-1:tPA activity to a pro-fibrinolytic state. The reduction in adjusted PAI-1 to tPA activity is probably due to the greater adjusted tPA activity, albeit not statistically different, observed in cows receiving vitamin E. However, because the ratio of adjusted PAI-1 to tPA concentration did not differ due to vitamin E supplementation this suggests PAI-1 and tPA protein levels did not change but tPA activity was increased. One potential mechanism for vitamin E to increase plasma tPA activity would be through suppressing other inhibitors of tPA, such as PAI-2 or protein C inhibitor (PCI), of which the latter was known as PAI-3 [15]. Vitamin E has been shown to reduce PAI-1 in humans and can modulate gene expression of some MMP and their inhibitors, however no effects have been reported for tPA, PAI-2 or PCI [13]. Alternatively, and maybe more likely, the antioxidant effect of vitamin E may reduce peroxynitrate (OONO−) formation by scavenging superoxide anion thereby increasing tPA activity while not affecting expression [16]. Peroxynitrates are the products of nitric oxide (NO) and superoxide anion and cause tyrosine nitration in proteins
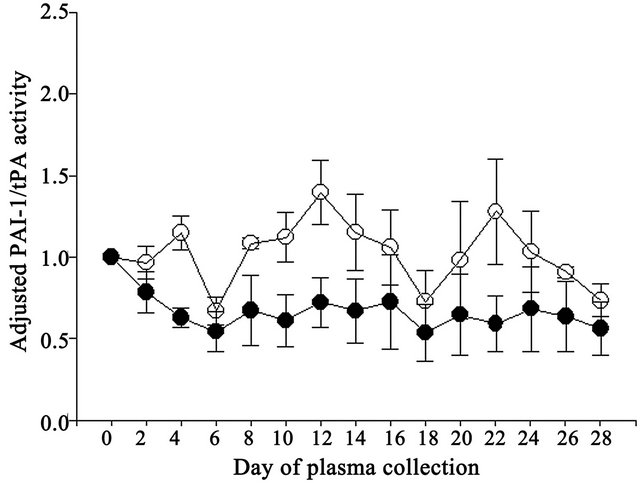
Figure 5. Effect of vitamin E on ratio of adjusted PAI-1 to tPA activities in Control (open circles) and Vitamin E cows (closed circles).
to form nitrotyrosines. Nitrotyrosine formation is correlated with decreased enzyme activities in both tPA and plasmin [16,17]. Although Vitamin E has been shown to increase NO synthesis, Nielsen and coworkers [16] observed no effect of NO alone on tPA function and nitrotyrosine content. Hence, in the cow, the effect of vitamin E on the fibrinolytic system may be targeted through tPA rather than PAI-1 as had been observed in humans [13].
Plasma PAI-1 and tPA concentrations and activities were subject to substantial between animal variation which may have contributed to the lack of significant differences observed between Control and Vitamin E groups. Perhaps an increase in animal numbers in each of the groups may have reduced the variation encountered and rendered greater statistical significance among the measured parameters. Genetic differences between individuals, as in single nucleotide polymorphisms in the PAI-1 gene, have been identified as having an effect on PAI-1 expression and plasma concentrations in humans [18]. The increase in tPA concentration and activity observed approximately midway through the experiment may indicate increased vascular expression due to stress resulting from the repeated blood collections. Plasma tPA is subject to various stressors where psychological and surgical stresses can increase circulating tPA within minutes [19].
The effects of vitamin E supplementation on reproduction in cattle is subject to some inconsistency which is likely due to pre-supplementation differences in plasma vitamin E concentrations in individual animals [10]. Vitamin E content of grass hay is quickly degraded [20] and cows fed grass hay are known to have low vitamin E concentrations [21]. This could be particularly deleterious for dairy cattle in confined feeding operations as plasma vitamin E concentration drops precipitously two weeks prior to parturition, most likely due to reduced feed intake, and increases at four weeks of lactation [22]. How vitamin E decreases the incidence of COD [1] and RP [2,23] is currently unknown. Vitamin E supplementation appears to modulate fibrinolytic capacity through the NO pathway. Vitamin E supplementation alone decreased PAI-1 concentrations and increased NO synthesis in humans with type 2 diabetes [24]. Nitric oxide is a known inhibitor of PAI-1 release from platelets [25] and has also been demonstrated to modulate epinephrine stimulated tPA release in hypertensive and normotensive humans [26]. Plasminogen activator inhibitor-1 inhibits both tPA and urokinase-type plasminogen activator (uPA) by covalently binding in 1:1 stoichiometry [8], thereby limiting conversion of plasminogen to the active protease plasmin. Mice genetically engineered to over-express PAI-1 display ovaries phenotypically similar to PCOS [27]. In COD, the ovulation cascade is dysfunctional whereby a preovulatory follicle persists and enlarges for an undefined period of time. As PAI-1 is the principal inhibitor of tPA, a decrease in the PAI-1 to tPA ratio in the follicle due to vitamin E supplementation may be beneficial in preventing COD by shifting these enzymatic systems towards proteolysis.
Le Blanc and coworkers [10] have shown that an increase of 1 µg/ml in plasma vitamin E one week prepartum reduces the risk of RP by 20%. Vitamin E supplementation may be reducing the incidence of RP directly through the actions of NO because extravillous trophoblasts isolated from term human placenta express endothelial NO synthase (NOS) [28]. Nitric oxide regulates MMP-9 expression [29] and increases MMP expression and activity in human trophoblasts in vitro [30]. Inhibition of NOS reduces expression of MMP-9 [31]. Bovine placentomes express both MMP-2 and -9 during the third phase of parturition [11,12]. Placentomes from cows with RP have more collagen [32] and reduced MMP expression and activity, specifically MMP-2, compared to normal placentomes. As our results suggest vitamin E supplementation shifts the activity of the PA system towards a state favoring plasma proteolysis, the proportion of active MMP would increase via reciprocal activation [9]. While the present study focused on the effects of vitamin E on plasma tPA and PAI-1, further research is needed to elucidate the effects of vitamin E supplementation on the PA and MMP systems at the level of the ovary and periparturient placentome in order to identify the physiologic link between vitamin E, COD and RP.
5. CONCLUSION
There is a tendency for vitamin E to enhance the fibrinolytic profile in non-lactating beef cows by increasing tPA activity. Combined with previous reports, further investigation into the effects of vitamin E on the fibrinolytic capacity of cattle is warranted.
REFERENCES
- Harrison, J.H., Hancock, D.D. and Conrad, H.R. (1984) Vitamin E and selenium for reproduction of the dairy cow. Journal of Dairy Science, 67, 123-132. doi:10.3168/jds.S0022-0302(84)81275-8
- Bourne, N., Laven, R., Wathes, D.C., Martinez, T. and McGowan, M. (2007) A meta-analysis of the effects of vitamin E supplementation on the incidence of retained foetal membranes in dairy cows. Theriogenology, 67, 494-501. doi:10.1016/j.theriogenology.2006.08.015
- Peter, A.T., Levine, H., Drost, M. and Bergfelt, D.R. (2009) Compilation of classical and contemporary terminology used to describe morphological aspects of ovarian dynamics in cattle. Theriogenology, 71, 1343-1357. doi:10.1016/j.theriogenology.2008.12.026
- Gümen, A. and Wiltbank, M.C. (2002) An alteration in the hypothalamic action of estradiol due to lack of progesterone exposure can cause follicular cysts in cattle. Biology of Reproduction, 66, 1689-1695. doi:10.1095/biolreprod66.6.1689
- Robinson, R.S., Hunter, M.G. and Mann, G.E. (2006) Supra-basal progesterone concentrations during the follicular phase are associated with development of cystic follicles in dairy cows. Veterinary Journal, 172, 340-346. doi:10.1016/j.tvjl.2005.04.004
- Oral, B., Mermi, B., Dilek, M., Alanoglu, G. and Sütçü, R. (2009) Thrombin activatable fibrinolysis inhibitor and other hemostatic parameters in patients with polycystic ovary syndrome. Gynecological Endocrinology, 25, 110- 116. doi:10.1080/09513590802549874
- Tarkun, I., Cantürk, Z., Arslan, B.C., Türemen, E. and Tarkun, P. (2004) The plasminogen activator system in young and lean women with polycystic ovary syndrome. Endocrine Journal, 51, 467-472. doi:10.1507/endocrj.51.467
- Olson, S.T., Swanson, R., Day, D., Verhamme, I., Kvassman, J. and Shore, J.D. (2001) Resolution of Michaelis complex, acylation, and conformational change steps in the reactions of the serpin, plasminogen activator inhibitor-1, with tissue plasminogen activator and trypsin. Biochemistry, 40, 11742-11756. doi:10.1021/bi0107290
- Ny, T., Wahlberg, P. and Brändström, I.J. (2002) Matrix remodeling in the ovary: Regulation and functional role of the plasminogen activator and matrix metalloproteinase systems. Molecular and Cellular Endocrinology, 187, 29-38. doi:10.1016/S0303-7207(01)00711-0
- LeBlanc, S.J., Herdt, T.H., Seymour, W.M., Duffield, T.F. and Leslie, K.E. (2004) Peripartum serum vitamin E, retinol, and beta-carotene in dairy cattle and their associations with disease. Journal of Dairy Science, 87, 609-619. doi:10.3168/jds.S0022-0302(04)73203-8
- Walter, I. and Boos, A. (2001) Matrix metalloproteinases (MMP-2 and MMP-9) and tissue inhibitor-2 of matrix metalloproteinases (TIMP-2) in the placenta and interplacental uterine wall in normal cows and in cattle with retention of fetal membranes. Placenta, 22, 473-483. doi:10.1053/plac.2001.0633
- Maj, J.G. and Kankofer, M. (1997) Activity of 72-kDa and 92-kDa matrix metalloproteinases in placental tissues of cows with and without retained fetal membranes. Placenta, 18, 683-687. doi:10.1016/S0143-4004(97)90010-2
- Devaraj, S., Chan Jr., A.V. and Jialal, I. (2002) α-Tocopherol supplementation decreases plasminogen activator inhibitor-1 and P-selectin levels in type 2 diabetic patients. Diabetes Care, 25, 524-529. doi:10.2337/diacare.25.3.524
- Hintze, J. (2000) NCSS 2000. NCSS, LLC, Kaysville.
- Suzuki, K. (2008) The multi-functional serpin, protein C inhibitor: Beyond thrombosis and hemostasis. Journal of Thrombosis and Haemostasis, 6, 2017-2026. doi:10.1111/j.1538-7836.2008.03181.x
- Nielsen, V.G., Crow, J.P., Zhou, F. and Parks, D.A. (2004) Peroxynitrate inactivates tissue plasminogen activator. Anesthesia and Analgesia, 98, 1312-1317. doi:10.1213/01.ANE.0000111105.38836.F6
- Nowak, P., Kolodziejczyk, J. and Wachowicz, B. (2004) Peroxynitrate and fibrinolytic system: The effect of peroxynitrate on plasmin activity. Molecular and Cellular Biochemistry, 267, 141-146. doi:10.1023/B:MCBI.0000049370.23457.10
- Eriksson, P., Kallin, B., van ’t Hooft, F.M., Båvenholm, P. and Hamsten, A. (1995) Allele-specific increase in basal transcription of the plasminogen-activator inhibitor-1 gene is associated with myocardial infarction. Proceedings of National Academies of Sciences USA, 92, 1851- 1855. doi:10.1073/pnas.92.6.1851
- Jern, C., Selin, L. and Jern, S. (1994) In Vivo release of tissue-type plasminogen activator across the human forearm during mental stress. Thrombosis and Haemostasis, 72, 285-291.
- Thafvelin, B. and Oksansen, H.E. (1966) Vitamin E and linolenic acid content of hay as related to different drying conditions. Journal of Dairy Science, 49, 282-286. doi:10.3168/jds.S0022-0302(66)87850-5
- Lynch, G.P. (1983) Changes of tocopherols in blood serum of cows fed hay or silage. Journal of Dairy Science, 66, 1461-1465. doi:10.3168/jds.S0022-0302(83)81960-2
- Calderón, F., Chauveau-Duriot, B., Martin, B., Graulet, B., Doreau, M. and Nozière, P. (2007) Variations in carotenoids, vitamins A and E, and color in cow’s plasma and milk during late pregnancy and the first three months of lactation. Journal of Dairy Science, 90, 2335-2346. doi:10.3168/jds.2006-630
- LeBlanc, S.J., Duffield, T.F., Leslie, K.E., Bateman, K.G., TenHag, J., Walton, J.S. and Johnson, W.H. (2002) The effect of prepartum injection of vitamin E on health in transition dairy cows. Journal of Dairy Science, 85, 1416- 1426. doi:10.3168/jds.S0022-0302(02)74209-4
- Vignini, A., Nanetti, L., Moroni, C., Testa, R., Sirolla, C., Marra, M., Manfrini, S., Fumelli, D., Marcheselli, F., Mazzanti, L. and Rabini, R.A. (2008) A study on the action of vitamin E supplementation on plasminogen activator inhibitor type 1 and platelet nitric oxide production in type 2 diabetic patients. Nutrition Metabolism and Cardiovascular Disease, 18, 15-22. doi:10.1016/j.numecd.2007.01.002
- Korbut, R., Marcinkiewicz, E., Cieslik, K. and Gryglewski, R.J. (1995) The effect of nitric oxide donors on the release of plasminogen activator inhibitor (PAI) from rabbit platelets in vitro. Journal of Physiology and Pharmacology, 46, 37-44.
- Giannarelli, C., De Negri, F., Virdis, A., Ghiadoni, L., Cipriano, A., Magagna, A., Taddei, S. and Salvetti, A. (2007) Nitric oxide modulates tissue plasminogen activator release in normotensive subjects and hypertensive patients. Hypertension, 49, 878-884. doi:10.1161/01.HYP.0000260471.16113.d8
- Devin, J.K., Johnson, J.E., Eren, M., Gleaves, L.A., Bradham, W.S., Bloodworth Jr., J.R. and Vaughan, D.E. (2007) Transgenic overexpression of plasminogen activator inhibitor-1 promotes the development of polycystic ovarian changes in female mice. Journal of Molecular Endocrinology, 39, 9-16. doi:10.1677/JME-06-0057
- Martin, D. and Conrad, K.P. (2000) Expression of endothelial nitric oxide synthase by extravillous trophoblast cells in the human placenta. Placenta, 21, 23-31. doi:10.1053/plac.1999.0428
- Marcet-Palacios, M., Ulanova, M., Duta, F., Puttagunta, L., Munoz, S., Gibbings, D., Radomski, M., Cameron, L., Mayers, I. and Befus, A.D. (2007) The transcription factor Wilms tumor 1 regulates matrix metalloproteinase-9 through a nitric oxide-mediated pathway. Journal of Immunology, 179, 256-265.
- Novaro, V., Colman-Lerner, A., Ortega, F.V., Jawerbaum, A., Paz, D., Lo Nostro, F., Pustovrh, C., Gimeno, M.F. and González, E. (2001) Regulation of metalloproteinases by nitric oxide in human trophoblast cells in culture. Reproduction Fertility and Development, 13, 411-420. doi:10.1071/RD01036
- Zhang, X., Wang, H.M., Lin, H.Y., Liu, G.Y., Li, Q.L. and Zhu, C. (2004) Regulation of matrix metalloproteinases (MMPS) and their inhibitors (TIMPS) during mouse peri-implantation: Role of nitric oxide. Placenta, 25, 243- 252. doi:10.1016/j.placenta.2003.08.014
- Sharpe, K.L., Eiler, H. and Hopkins, F.M. (1990) Changes in the proportion of type I and type III collagen in the developing and retained bovine placentome. Biology of Reproduction, 43, 229-235. doi:10.1095/biolreprod43.2.229