Open Journal of Ecology
Vol.2 No.1(2012), Article ID:17706,10 pages DOI:10.4236/oje.2012.21005
Water quality and water-use conflicts in lake taabo (ivory coast)
![]()
1Laboratoire d’Ecologie et de Biologie Aquatique (LEBA) UFR des Sciences et de Gestion de l’Environnement, Université d’Abobo-Adjamé Abidjan, Abidjan, France; groga7@yahoo.fr
2Université de Toulouse, Toulouse, France
3Centre National de Recherche Agronomique (CNRA) Projet Challenge Programm BP, Abidjan, France
4CNRS, UMR 5245 Laboratoire Ecologie Fonctionnelle et Environnement, Toulouse, France
5Ecosystem Management Research Group-Universiteitsplein, Department of Biology, Campus Drie Eiken, University of Antwerp, Wilrijk, Belgium
6Institut National Polytechique de Toulouse, Université Paul Sabatier, Toulouse, France
7Ecole Nationale Supérieur Agronomique de Toulouse, Toulouse, France; *Corresponding Author: pascal.laffaille@ensat.fr
Received 4 October 2011; revised 15 November 2011; accepted 20 December 2011
Keywords: Conflicts over Water Use; Pollution; Tropical Lake; Lake Structure
ABSTRACT
The Lake Taabo (Ivory Coast, Africa) results of the construction of the Taabo dam on the Bandama River. The changes in the water level of the 69-km² lake depend on 1) the rainfall linked to alternating dry/wet seasons; 2) the extraction of water for human uses; 3) the discharge of water from the upstream dam and the volumes turbined by the Kossou dam; 4) the various anthropic effects (discharge of untreated waste water from towns and industries, and leaching from agricultural land). The average concentrations of nutrients (NH4-N: 1.1 mg/L, NO3-N: 1.62 mg/L, PO4-P: 10 mg/L, SiO2: 15 mg/L) and chlorophyll a (from 4.8 to 16.5 µg/L, average 11.4 µg/L) indicates some degree of eutrophication. The cumulated effects that threaten the ecosystem (degradation of water quality and eutrophication) are such that they are likely to interfere with various water uses. In a context of growing health and environmental concerns in Africa, this study demonstrates conflicts between different uses of this water resource and the urgent need for an appropriate policy including specific monitoring of lake water quality, wastewater control, and a programme to reduce agricultural fertilizers.
1. INTRODUCTION
The conflicts around water are not new. Water is a valuable and essential natural resource, the quantity and quality of which are decisive factors for human and animal health [1]. Lake water is used for human and animal consumption, for fishing, irrigation, transportation, the generation of hydroelectricity, and for a whole range of other domestic, industrial and agricultural uses. Lake ecosystems are not only reserves of fresh water, they can also act as foci around which human activities that can stimulate and support regional economies [2] tend to cluster. However, these activities may not all be mutually compatible. The quality of the surface water is influenced both by natural processes (soil erosion, rainfall, evaporation…) and by human activities (agricultural, urban and industrial waste water) [3]. The exponential growth of human populations, the development of intensive agriculture and increasing industrialisation are the main causes of the deterioration of water quality at all levels. West Africa is currently experiencing a very real problem of the overexploitation of hydrosystems, because urbanisation is concentrating populations beside rivers and lakes. This kind of problem has occurred in the basin of Komaduju river and of Lake N’Guru (Nigeria), Lake Diama (Senegal), and River Lumani (Burkina Faso), where the waste water produced by the major cities and the increasing use of agricultural fertilizers has contributed to a dangerous degradation of water quality, and the spread of waterborne diseases such as onchocerciasis and schistosomiasis [4,5].
The Lake Taabo region (Ivory Coast) is an example of this. This hydro-electric dam located downstream from the Kossou dam is exposed to the impacts of various different anthropic actions, such as the generation of hydroelectricity, the discharge of unprocessed effluents from the surrounding zones, the use of traditional fishing methods, the leaching of agrochemicals… This lake is therefore exposed to severe anthropic pressure leading to weakening of the ecosystem, and disruption of the balance between the various uses of water. In conflicts over water use (Figure 1) it appears that socio-economic drivers, the services expected, and the problems directly linked to water use are both interdependent and contradictory. This study, carried out on Lake Taabo reflects these conflicts over water use in a region currently undergoing rapid development. On the basis of the water quality data measured, this study draws up an inventory of the topics that are leading to problems and the indicator parameters, which constitutes a first step towards finding solutions in the medium term, with regard to development, sustainable management and monitoring of water resources.
2. MATERIAL AND METHODS
2.1. Study Site
Lake Taabo (06˚40' latitude Nord and 5˚ longitude West; Figure 2) is the regulating lake of the Kossou dam. Located downstream from the confluence of the White Bandama and the Marahoué (or Red Bandama), Lake Taabo has a catchment area of 58,700 km2. The lake itself covers an area of ±80 km2, and is generally subjected to a daily fluctuation of the water level of ±3 meters. The population living in the vicinity of the lake is estimated to be about 140,000 inhabitants. With nearly 240 year-round commercial fishermen, the average total annual fish catch is 220 metric tons. Traditional subsistence crops occupy huge areas, notably cocoa (7,741 ha) and coffee (173 ha) beans, with annual productions of 3000 and 121 metric tonnes respectively (data from the
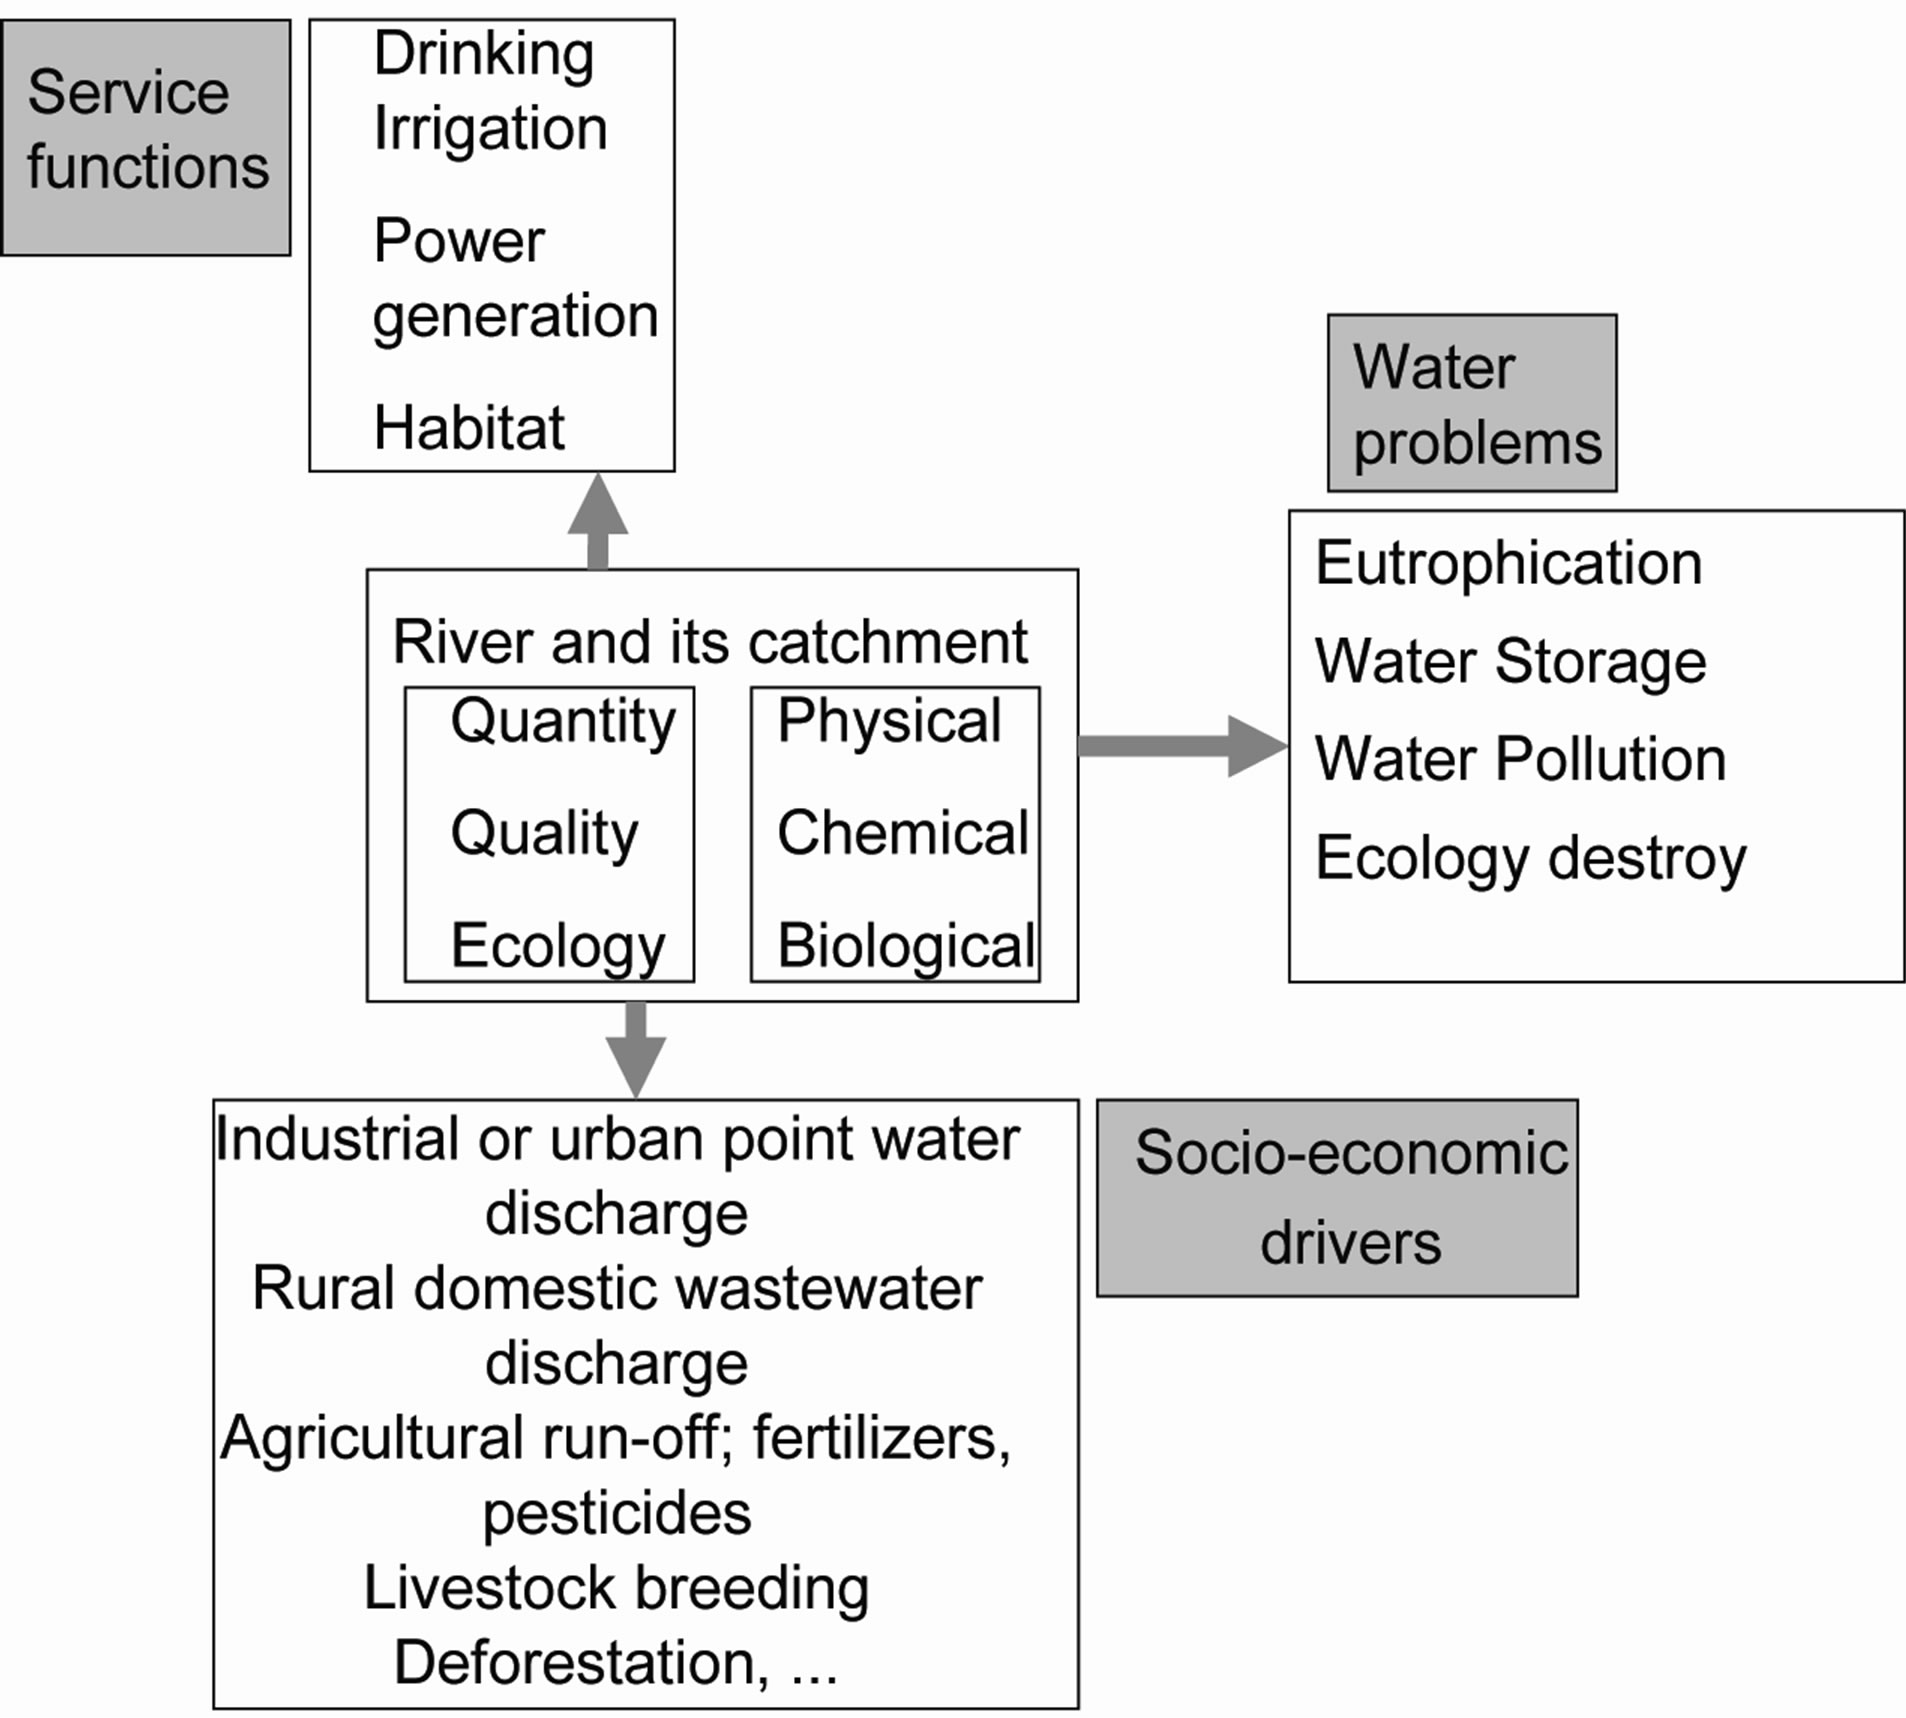
Figure 1. Water usage conflicts are linked to the interdependence of socio-economic drivers, the services expected and problems directly related to water quality.
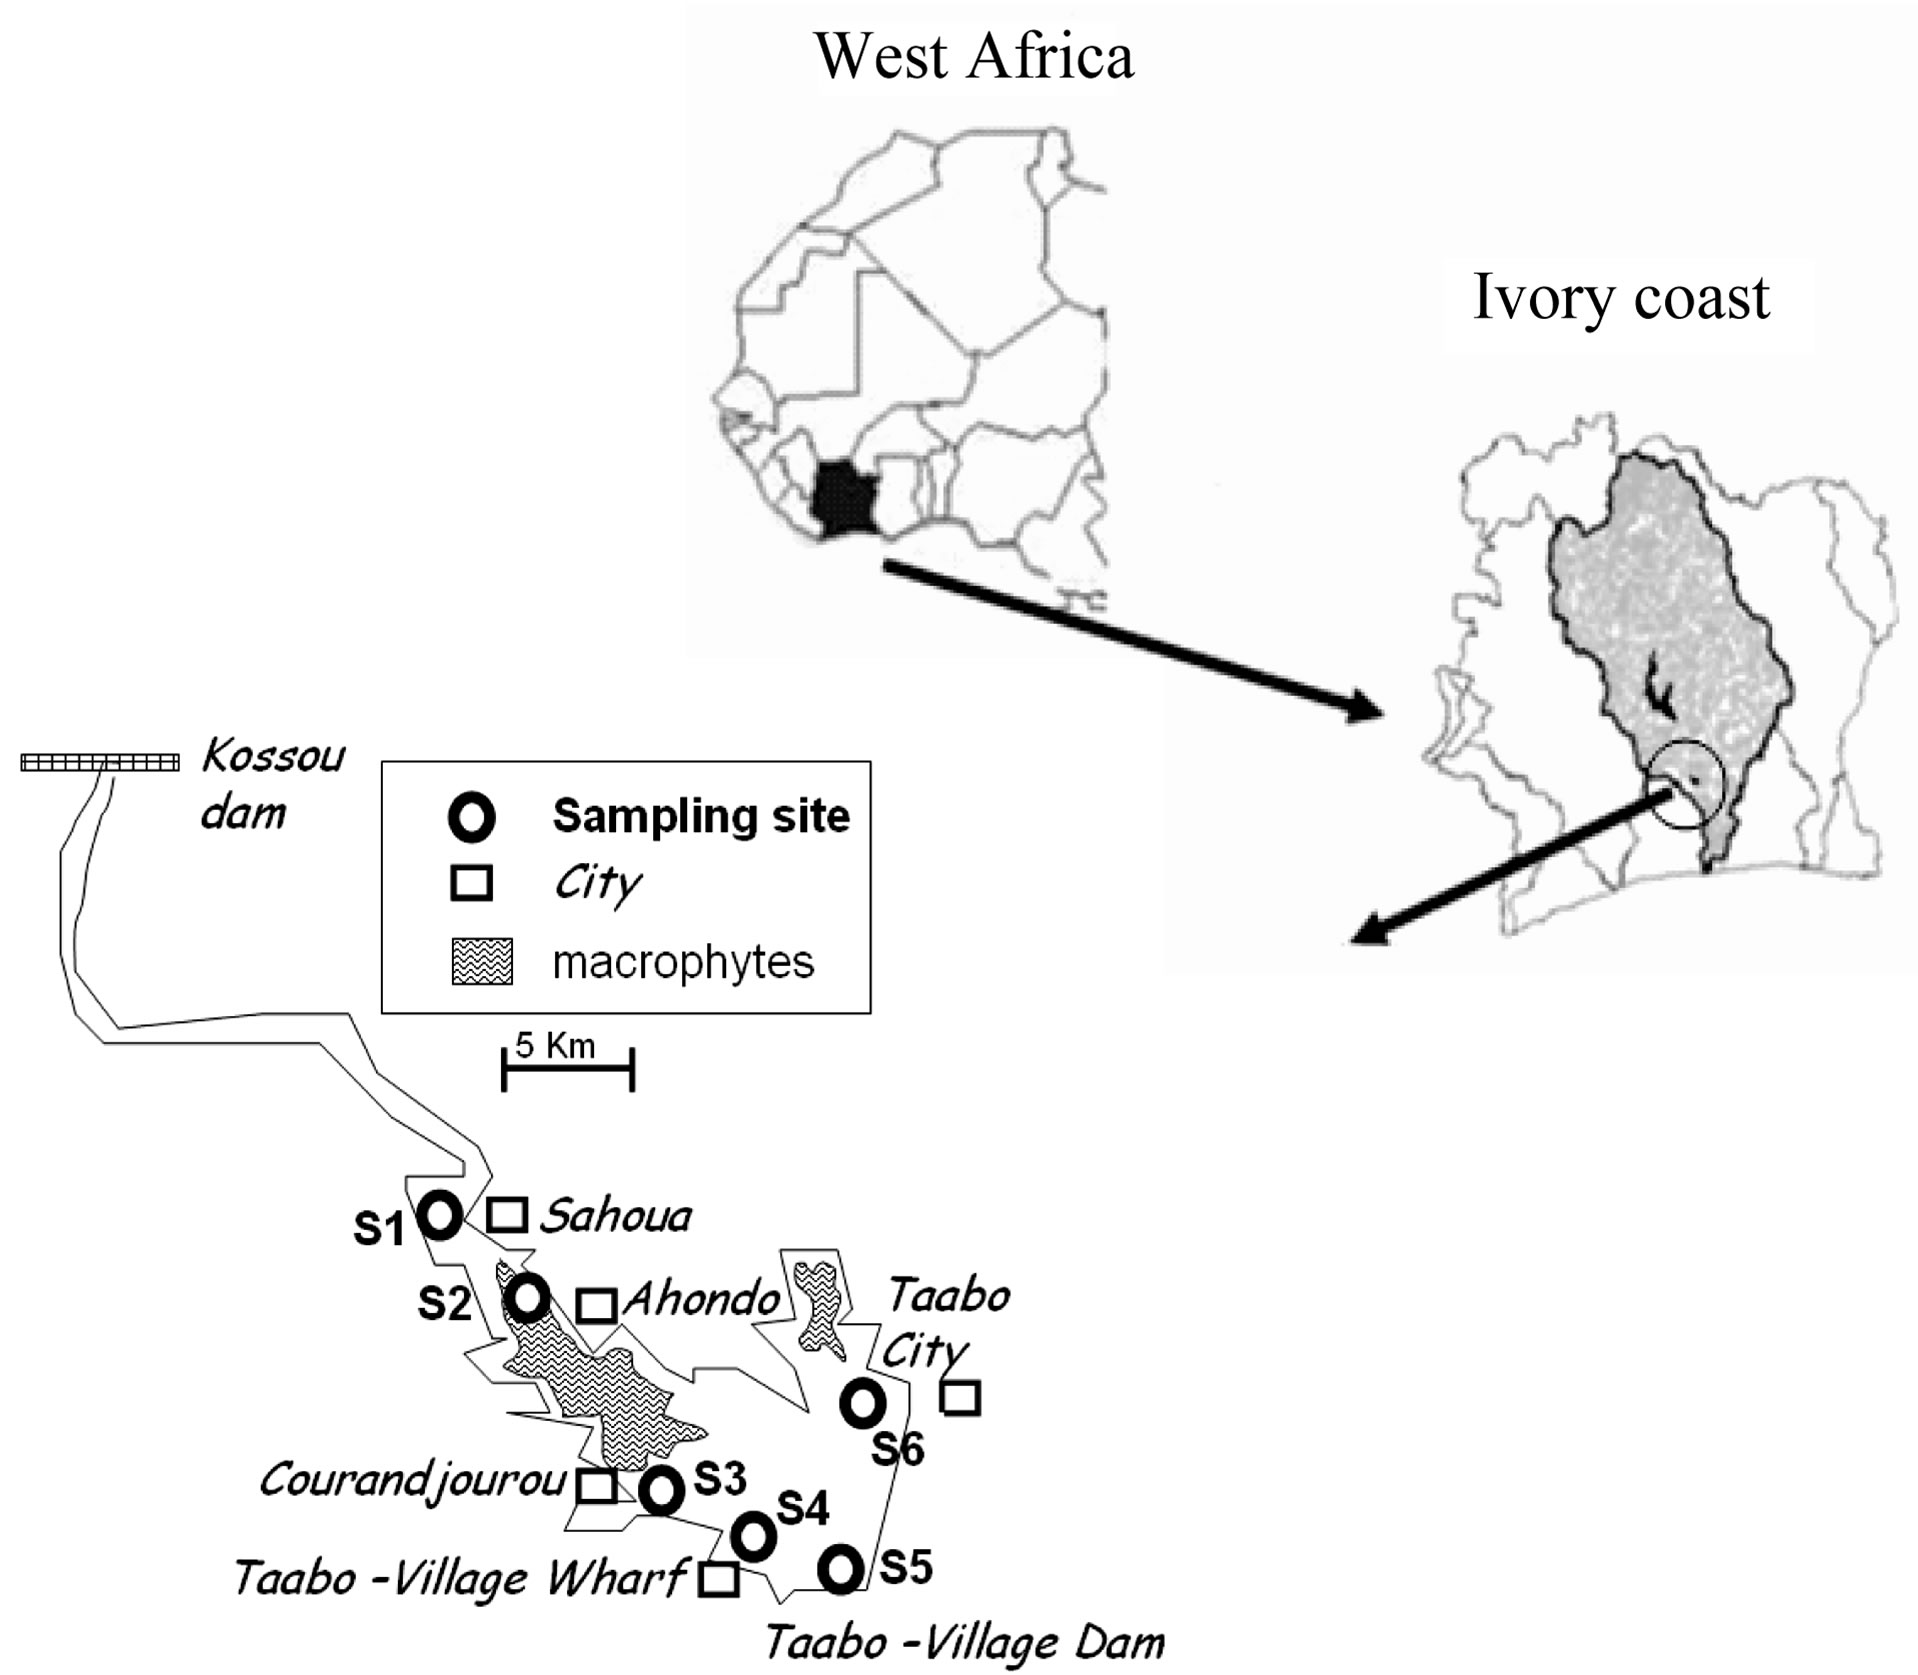
Figure 2. Sampling sites in Lake Taabo (S1: Sahoua, S2: Ahondo, S3: Courandjourou, S4: Taabo-village Wharf, S5: Taabo-Dam, S6: Taabo-City) and the main cities around the study zone.
Agence Nationale d’Appui au Développement Rural, Ivory Coast). More recently-introduced crops, such as hevea and oil palm, occupy a total area of about 300 hectares, with an estimated production of 2000 metric tonnes per year (data from the Agence Nationale de l’Environnement, Ivory Coast). The other subsistence crops (rainyseason rice, maize, peanuts, cassava, plantain, yam) occupy an area of 4292 hectares and produce 19,466 metric tons per year (data from the Agence Nationale d’Appui au Développement Rural, Ivory Coast).
Agriculture is the main activity in the region. It occupies 85% of the land in the catchment area of the reservoir and uses large amounts of agrochemicals (10,400 metric tonnes per year). Furthermore, during the last ten years, the invasion of water hyacinth has resulted in the progressive eutrophication of the lake, leading to major problems for water use [6,7].
2.2. Sampling
The samples were taken during five campaigns between July 2006 and June 2007, using an opaque PVC Van Dorn-type bottle with a capacity of 2.5 litres, mounted horizontally in order to maintain the sampling depth. The sampling depths in the lake were as follows: surface (–40 cm); –1 m; –2 m; –3 m; –4 m. The stations chosen took into account the succession of aquatic habitats and human activities from upstream to downstream. There were six stations (Figure 2): furthest upstream, the reference station Sahoua (S1), in the upper flow at Ahondo (S2), in the deep segment of the left bank of the lake at Courandjourou (S3), in an agricultural zone at Taabo-village wharf (S4), in an urban zone on the right bank at Taabo-City (S6), and finally the furthest downstream at the Taabo-village dam (S5). A GPS MLR SP 12X satellite navigator was used to assist in determining the location of the stations. The water transparency was determined in situ, from the depth (Zs) at which the Secchi disk disappeared. Since 15% of the incident light reached this depth, the depth of the euphotic layer (Zeu) could then then evaluated using the following equation: Zeu = 2.43 × Zs [8]. Determinations of the temperature (in ˚C), the conductivity (in µS/cm), the total dissolved solids (TDS; in mg/l), the dissolved oxygen (DO; in mg/l), the pH and the turbidity (in NTU) of the water were carried out in the field, using a multiparametric WTW 340i instrument.
2.3. Analysis of Nutrient
In the laboratory, the water samples were analysed in order to determine the concentrations of ammoniacal nitrogen (mg/L of NH4+), nitrate (mg/L of N-NO3), nitrites (mg/L of N‑NO2), phosphate (mg/L of PO43–) and silica (mg/L of SiO2–). The samples were filtered through Whatman GF/C fibreglass filters. Then, in accordance with standard operating procedures [9], the concentrations of these parameters were determined using a HACH DR 2000 model spectrophotometer at a specified wavelength.
2.4. Analysis of Chlorophill a
To measure the chlorophyll a (chl-a) concentration, 250 ml of river water was passed through 0.7 µm glass fibre filters (Whatman GF/C, diameter of 25 mm) during the 10 hours after sampling. Because sampling took place over 2 days, filters were stored at –80˚C for 48 h, following which chl-a was extracted in 97% methanol at 75˚C. The extinction of extracts was measured at 750 nm and 665 nm before and after adding hydrochloric acid. The chorophyll-a content was calculated according to Herbland et al. [10].
2.5. Data Analysis
Wilcoxon and Kruskal-Wallis tests were used to test the effects of season, station and depth on each of the 13 physicochemical descriptors. The spatio-temporal analysis was then analysed by means of a normalised principal component analysis (PCA) and processed by intergroup analyses [11] to test the extent of the effects of the three factors (season, station and depth) on the multidimensional model. The test procedure was based on 9999 random permutations of the lines in the data table [12].
3. RESULTS
3.1. Physicochemical Characteristics
The water temperature in Lake Taabo (Table 1) remained fairly high all year round (on average 28.8˚C), with little variability (interval of confidence: 1.7˚C).
The dynamics of the values of the turbidity and transparency of the water showed the same trends as those of the Total Dissolved Solids (TDS) and the conductivity (Table 1). The highest mean values of the turbidity were observed in the upstream segment (at S1), whereas the lowest values were recorded downstream (at S5). The water was deeper during the rainy season than during the dry season: 5.9 ± 0.8 m and 5.5 ± 1.0 m at S1; 6.0 ± 1.0 m and 5.5 ± 1.0 m at S2; 7.3 ± 1.5 m and 6.5 ± 1.0 m at S3; 6.8 ± 1.6 m and 5.4 ± 0.7 m at S4; 8.0 ± 1.0 m and 6.3 ± 0.5 m at S5; 6.7 ± 0.5 m and 5.5 ± 1.0 m at S6, respectively. The transparency (Secchi disk) ranged from 0.56 m (S1) to 2.01 m (S4) during the period studied, which corresponds to a depth in the euphotic zone ranging from 1.65 m to 4.88 m.
The dissolved oxygen saturation level (% DO) fluctuated between 37% (station S2) and 122.5% (station S6). The dissolved oxygen ranged from 3.2 to 9.4 mg/l; the highest oxygenation level of the water occurring at S6. The low levels at S1 and S3 were attributable to the high macrophytic biomass at the stations in the upstream segment of the lake. The highest conductivity values were observed during the rainy season. The mineralisation declined overall from upstream (88 ± 15.6 mg/l at S1) to downstream (63 ± 7.9 mg/l at S5). The pH tended to be neutral to basic at S1, S2 and S6, and neutral to acidic at S3, S4, and S5. This latter group of stations displayed high concentrations of silicates ([SiO2−] > 4 mg/l). The levels of nitrate [NO3] were highest in the zones S4, S5 and S6, but remained below 3 mg/l. Nitrite [NO2] concentrations were very low. Orthophosphate concentrations increased progressively from the point of entry into the lake (S1: 7.4 ± 8.9 mg/l) towards the dam (S5: 54 ± 18 mg/l at S5). The concentrations of ammonium ions were low at the entry point (S1: 0.09 mg/l and S2: 0 mg/l) and reached 3.05 mg. N-NH4+/l at the bottom of the lake at S4 (Table 1).
Define abbreviations and acronyms the first time they are used in the text, even after they have been defined in the abstract. Abbreviations such as IEEE, SI, MKS, CGS, sc, dc, and rms do not have to be defined. Do not use abbreviations in the title or heads unless they are unavoidable.
3.2. Effects of Place and Season
The physicochemical characteristics seem to have been strongly influenced mainly by the season, and secondarily by the station, but not by the sampling depth (Tables 1 and 2).
The PCA revealed the importance of the first three axes: 44%, 15% and 13% respectively (Figure 3). Axes 1 and 2 were strongly structured by season. High values
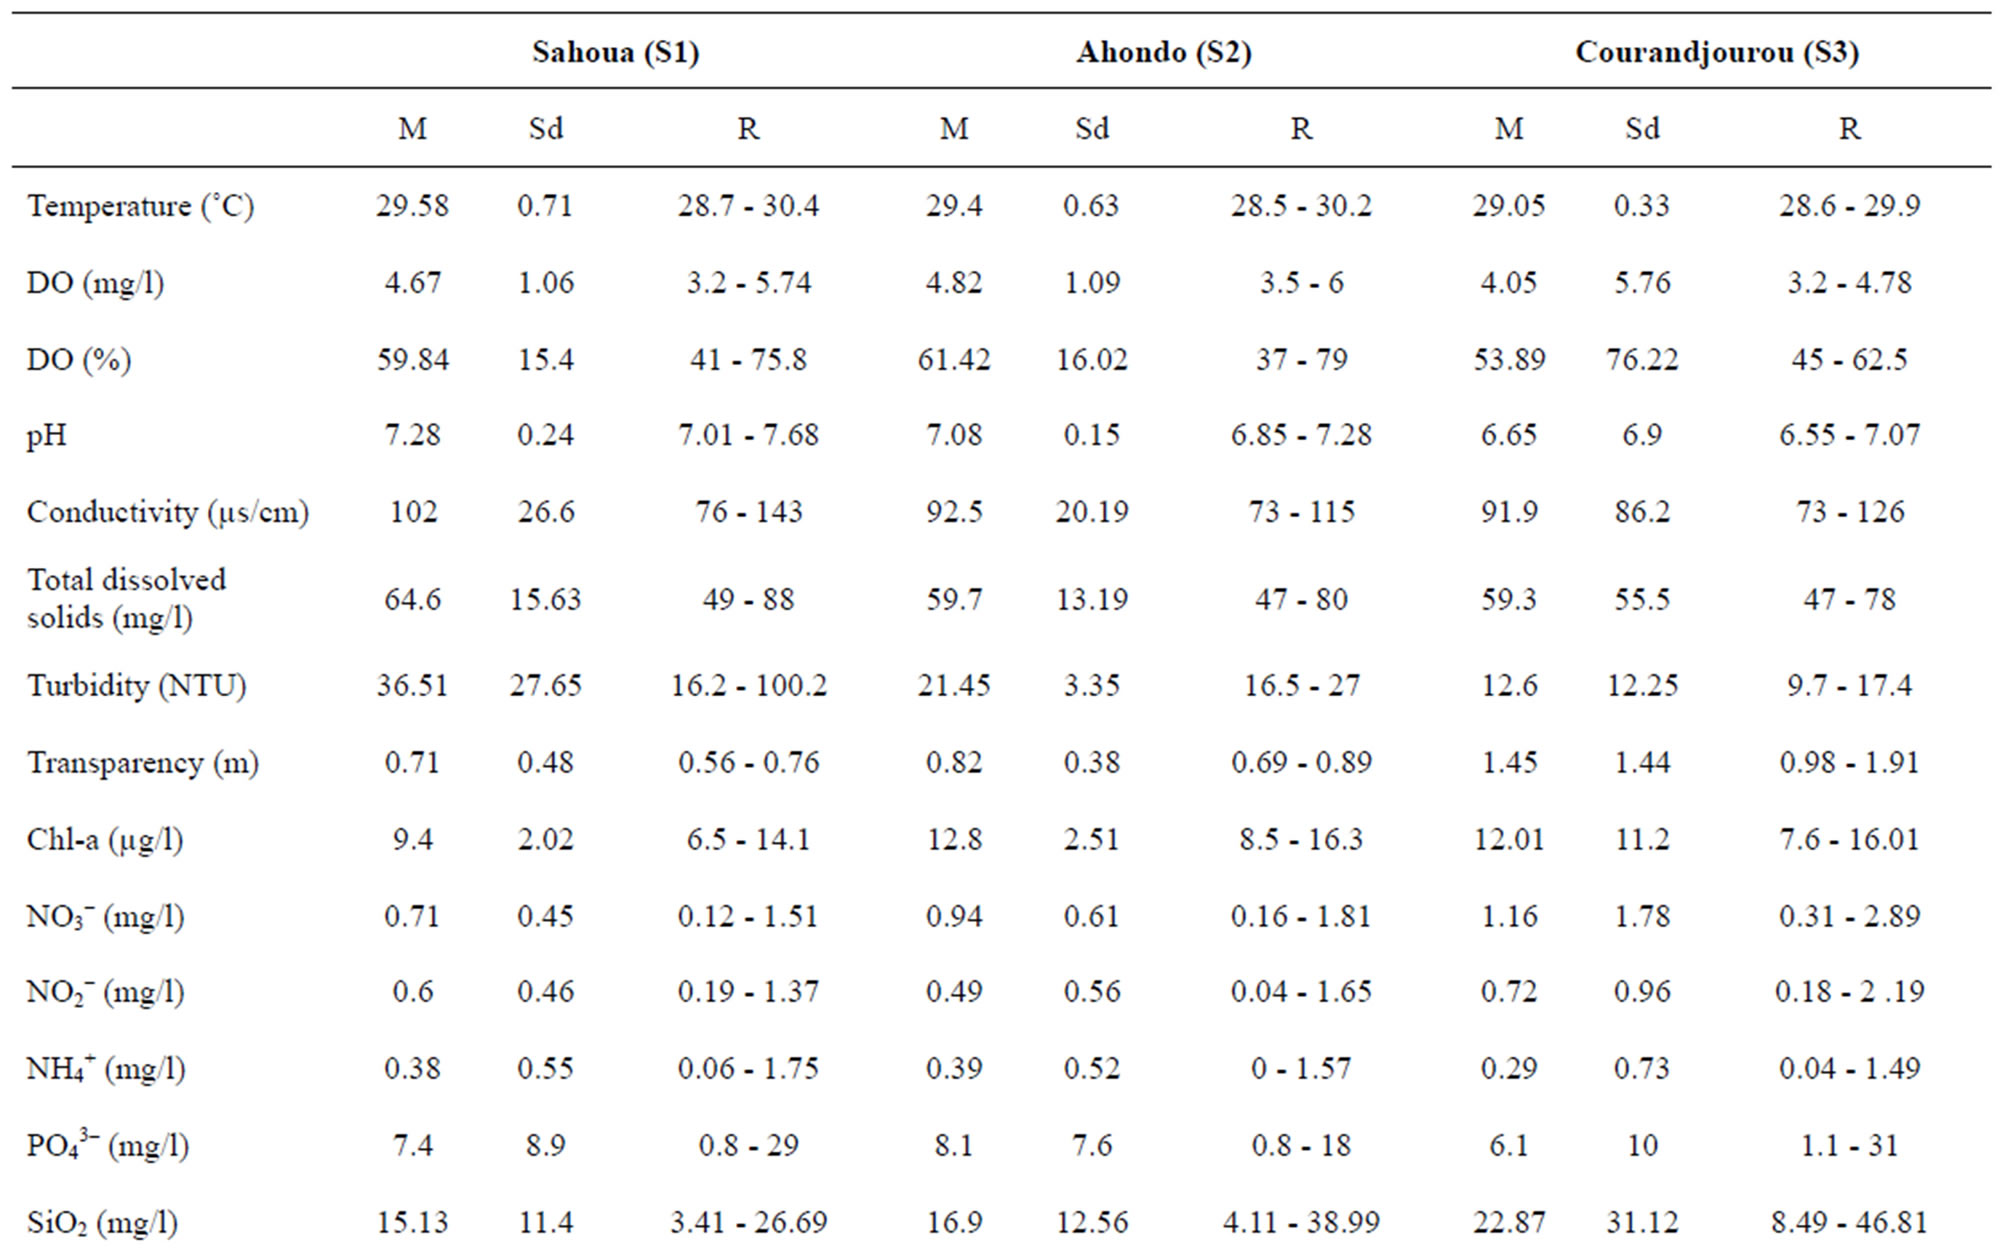
Table 1. Mean, minimum and maximum values, and standard deviation (sd) of the abiotic parameters measured between July 2006 and June 2007 at the 6 stations on Lake Taabo on the basis of the five depths. M: main. Sd: standard deviation. R: range. DO: dissolved oxygen.
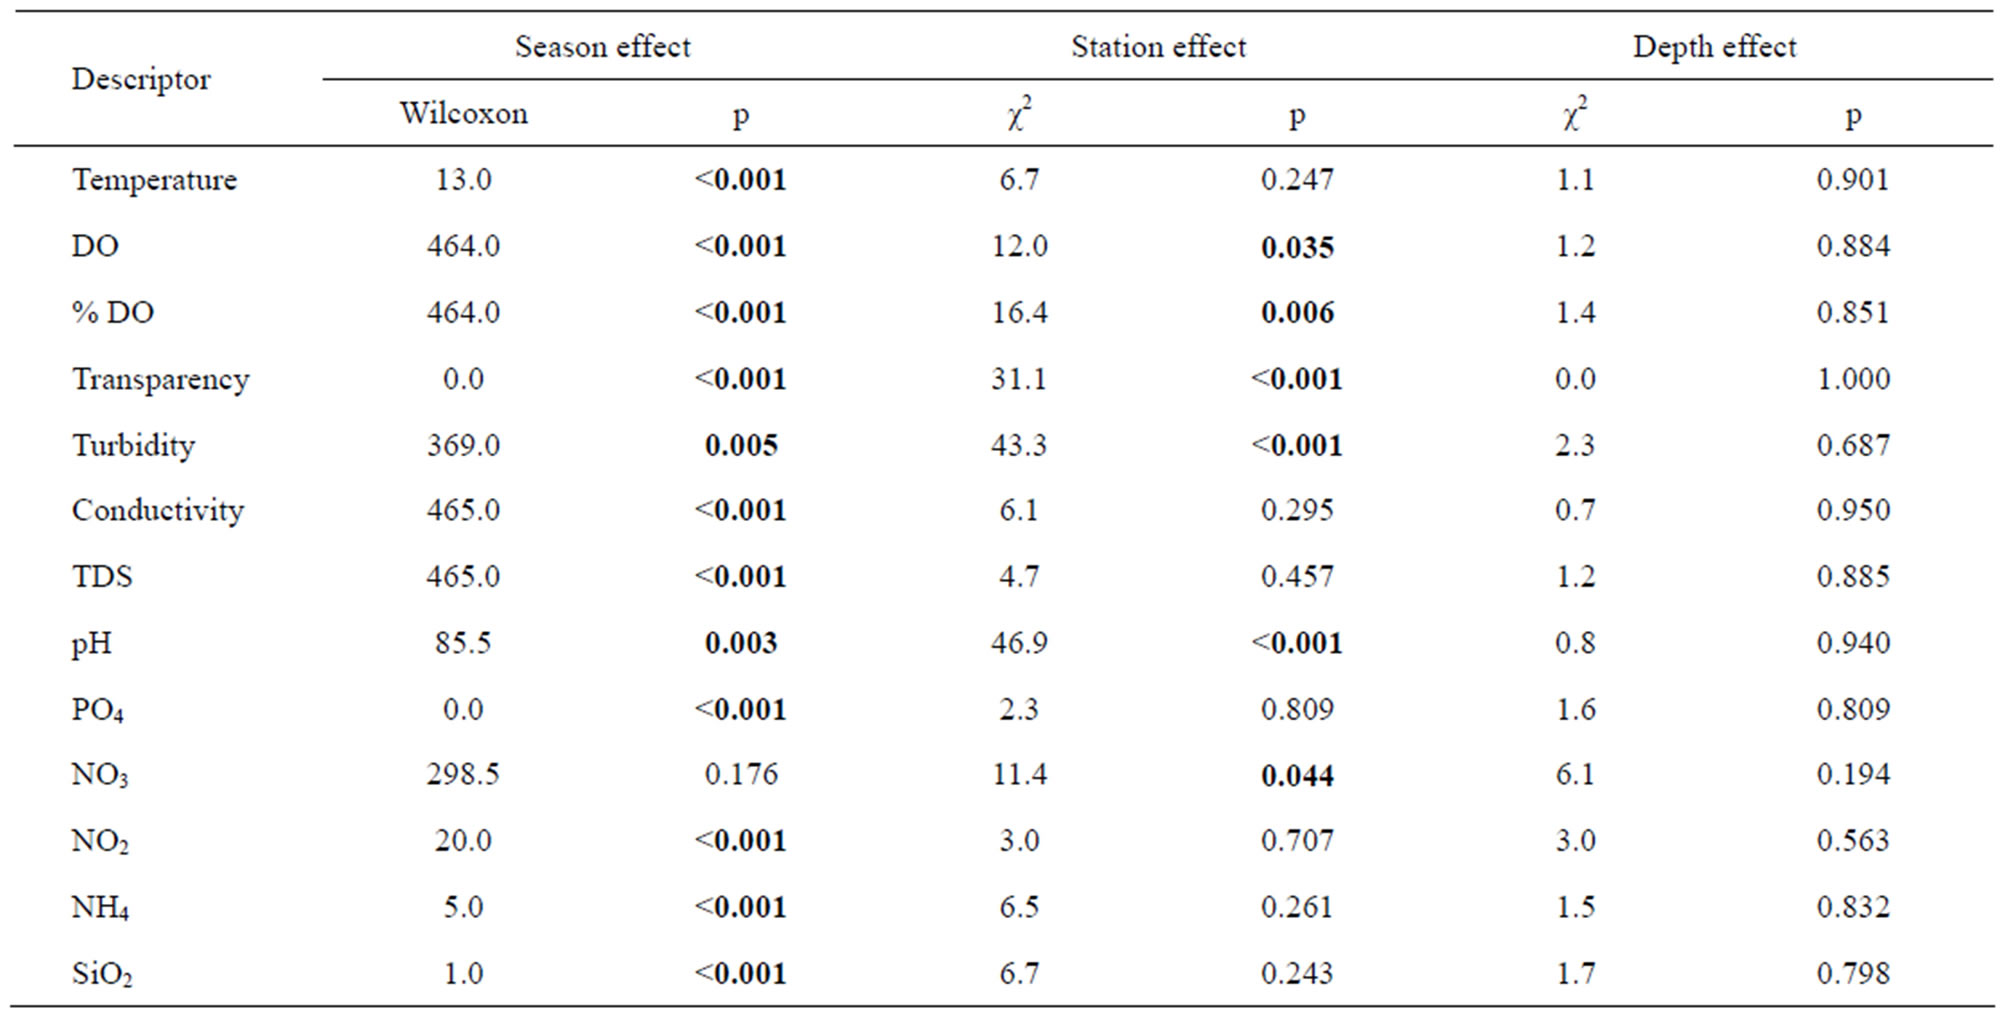
Table 2. Wilcoxon test (season effect) and Kruskal-Wallis test (station and depth effects) on each of the physicochemical descriptors. Significantly differences are shown in bold (p < 0.05). DO: dissolved oxygen.
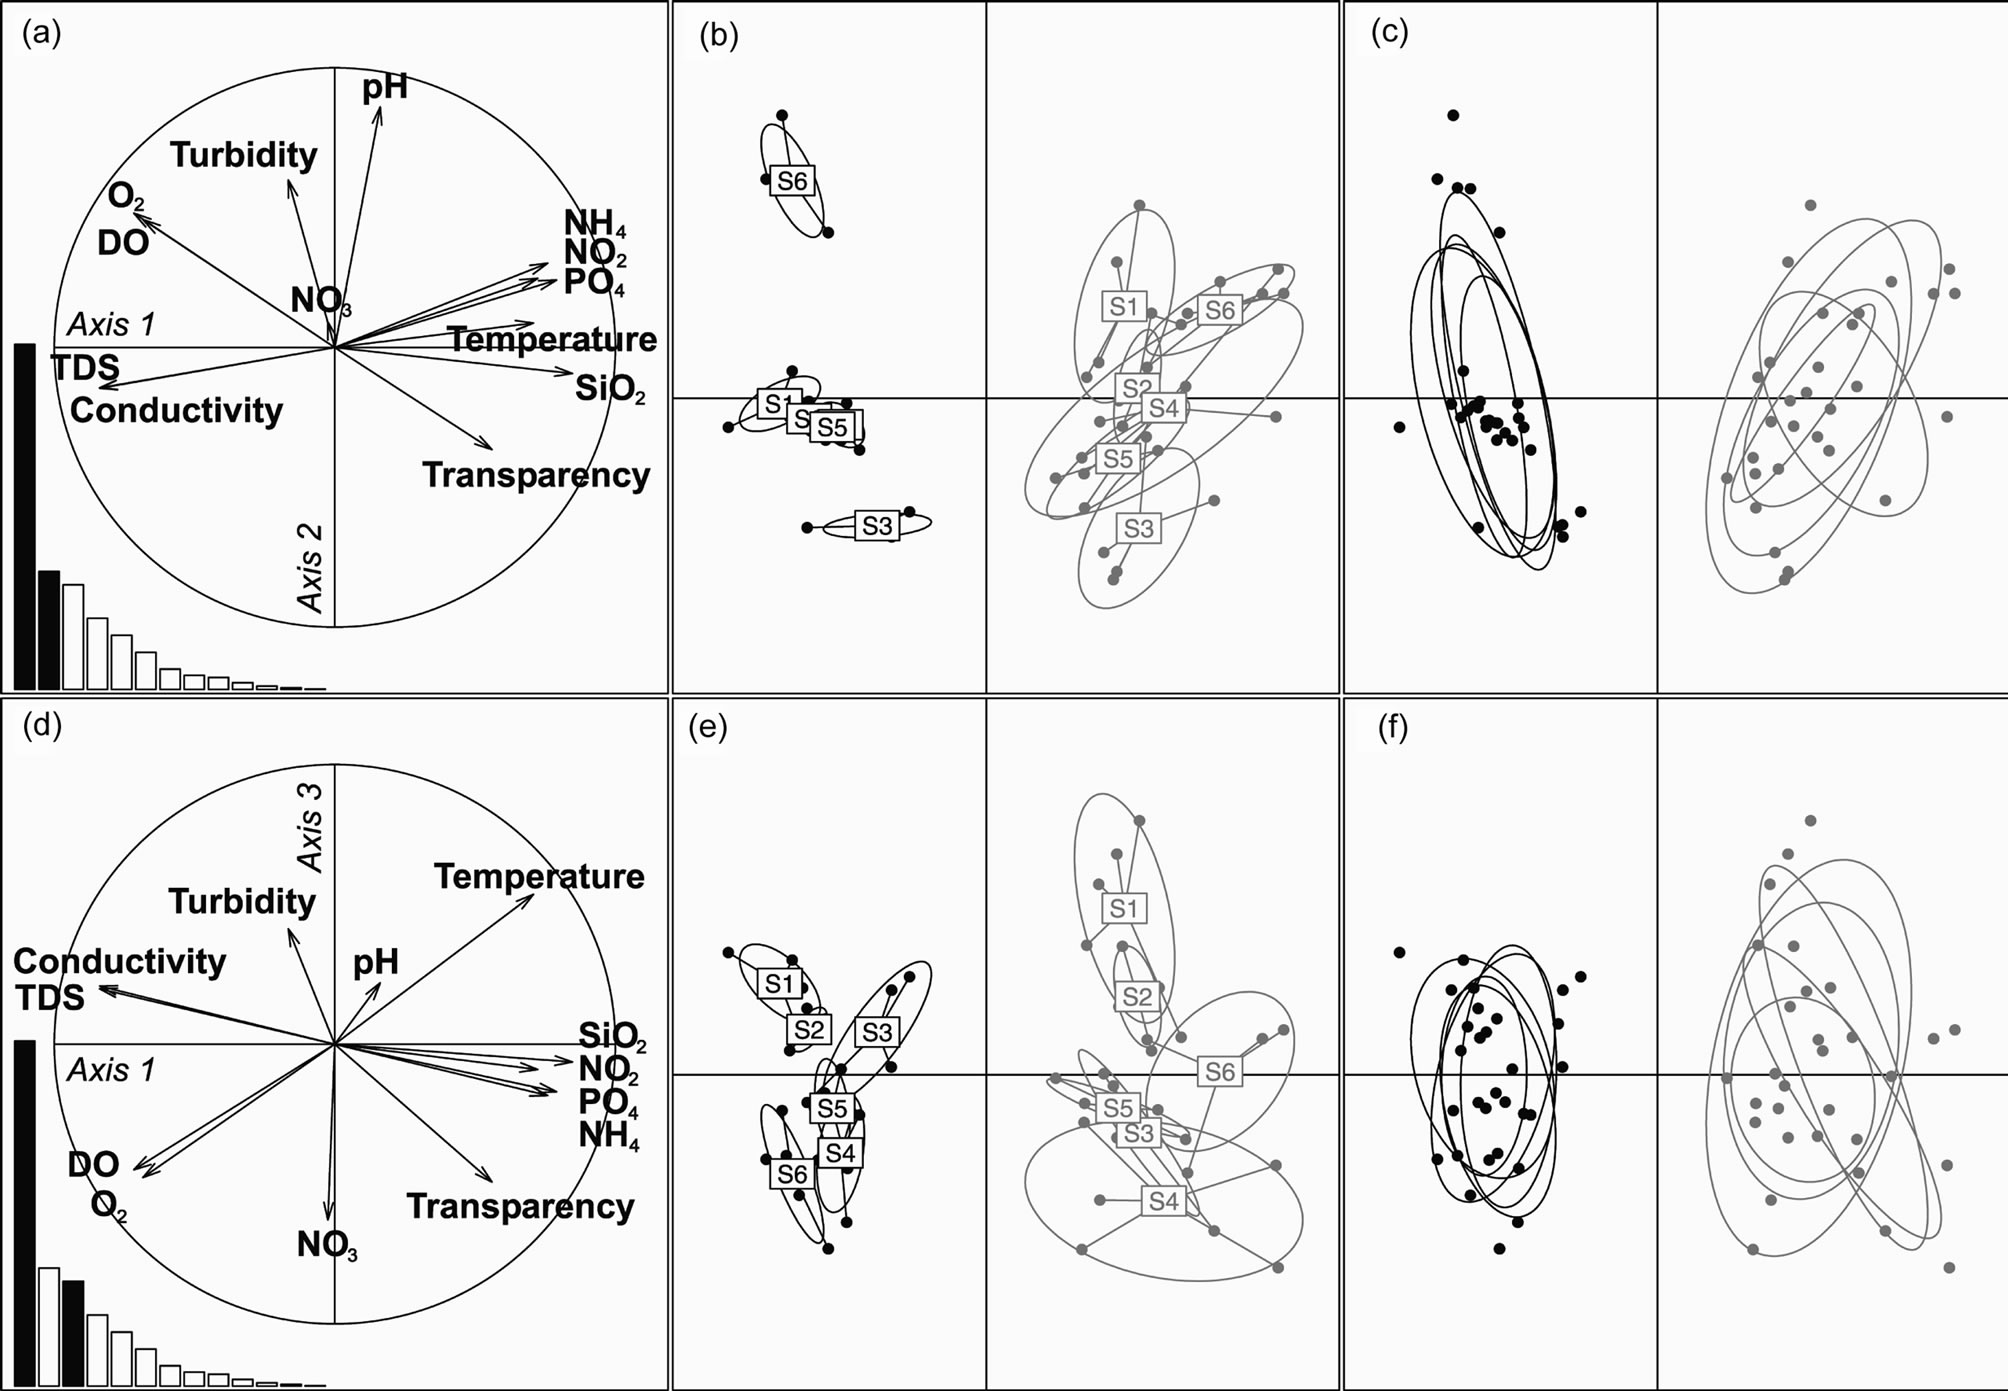
Figure 3. Principal Component Analysis (PCA). (a) and (d): specific values diagram. (a), (b) and (c): axes 1 (44%) and 2 (15%). (d), (e) and (f): axes 1 and 3 (13%). (c) and (f): samples pooled by depth, revealing the absence of vertical structuring. (b), (c), (e) and (f): rainy season in black and dry season in black.
of temperature, dissolved nutrients and transparency were characteristic of the dry season, unlike the rainy season, which was characterised by high DO concentrations, a high percentage DO, high conductivity and high levels of total dissolved solids (TDS). Axes 2 and 3 reflect the spatial variations induced by a season effect. We can, therefore, make three main observations:
• The spatial variability was more marked during the rainy season. The stations fall into 3 main groups (Group 1: S6, Group 2: S1, S2, S4, S5, Group 3: S3) according to axes 1 and 2 in the rainy season. During the dry season, the stations were less dispersed.
• There was an upstream-downstream gradient along axis 3, which was characterised by the variability of the concentrations of DO, % DO, nitrates and of the transparency.
• Axis 2 was characterised by high values of turbidity and pH.
Finally axes 1 and 3, the downstream stations (S4, S5, S6), which were subject to the greatest anthropic pressure, contrasted with the most upstream stations in the lake (S1, S2) and S3.
Average concentration of chl-a were low, exceeding 10 µg/L on only occasion in S1, and some values were less than 6 µg/L. Furthermore, a downstream increase in chla was observed. The influence of tributaries on phytoplankton algal biomass is shown in Table 1.
4. DISCUSSION
This paper is based on a recent field study, and includes various data available about Lake Taabo. The goal was to provide an update on the trophic status of the lake, and to identify the main problems that limit the use of this water resource with a view to defining an appropriate protection and management program.
The low values of transparency found during the rainy season (<1 m transparency during high water, compared to 2 m on average during the low water period) were due to an increase in the concentration of suspended matter. This was essentially due to erosion in the catchment area of the lake and to the presence of large quantities of agricultural waste carried in by leaching from the fields [13].
The temperature profile does not display any marked thermal stratification or much variability. Cooling throughout the entire water column during the rainy season is characteristic of tropical lakes [14]. The temperatures in Lake Taabo are of the same order as those reported in Lakes Kossou [15], Buyo [16] and Ayamé [17]. Lake Taabo is a hot monomictic lake with little difference in temperature between the epilimnion and the hypolimnion (mean temperature 26˚C to 27˚C) which makes it impossible to establish a true thermocline.
The vertical distribution of the dissolved oxygen is clinograde all year round. The surface masses of water display marked supersaturation. In the depths, a marked deficiency of local dissolved oxygen may occur. The 60% level of dissolved oxygen saturation that constitutes a critical biological threshold is often reached at a depth of just 2 m below the surface. This value constitutes a warning sign; if the increased pollution in the lake continues, the oxygen deficiency will gradually increase to the point where it threatens aquatic life. During the dry seasons, complete anoxia is often recorded at a depth of 3 m. Only high rainfall leads temporarily to a slight increase in the dissolved oxygen saturation. Similar observations have been made in Lakes Ayamé 1 and 2 [18]. At depths of more than 3 m, anoxia is permanent throughout the year. Such a change in the concentration of dissolved oxygen in an environment containing high levels of organic substances is characteristic of highly eutrophic environments, and related to the marked development of phytoplankton and macrophytes [19]. The high conductivity observed cannot be explained by the granite-type rocky substratum [20] and must, therefore, be attributed to inputs linked to human activities, such as untreated waste water [21]. The deoxygenation of the deep zones of the lake is the consequence of the breakdown of the input of organic matter. These zones, which lie beneath the euphotic zone (a zone with low transparency), do not benefit from the purifying activity of photosynthetic organisms. In these deepest layers, the low values of dissolved oxygen can compromise the survival of aquatic organisms [22]. These observations are corroborated by the high levels of ammoniacal nitrogen at the bottom of the lake, which reflects the incomplete mineralisation of organic substances. The extension of the anoxic zones in the water column can threaten the entire ecosystem. However, oxygen levels during the daytime were highest at station S6 during the rainy season (Groga, unpublished data). This is certainly to be related to enrichment in nutrients, which temporarily promotes primary production.
Coastal areas, which are subjected to significant changes in water levels, are sites where non-negligible quantities of sediments and mineralised organic matter are resuspended and redissolved during successive flooding events. Nitrate concentrations are low (<0.5 mg/l) are comparable to those reported by [23] in the River Ubu (0.1 to 3 mg/L NO3–). At the beginning of the rainy season, an increase in the concentrations of nitrates is observed due to leaching from the soil. However, heavy and continuous rain results in dilution, leading to lower concentrations [24]. This change in concentrations linked to pollution is attributable to the leaching of artificial fertilisers (N/P/K) used by smallholders along the lake shores [25]. These inputs in surface water run-off depend on their flow and their proximity to sources of pollution (in our case, downstream from towns and agricultural land). During the rainy season, the high levels of nutrient salts observed reflect the presence of a large area of cattle pasture in the case of station S3, a strongly agricultural zone in that of station S4, and a densely-populated urban zone with little agriculture in that of station S6. These concentrations are gradually diluted towards the exit from the lake (station S5). Nutrient criteria for streams may be needed to avoid direct toxicity, taste, and odor problems, alterations in biotic integrity, and interference with recreation [26].
When a dam is built and its reservoir fills, human activities soon develop in the region served by the dam, which leads to severe environmental disturbance (Figure 4). Thus, the banks are subjected to anthropic pressure due to the development of urbanisation, roads, industries and agriculture. The effects of these pressures and of their environmental impacts are obvious in the case of Lake Taabo. Human pressure and current climate changes are leading to rapid changes in lake function. The use of water to generate hydroelectric power contributes to accelerating changes in lake function. Flooding of agricultural land during the rainy season contributes to washing large amounts of sediment and nutrients into the lake. Finally, in the case of Lake Taabo, we can identify five major causes of disruption (Table 3): run-off from agricultural land and urban areas, solid waste washed off by the rain from garbage dumps, changes in water levels related to electricity generation. The combined effects of these disturbances can not only impair the functioning of the ecosystem, but also lead to impaired water quality and restriction of water usage by local communities, which in the medium term could compromise the growth of new economic activities around Lake Taabo.
Usage conflicts, associated with the use of water as a receptor for pollution, are increasing. In developing countries, the technical means required to reduce or treat pollution are generally not available. Meanwhile, the development of urban areas is accompanied by an increasing demand for drinking water. In remote locations, wastewater treatment plants are still very sketchy or even nonexistent. Despite existing concerns about traditional usages, and the resulting pressure on water resources is an important potential source of tension and of conflict, we should not ignore two other significant factors: the development of agro-industries and intensive irrigation on one hand [27], and the numerous industrial usages of water on the other hand.
Excess nutrients can also indirectly prejudice human interests as a result of increased water treatment costs. Algal and cyanobacterial blooms can lead to taste and odour problems, and increase toxin levels in river water [28,29]. Algal blooms can also interfere with recreational
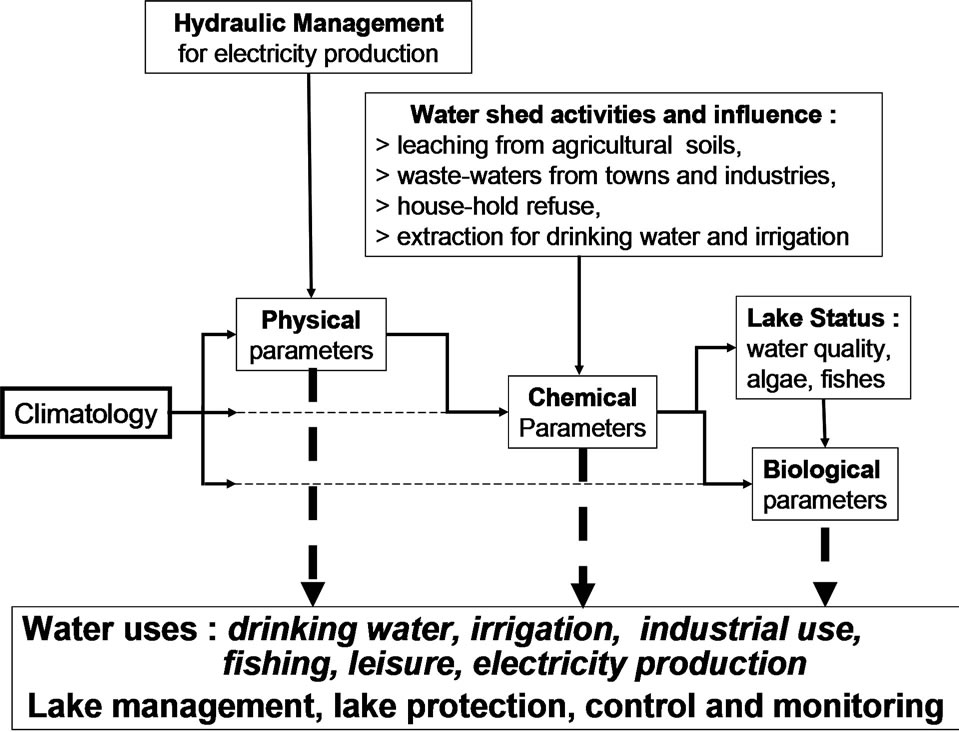
Figure 4. Main factors influencing the volume of water in Lake Taabo.
uses such as swimming, fishing, and tourism due to increases in the phytoplankton, periphyton, and/or macrophyte biomass. Finally, eutrophication of rivers can alter the composition of the biotic community and decrease biotic integrity [30]. Chl-a concentration in the Lake indicates an apparently markedly trophic state.
Many sources of renewable energy use water, most obviously in the case of hydroelectricity. Reservoirs can also lead to other severe ecological disruption: excessive evaporation of the bodies of water in periods of hot weather, the drying up of the downstream segments of rivers. The vital and multifunctional nature of water, which is a limited resource and unequally distributed, suggests that there will be an increase in conflicts which, if they are not resolved by rules perceived as being fair, will contribute to increasing tension, situations of violence, marginalization and exclusion, and humanitarian disasters. The priorities for water management appear to be as follows:
A biosafety policy followed by an action plan to prevent telluric pollutionReinforcement of the operational framework for the management of agrobiodiversityDevelopment of a global policy regarding the management of genetic resources that are important for farming and nutritionImproving the conservation of biological variety in the development of sectoral activitiesMaking the choices that reduce negative impact of sectoral activities, and reinforcing the capacities of the participants.
The current situation could lead in the near future to a progressive and irreversible deterioration of water quality in the Lake. Faced by this threat to the ecosystem, as well as to human and animal health and to the economic development of the region, it is reasonable to promote a
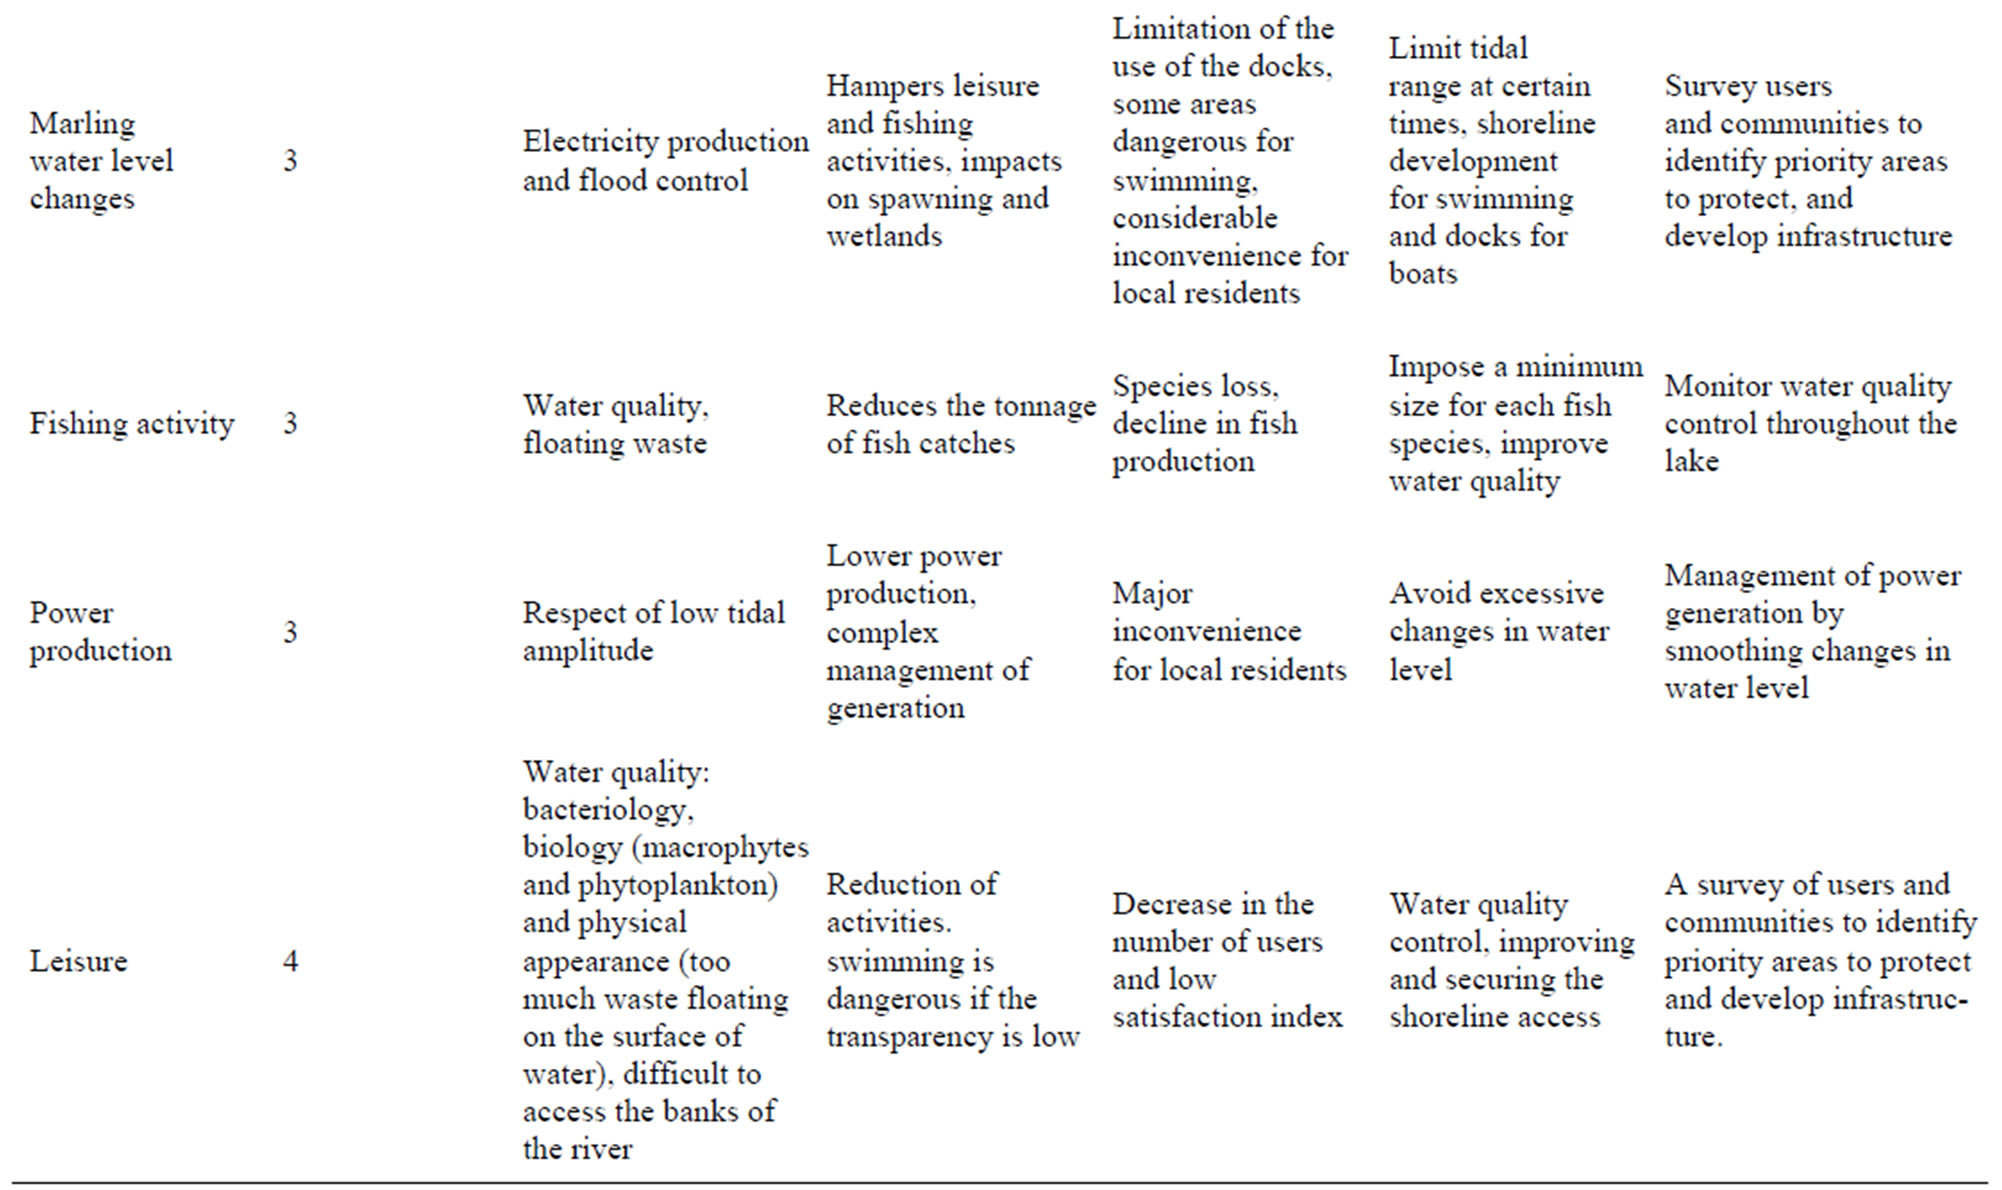
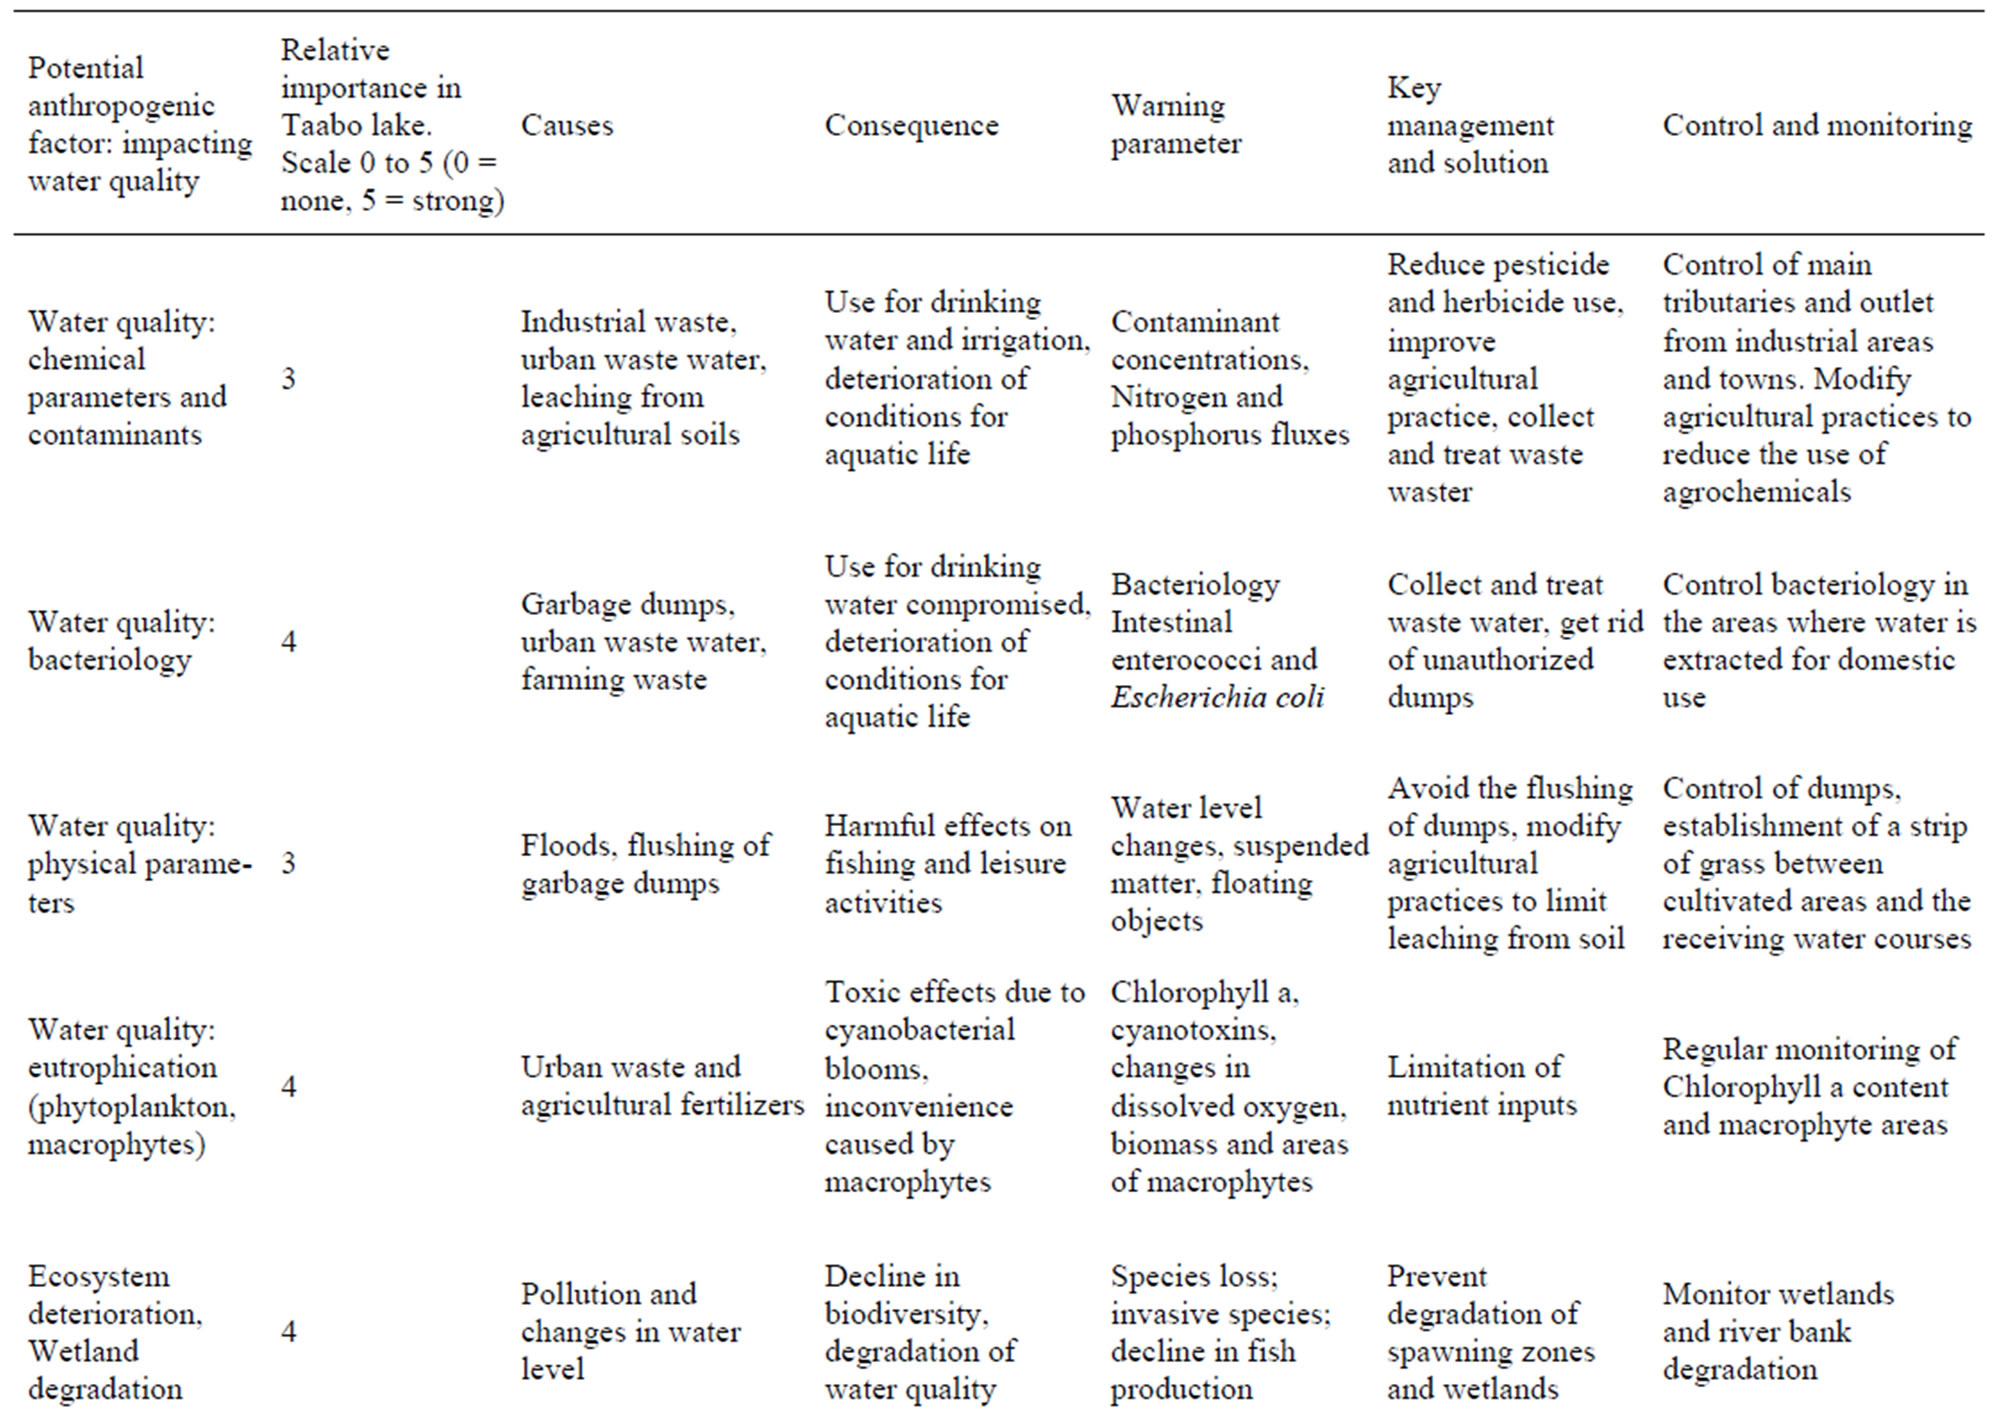
Table 3. Management of water-use conflicts.
programme that will ensure sustainable development and monitoring of the environment and of water use throughout the entire catchment area of the Lake. These conclusion and suggestions for future planning and management will be taken into account by the Ministry of Water and Forests (MEF) and SODECI (The Ivory Coast Water Distribution Company), the two agencies in charge of managing Lake Taabo and its watershed.
5. ACKNOWLEDGEMENTS
We would like to thank the Committee for Scientific and Technological Cooperation [COMSTECH] of the Islamic Conference Organisation (Islamabad, Pakistan) and the International Foundation for Science [IFS/FIS] (Stockholm, Sweden) who funded this study under the auspices of the Challenge Program Project CGIAR/FIS-CNRA N° A/4007-1.
REFERENCES
- Kazi, T.G., Arain, M.B., Jamali, M.K., Jalbani, N., Afridi, H.I., Sarfraz, R.A., Baig, J.A. and Shah, A.Q. (2009) Assessment of water quality of polluted lake using multivariate statistical techniques: A case study. Ecotoxicology and Environmental, Safety, 72, 301-309. doi:10.1016/j.ecoenv.2008.02.024
- Burton, T. (1997) Le plus grand lac du mexique peut-il être sauvé? Ecodécision, 23, 68-71.
- Strobl, R.O. and Robillard, P.D. (2008) Network design for water quality monitoring of surface freshwaters: A review. Journal of Environmental Management, 87, 639- 648. doi:10.1016/j.jenvman.2007.03.001
- Niasse, M., Afouda, A. and Amani, A. (2004) Réduire la vulnérabilité de l’afrique de l’ouest aux impacts du climat sur les ressources en eau, les zones humides et la désertification. UICN, Cambridge.
- Horeau, N. (2001) L’or bleu des barrages se ternit... colloque eau et santé, impacts sanitaires et nutritionnels des hydro-aménagements en Afrique. Développement et Santé, 155, 8.
- Véi, K.N. (2005) Suivi et évaluation de l’impact sociotemporel d’un projet d’aménagement du territoire en afrique de l’ouest. l’exemple du barrage de taabo en côte d’ivoire. apport de la télédétection et des SIG. Ph.D. Dissertation, Université de Cocody, Abidjan.
- Kouamé, M.K., Dietoa, M.Y., Edia, E.O., Da Costa, S.K., Ouattara, A. and Gourène, G. (2011) Macroinvertebrate communities associated with macrophyte habitats in a tropical man-made lake (Lake Taabo, Côte d’Ivoire). Knowledge and Management of Aquatic Ecosystems, 400, 3.
- Wetzel, R.G. and Likens, G.E. (1995) Limnological Analysis. Springer-Verlag, New York.
- American Public Health Association (1989) Standard Methods for the Examination of Water and Wastewater, 17th Edition, American Public Health Association, Washington DC.
- Herbland, A., LeBouteiller, A. and Raimbault, P. (1985) Size structure of phytoplankton in the equatorial Atlantic Ocean. Deep Sea Research, 32, 819-836. doi:10.1016/0198-0149(85)90118-9
- Doledec, S. and Chessel, D. (1987) Rythmes saisonniers et composantes stationnelles en milieu aquatique—I. description d’un plan d’observations complet par projection de variables. Acta Oecologica, Oecologia Generalis, 8, 403-426.
- Manly, B. (1991) Randomization and Monte Carlo Methods in Biology. Chapman and Hall, London.
- Akpan, E.R. and Offem, J.O. (2004) Seasonal variation in water quality of the cross river, Nigeria. Revue d’Hydrobiologie Tropicale, 26, 95-103.
- Ryding, S.O. and Rast, W. (1994) Le Contrôle de l’Eutrophisation des Lacs et Réservoirs. Science de l’Environnement, Masson.
- Brunel, J.P. and Bouron, B. (1992) Evaporation des Nappes d’Eau Libre en Afrique Sahélienne et Tropicale. Cahiers de l’ORSTORM, Série Hydrologie.
- Yapo, O. (2002) Evaluation de l’état trophique du lac de Buyo (côte d’Ivoire), aspects physicochimiques et biologiques. Ph.D. Dissertation, Université d’Abobo-Adjamé, Abidjan.
- Diomandé, D. (2001) Macrofaune bentique et stratégies alimentaires de Synodontis batiani et S. schall en milieu fluvio-lagunaire (bassins Bia et Agnébi; Côte d’Ivoire). Ph.D. Dissertation, Université d’Abobo-Adjamé, Abidjan.
- Galy-Lacaux, C., Delmas, R., Kouadio, G., Richard, S. and Gosse, P. (1999) Long-term greenhouse gas emissions from hydroelectric reservoirs in tropical forest regions. Global Biogeochemical Cycles, 13, 503-517. doi:10.1029/1998GB900015
- Moss, B. (1998) Ecology of freshwater: Man and Medium, Past to Future. Blackwell Science, Oxford.
- Leblond, P. (1984) Contribution aux Études Hygéologiques en Côte d’Ivoire. Région de Yamoussoukro, Station Expérimentale de l’ENSTP. Université de Bordeaux 1, Bordeaux.
- Helena, B., Pardo, R., Vega, M., Barrado, E., Fernandez, J.M. and Fernandez, L. (2000). Temporal evolution of groundwater composition in an alluvial aquifer (Pisuerga River, Spain) by principal component analysis. Water Research, 34, 807-816. doi:10.1016/S0043-1354(99)00225-0
- Izonfuo, L.W. and Bariweni, A.P. (2001). The effect of urban runoff water and human activities on some physico-chemical parameters of the Epie creek in the Niger Delta. Journal of Applied Sciences and Environmental Management, 5, 47-55.
- Uzoukwu, B.A., Ngoka, C. and Nneji, N. (2004) Monitoring of seasonal variation in the water quality of Ubu river in Ekwusigo and Nnewi local government areas of Anambra State, Nigeria. Environmental Management, 33, 886-898. doi:10.1007/s00267-004-3058-2
- El Samrani, A.G., Lartiges, B.S., Yvon, J. and Ghanbaja, J. (2004) Trace element carriers in combined sewer during dry and wet weather: An electron microscopie investigation. Water Research, 38, 2063-2076. doi:10.1016/j.watres.2004.01.029
- Bartsch, A.F., and Ingram, W.M. (1967) Stream life and the pollution environment. In: Biology of Water Pollution. US Department of the Interior, Washington DC, 119-127.
- Dodds, W.K. and Welch, E.B. (2000) Establishing nutriaent criteria in streams. Journal of the North American Benthological Society, 19, 186-196. doi:10.2307/1468291
- Paquerot, S. (2005) Un Monde sans Gouvernail: Enjeux de l’Eau Douce. Athena Edition, Outremont.
- Maier, H.R., Burch, M.D. and Bormans, M. (2001) Flow management strategies to control blooms of the cyanobacterium, Anabaena circinalis, in the River Murray at Morgan, South Australia. Regulated Rivers-Research & Management, 17, 637-650. doi:10.1002/rrr.623
- Davis, J.R. and Koop, K. (2006) Eutrophication in Australian rivers, reservoirs and estuaries—A southern hemisphere perspective on the science and its implications. Hydrobiologia, 559, 23-76. doi:10.1007/s10750-005-4429-2
- Miltner, R.J. and Rankin, E.T. (1998) Primary nutrients and the biotic integrity of rivers and streams. Freshwater Biology, 40, 145-158. doi:10.1046/j.1365-2427.1998.00324.x