Open Journal of Statistics
Vol.4 No.6(2014), Article ID:49248,10 pages
DOI:10.4236/ojs.2014.46046
Student’s Academic Efficacy or Inefficacy? An Example on How to Evaluate the Psychometric Properties of a Measuring Instrument and Evaluate the Effects of Item Wording
João Maroco1*, Ana Lúcia Maroco1, Juliana Alvares Duarte Bonini Campos2*
1Unidade de Investigação em Psicologia e Saúde, Instituto Superior de Psicologia Aplicada (ISPA), Lisboa, Portugal
2Departamento de Odontologia Social, Faculdade de Odontologia de Araraquara, UNESP, Universidade Estadual Paulista, Araraquara, Brazil
Email: *jpmaroco@ispa.pt, *jucampos@fcfar.unesp.br
Copyright © 2014 by authors and Scientific Research Publishing Inc.
This work is licensed under the Creative Commons Attribution International License (CC BY).
http://creativecommons.org/licenses/by/4.0/


Received 28 May 2014; revised 3 July 2014; accepted 17 July 2014
ABSTRACT
This study evaluated the effect of item inversion on the construct validity and reliability of psychometric scales and proposed a theoretical framework for the evaluation of the psychometric properties of data gathered with psychometric instruments. To this propose, we used the Maslach Burnout Inventory, which is the most used psychometric inventory to measure burnout in different professional context (Students, Teachers, Police, Doctors, Nurses, etc…). The version of the MBI used was the MBI-Student Survey (MBI-SS). This inventory is composed of three key dimensions: Exhaustion, Cynicism and Professional Efficacy. The two first dimensions—which have positive formulated items—are moderate to strong positive correlated, and show moderate to strong negative correlations with the 3rd dimension—which has negative formulated items. We tested the hypothesis that, in college students, formulating the 3rd dimension of burnout as Inefficacy (reverting the negatively worded items in the Efficacy dimension) improves the correlation of the 3rd dimension with the other two dimensions, improves its internal consistency, and the overall MBI-SS’ construct validity and reliability. Confirmatory factor analysis results, estimated by Maximum Likelihood, revealed adequate factorial fit for both forms of the MBI-SS (with Efficacy) vs. the MBI-SSi (with Inefficacy). Also both forms showed adequate convergent and discriminant related validity. However, reliability and convergent validity were higher for the MBI-SSi. There were also stronger (positive) correlations between the 3 factors in MBI-SSi than the ones observed in MBI-SS. Results show that positively rewording of the 3rd dimension of the MBI-SS improves its validity and reliability. We therefore propose that the 3rd dimension of the MBI-SS should be named Professional Inefficacy and its items should be positively worded.
Keywords:Burnout, Maslach Burnout Inventory—Student Survey, Validity, Reliability, Item Inversion

1. Introduction
Measuring can be defined as a process of encoding characteristics or attributes of objects or people. If it is conducted properly researchers must take into account the objectives, the reliability and validity of the measure which is a function not only of the measuring instrument but also depends on the context, the variables to be assessed and the sample/target population characteristics [1] . Besides the acquisition of information about the characteristics/attributes investigated, the measuring act requires that the researcher adopts a responsible and ethical position, since every measure consists of true value and random error (Classical Theory of Measurement), and no psychometric measuring instrument per se can be considered valid or reliable. Therefore information about the quality of the data should be presented every time a psychometric instrument is used to measure some construct.
To assess the quality of information, the validity and reliability of the data must be evaluated. This process becomes especially challenging when the measurement of latent variables that are not directly observable or measured against a “gold-standard” is involved [2] . That is the case of several medical and psychiatric variables (e.g., stress, depression, anxiety, cognitive complains, pain, etc…). This type of variables required the construction of scales and measuring instruments that are solid grounded in theoretical models which relate the construct or latent variable to its observed manifestations in a proper valid and reliable way [3] . Psychometric scales are the most common measuring instruments used to assess latent variables in the Social and Health Sciences. Even so, the reporting of the psychometric properties of the data gathered with these instruments has been neglected in most studies. This fact may compromise the data analysis and conclusions reached [4] -[6] . It also need to be highlighted that, often, in the literature it is stated that the validity and reliability are properties of the measuring instrument which is a misnomer, since these are properties of the data gathered with the instrument when applied to a sample and in specific context and not of the instrument per se [7] . So, whenever these contexts are changed the validity and reliability of the data need to be re-estimated and therefore establishing the psychometric properties of an instrument is a time consuming, and always necessary dynamic process. The lack of familiarity of both researchers and practioners in the specific areas of statistics/psychometrics required to estimate validity and reliability of the data can be one of the causes of the problems reported.
Several statistical methodological approaches have been proposed to evaluate the psychometric properties of data. Some are based on simple bivariate correlations, while others are supported by complex Item Response Theory (IRT) or Structural Equation Modelling (SEM). Nowadays, the most usual method to estimate the psychometric properties of data gathered by a measuring instrument resort to SEM. [3] [8] -[12] . Despite the several different technics that can be used, the simple bivariate correlational analysis has been losing interest as compared to more advanced techniques, like SEM, since as pointed out by Kane [13] and Pais-Ribeiro [1] , psychometric evaluation requires the development of a strong and explicit theory about the underlying concept/construct to be studied.
This study aims to present the SEM based steps of analysis that should be used to assess the validity and reliability of data gathered with a psychometric scale using the theoretical validity and reliability framework proposed by Anastasi et al. [5] . We also evaluated the effects of negative vs. positive item wording in the psychometric properties of data gathered with scales that use both formats. For that end, we used the Maslach Burnout Inventory—Student Survey. Student Burnout, as assessed by the Maslach Burnout Inventory-Student Survey (MBI-SS), was originally proposed as a tri-factorial syndrome associated with high Emotional Exhaustion (EX), high Cynicism/disbelief (CY) in one’s college studies and low Professional Efficacy (EF) [14] .
Our results suggest that in college students Inefficacy is better correlated with Exhaustion and Cynicism than Efficacy when estimation the correlation of Burnout’s 3 sub-scales. Our data support the observation that psychometric properties not only dependent on the instrument used, the context where it’s used, but also on how the items are formulated.
2. Methods
2.1. Sample Design and Participants
A cross-sectional study was performed. The minimum required sample size was estimated
accordingly to Hair et al. [15]
which recommends the use of at least 5 subjects per parameter to be estimated in
the model, for
 and power of 80%. The study included 268 students from Brazilian
 and Portuguese
 universities. The average age was 21.0
 year and 77% were female. Of the students, 82% were enrolled in public universities,
63% was majoring in health sciences, 33% in social sciences and humanities and 4%
in biological sciences.
year and 77% were female. Of the students, 82% were enrolled in public universities,
63% was majoring in health sciences, 33% in social sciences and humanities and 4%
in biological sciences.
2.2. Measuring Instrument
The Portuguese Maslach Burnout Inventory—Student Survey (MBI-SS) were transculturally validated for both Brazilian and Portuguese students by Campos and Maroco [16] . The Portuguese version of the MBI-SS is composed by 15 ordinal items (0-never to 6-always) defining 3 sub-scales (Emotional Exhaustion—EX, Cynicism— CY and Professional Efficacy—EF). In its original formulation [14] the Efficacy dimension has its items positively worded (e.g., item 3—In my opinion, I am a good student) while Emotional Exhaustion and Cynicism are composed by negatively worded items (e.g., item 1—I feel emotionally drained by my studies and item 7—I have become less enthusiastic about my studies, respectively). In our study, two forms of the MBI-SS were used. The one with the Efficacy as the 3rd dimension with original formulated items and a new MBI-SS where the items in the 3rd dimension were negatively worded to give raise to the Inefficacy (INEF) dimension as proposed also by Bresó et al. [17] . The Portuguese version was translated independently by the authors of this study and retro translated by a bilingual psychologist who had no knowledge of the original versions of the MBI-SS. The MBI with the Inefficacy dimension was named MBI-SSi as opposed to the common MBI-SS (with Efficacy as the 3rd dimension).
2.3. Procedures
Participants completed the instruments in the classroom, on a schedule agreed beforehand. Students were informed that their participation was voluntary, that no personnel information that could be used to identify them was required and that they could drop out of the study at any time without consequences. The MBI-SS and MBISSi instruments were completed separately, with one week interval between fills. The order of presentation of the MBI-SS and MBI-SSi was randomly assigned. The present study followed the ethical precepts dictated by Resolution 196/96 of the Brazilian National Health Council and the UIPES-ISPA’s Ethics committee.
2.4. Data Analysis
While recognizing other frameworks for Psychometric data analysis (e.g. Nunnaly and Bernstein [18] , American Educational Research Association (AERA), American Psychological Association (APA) and National Council on Measurement in Education (NCME) [19] , etc....), the psychometric properties analysis framework in this study follow the proposal presented by Anastasi et al. [5] , Hair et al. [15] , Kline [20] and Maroco [11] as described next.
2.5. Distributional Properties
Distributional properties of the items from the MBI-SS and MBI-SSi were assessed by Skewness (Sk) and Kurtosis (Ku) measures. Absolute values of Sk and Ku larger than 7 and 3 respectively [11] [20] were indicative of significant deviation from normality recommending against its use in further psychometric analysis since they deviate strongly form the normal distribution, which is expected if the item is a manifestation of a population’s construct. Outliers were diagnosed with the Squared Mahanalobis distance. Values greater than 4 were assumed to be multivariate outliers [11] .
2.6. Construct Related Validity
Construct related validity was assessed by means of factorial validity, convergent and discriminant validity as described next.
2.7. Factorial Related Validity
To access the extent in which the items are good manifestations of their theoretical
constructs, a confirmatory factor analysis (CFA) was conducted. CFA is equivalent
to the measuring model of SEM. It lays out the linear structural relationships between
a theoretical latent construct and its observed manifestations (for a review on
SEM, see e.g. Bollen, 1989 or Maroco, 2014). The maximum likelihood estimation method
was used on the Pearson correlation matrix. To assess the goodness of fit the following
indices and reference values [11]
[20] -[22]
were used:
 (chi-square over degrees of freedom; should be smaller
than 3 - 5), CFI (comparative fit index), TLI (Tucker-Lewis index), GFI (goodness
of fit index) which should all be greater than 0.95 and RMSEA (root mean square
error of approximation) which should be smaller than 0.08. At least one index from
the 3 main indices families (absolute, relative and population discrepancy was used).
(chi-square over degrees of freedom; should be smaller
than 3 - 5), CFI (comparative fit index), TLI (Tucker-Lewis index), GFI (goodness
of fit index) which should all be greater than 0.95 and RMSEA (root mean square
error of approximation) which should be smaller than 0.08. At least one index from
the 3 main indices families (absolute, relative and population discrepancy was used).
Modification indices, estimated through the Lagrange multipliers (LM) were used
to investigate possible correlations between measurement errors. LM greater than
11
 were assumed to indicate significant correlations which could be added to the model
if theoretically justifiable [11]
.
were assumed to indicate significant correlations which could be added to the model
if theoretically justifiable [11]
.
2.8. Convergent Related Validity
The factors’ convergent related validity assess if the items which are manifestation
of the scale converge on that scale or factor. If that is the case, then the scale
explains a large percentage of the items’ variance. Accordingly to Fornell and Larcker
[23] the Average Variance Extracted (AVE)
as defined by (1) can be used to evaluate convergent validity. AVE greater than
0.5 is indicative of the factors’ convergent validity
[15] . Accordingly to Maroco [11]
the AVE for a
 factor can be estimated by its
 items’ standardized factor weights
 as:
as:
 (1)
(1)
Using the same , the Construct reliability
can be estimated by:
, the Construct reliability
can be estimated by:
 (2)
(2)
where can be estimated as .
.
Accordingly to Hair et al. [15]
 and
and
 are indicative of construct convergent related validity. For exploratory research,
values below 0.7 are generally acceptable [15]
.
are indicative of construct convergent related validity. For exploratory research,
values below 0.7 are generally acceptable [15]
.
2.9. Discriminant Validity
Discriminant related validity assess if different factors evaluate different constructs.
Accordingly to Fornell and Larcker [23] ,
if the AVE from every two constructs is larger than the squared Pearson Correlation
 between the constructs, than the variance explained by one of the constructs as
predictor of the other is smaller than the variance that the construct explains
of its manifest items. Therefore, two constructs
between the constructs, than the variance explained by one of the constructs as
predictor of the other is smaller than the variance that the construct explains
of its manifest items. Therefore, two constructs
 and
and
 show discriminant related validity if
 and
and
 are both larger that
 .
.
2.10. Reliability
The reliability of a construct can be assessed by three different properties: Stability,
Equivalence and Internal consistency [24]
. The Stability evaluates how well the measure retains its properties along time.
This is generally observed by strong test-retest correlations, interclass correlation
coefficients or Cohen’s K. Equivalence refers to strong correlations with similar
constructs, or the two split-halfs of the same construct, evaluated by means of
Pearson correlations. The internal consistency is by far the most used measure of
reliability. It evaluates how consistent a set of items are as manifestations of
a given construct, that is how much of construct true variance is captured by the
items (scale) used to measure it. Cronbach’s alpha is the most used estimate for
internal consistency [24] . For scales
with different type of items the standardized Cronbach
 is given by
 (3)
(3)
where
 is the number of items in the scale and
 is the average correlation between the
 items. When psychometric inventories have more than one scale it is recommend to
calculate the Stratified Cronbach’s
items. When psychometric inventories have more than one scale it is recommend to
calculate the Stratified Cronbach’s
 [24] :
 (4)
(4)
where
 is the variance of items in the
 factor,
 is the variance of the sum of the items and
 is the alpha estimate for factor
 .
.
2.11. Second Order Hierarchical Factors
When the first order factors show moderate to strong correlation and a high hierarchical
factor is theoretically justifiable, a second order factor can be tested by CFA.
The significance of the standardized structural weights
 between the 2nd order factor and the 1st order factors can be used to evaluate the
relative contribution of the first order factors as facets of the higher order factor.
between the 2nd order factor and the 1st order factors can be used to evaluate the
relative contribution of the first order factors as facets of the higher order factor.
2.12. Statistical Analysis
Statistical analyses were performed using IBM SPSS Statistics (v.22, SPSS An IMB Company, Chicago, IL) and AMOS 22.0 (SPSS Inc., Chicago, IL) software.
3. Results
3.1. Distributional Properties
Descriptive statistics and asymmetry and kurtosis statistics of the items from MBI-SS and MBI-SSi are given in Table1 None of the items from either MBI-SS or MBI-SSi showed descriptive and distribution statistics which showed considerable deviation from the normal distribution. Its use in further psychometric data analysis was therefore recommended.
3.2. Factorial Related Validity
Figure 1 give the structural CFA models for both
MBI-SS and MBI-SSi fitted to the study sample. Both the MBI-SS ( = 2.267; GFI = 0.910; CFI
= 0.943; TLI = 0.930; RMSEA = 0.069) and the MBI-SSi (
= 2.267; GFI = 0.910; CFI
= 0.943; TLI = 0.930; RMSEA = 0.069) and the MBI-SSi ( = 3,017; GFI = 0.883; CFI
= 0.936; TLI = 0.922; RMSEA = 0.087) show acceptable goodness-of-fit to the items’
variance-covariance matrixes. On general, items from the INEF dimension have larger
standardized factor loadings that their similar items from EF.
= 3,017; GFI = 0.883; CFI
= 0.936; TLI = 0.922; RMSEA = 0.087) show acceptable goodness-of-fit to the items’
variance-covariance matrixes. On general, items from the INEF dimension have larger
standardized factor loadings that their similar items from EF.
3.3. Convergent and Discriminant Related Validity and Reliability
Table 2 gives the estimated AVE, CR squared Pearson
correlations and Cronbach’s
 for both MBI-SS and MBI-SSi.
Accordingly to Fornell and Larcker [23] all factors
show both adequate convergent and discriminant validity. Accordingly to Cronbach
 all factors show high reliability.
Figure 2 shows the structural analysis of MBI-SS and MBI-SSi with Burnout as a 2nd order factor. Acceptable

Table 1 . Descriptive statistics, Skewness and Kurtosis for the MBI-SS items and MBI-SSi (Brasil/Portugal, 2013) (Note: Short forms of items are given just for content illustration proposes. Full items are copyrighted by Mind Garden Inc.)
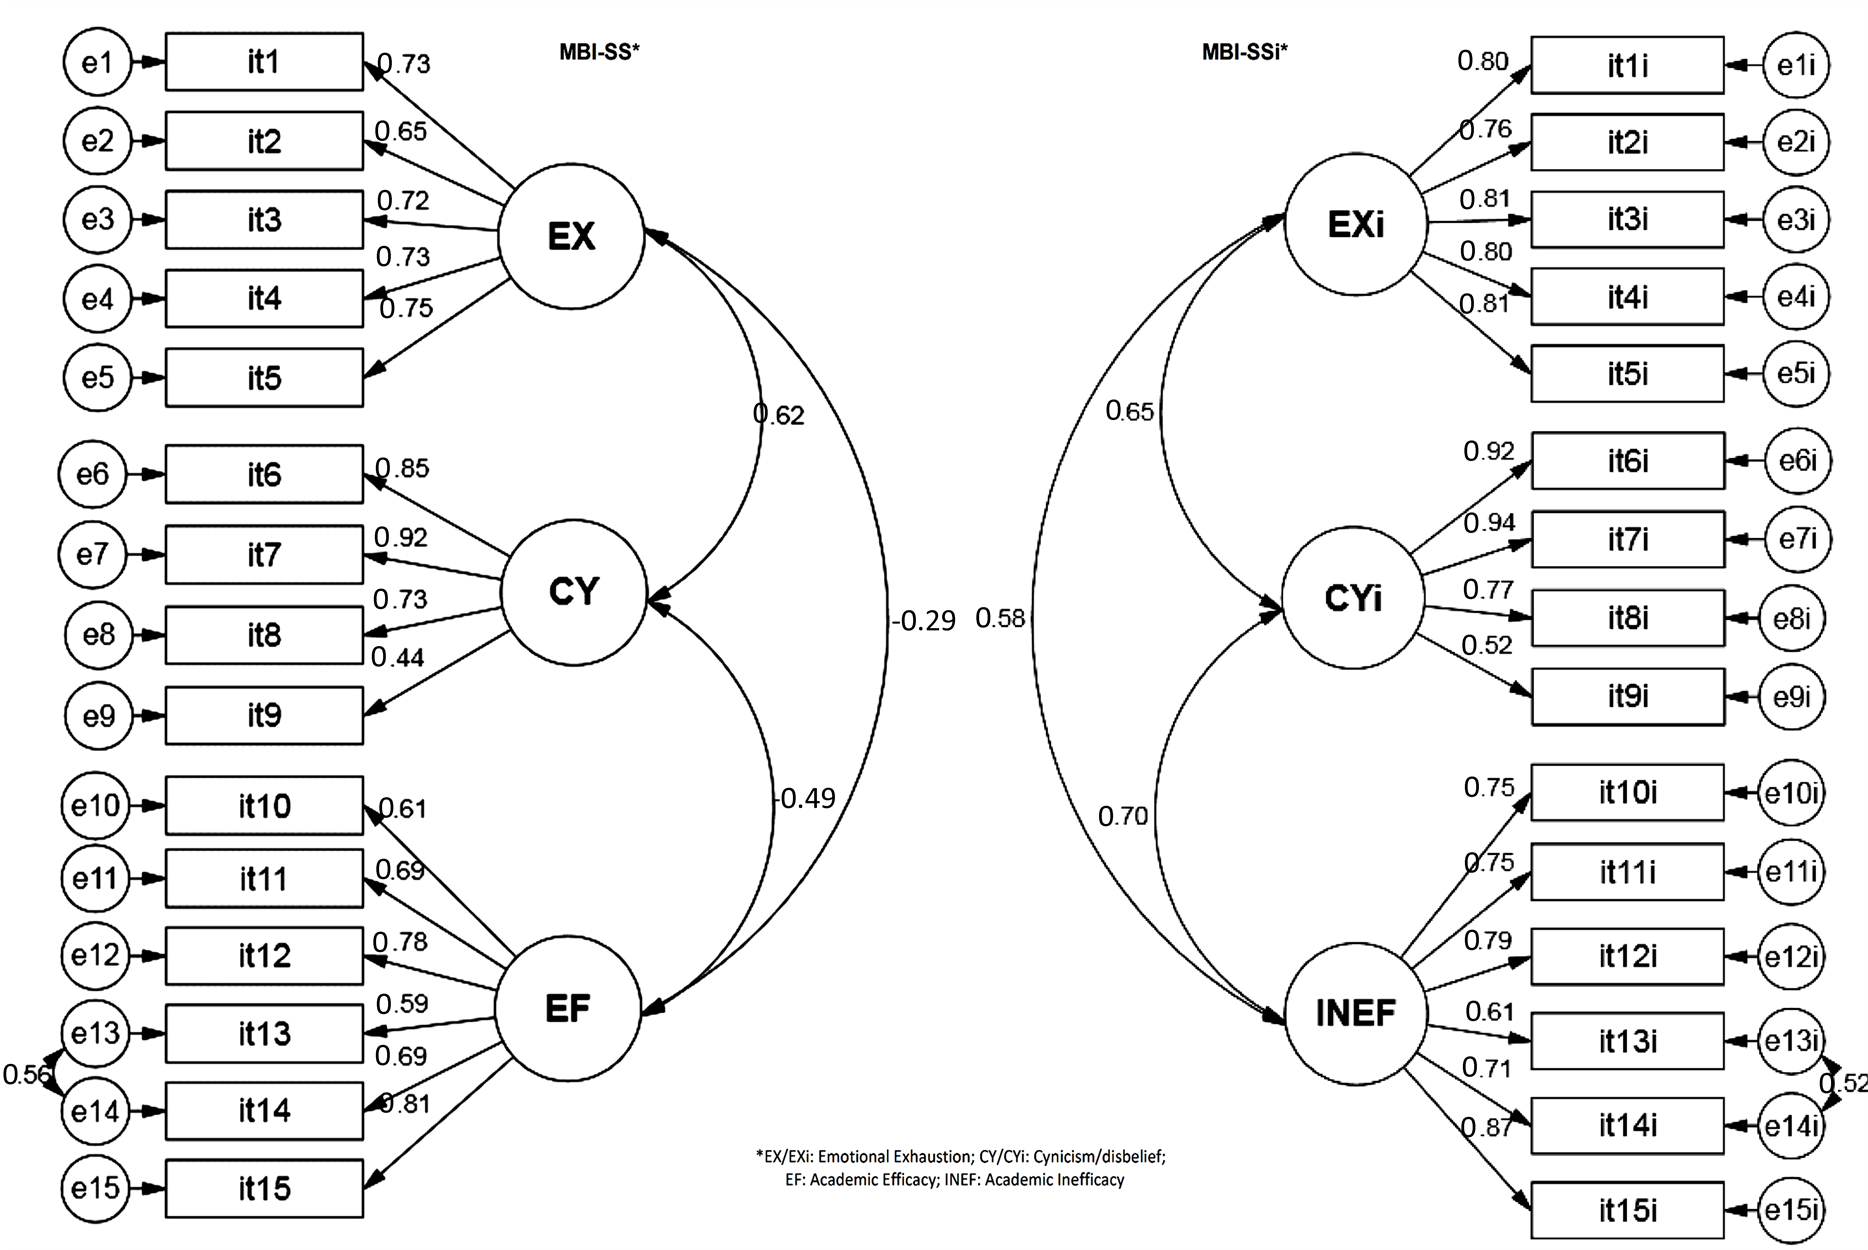
Figure 1. Structural CFA
models for MBI-SS and MBI-Ssi. Values are the standardized factor weight
 and correlations between factors
 .
.
Table 2. Average variance
extracted (AVE), composite reliability (CR), coefficient of determination
 and Cronbach’s alpha coefficient
 for both MBI-SS and MBI-SSi.
goodness-of-fit was observed for the global model ( = 3.327; GFI = 0.758; CFI
= 0.833; TLI = 0.816; RMSEA = 0.093)
= 3.327; GFI = 0.758; CFI
= 0.833; TLI = 0.816; RMSEA = 0.093)
It is worthwhile to notice the perfect correlation between the 2nd order Burnout factor defined by both MBISS and MBI-SSi. However, the standardized structural weight of Burnout to INEF is much larger and positive
 that the similar weight to EF which was smaller and negative
 . That is rewording the items of the 3rd Burnout dimension
increased both first order loadings and second order structural weights between
the INEF and its items, and Burnout and INEF respectively.
. That is rewording the items of the 3rd Burnout dimension
increased both first order loadings and second order structural weights between
the INEF and its items, and Burnout and INEF respectively.
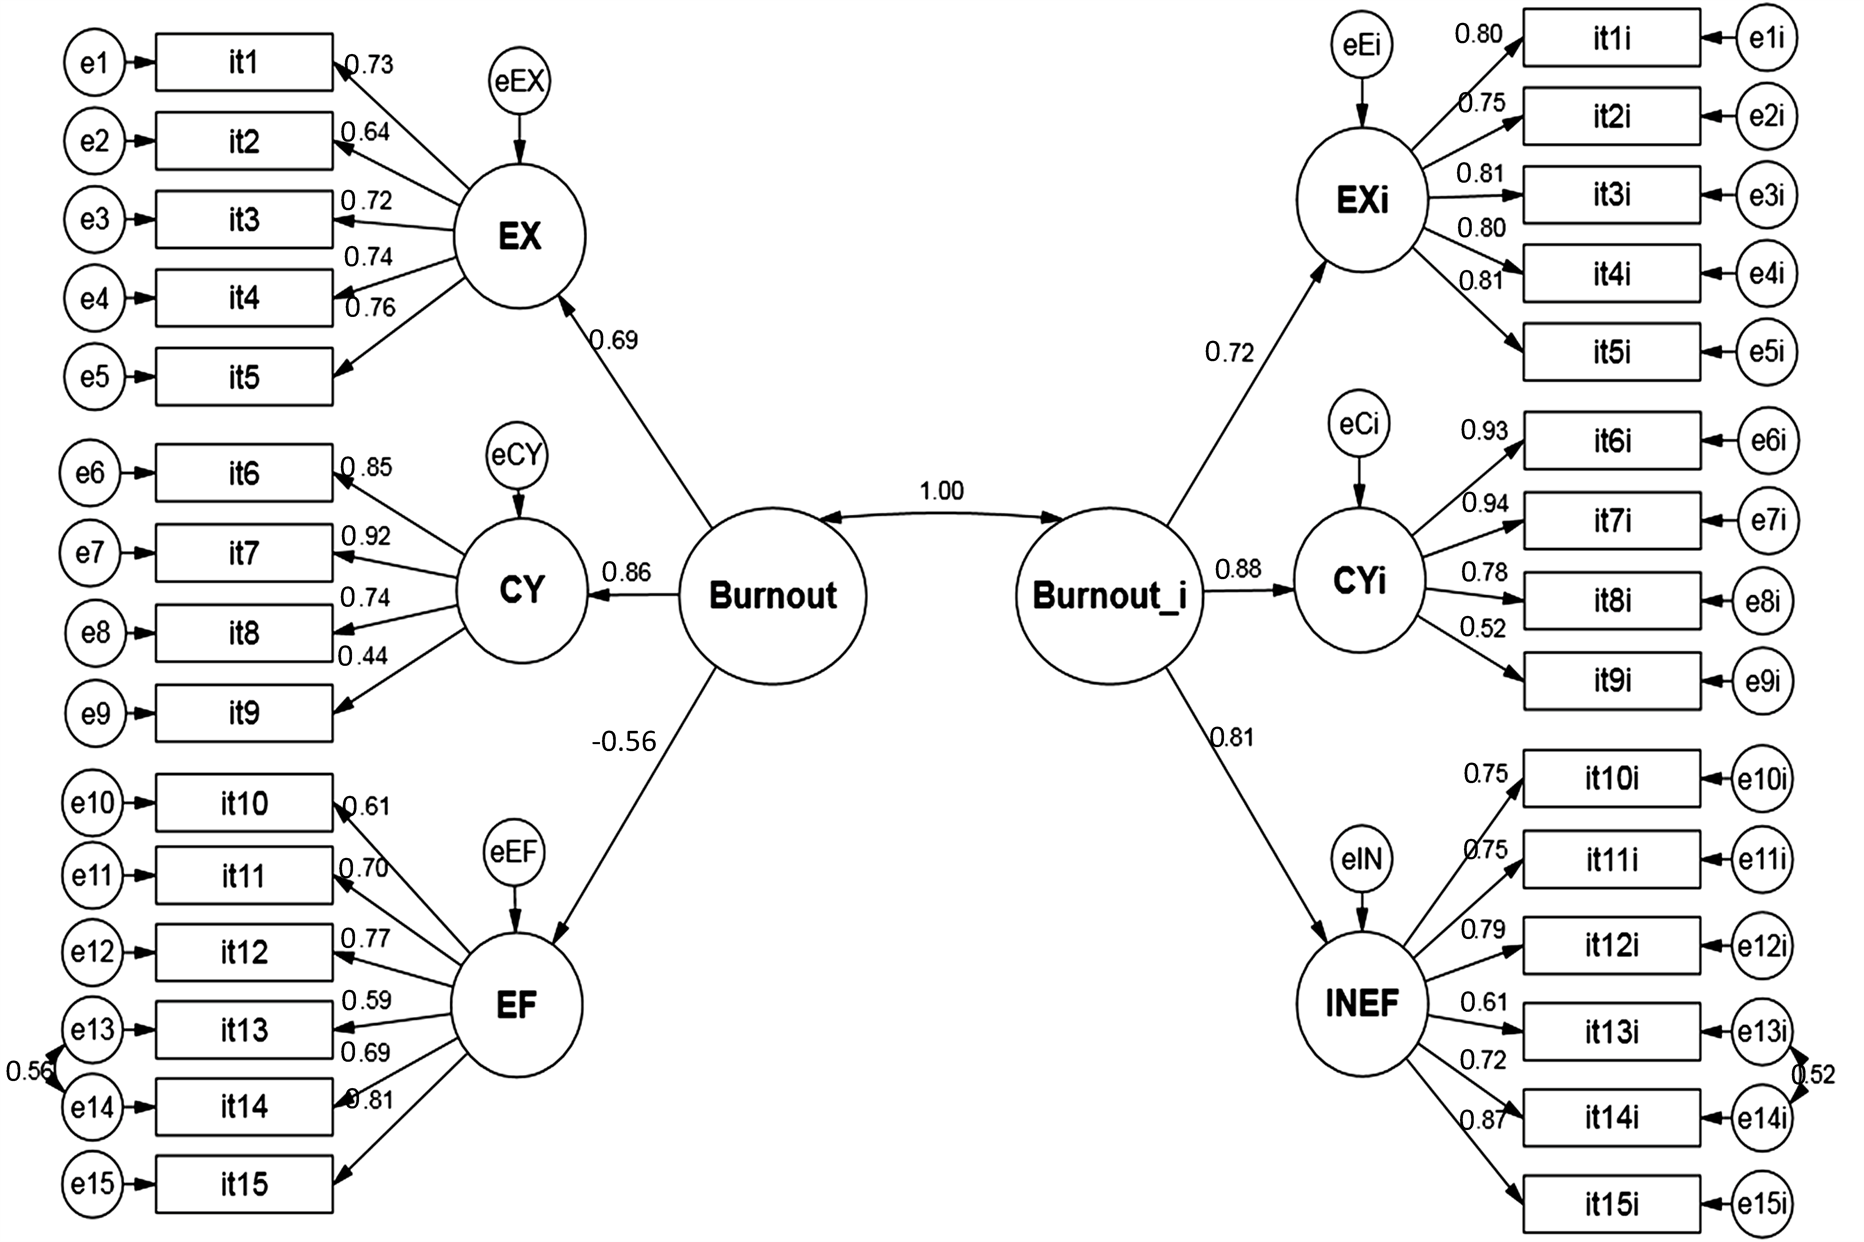
Figure 2. Second order hierarchical model of Burnout reflected both in EX, CY and EF as well as EXi, CYi and Exi fitted to both Brazilian and Portuguese college students.
4. Discussion
Given the ubiquitous use of latent variables in the social and health sciences, the assessment of the psychometric properties of the measuring instrument that operationalizes these latent variables or constructs is fundamental when these instruments are used with new data samples, to accurately estimate the data’s validity and reliability. Thus, in this paper we suggest a series of analysis required to estimate the construct validity and reliability using structural equation modeling. We exemplify this analysis by studying the psychometric properties of the Maslach Burnout Inventory applied to Brazilians and Portuguese university students considering two theoretical proposals. The first used the original MBI-SS formulation with about 2/3 of the items worded negatively and 1/3 worded positively; the second version (MBI-SSi) used all the items with the same, negative, wording.
The choice of structural equation analysis to evaluate the psychometric characteristics of the instrument and the data gathered with it was guided by the fact that this technique is an extension of generalized linear models that considers measurement errors associated with the latent variables under study. It also allows for the fit of theoretical models established a priori to different samples and contexts involving both latent and manifest variables [11] . This study come in due time with recent publications in the Health and Social Sciences that point out the need to review the psychometric properties of the instruments used in research, which must be submitted jointly to the data psychometric evaluation, since results gathered with this type of instruments can only lead to relevant conclusions if the instrument produces reliable and valid data in the study sample. Unfortunately, this recommendation is usually neglected in investigations in the health sciences or performed superficially, thus compromising the quality of the results and conclusions presented [25] .
The analysis of the type of different items’ wording, in the same instrument, revealed that, as far as the Burnout construct as, estimated by using the MBI-SS, Efficacy is a lesser manifestation of Burnout than Inefficacy (standardized regression weights were −0.56 vs. 0.81 respectively) (Figure 2). INEF also correlates stronger with EX and CY than EF does. Positive wording of EF items may cause an artifact in measuring burnout due to the fact that 2/3 of the items are worded negatively and 1/3 are worded positively. Hallo effects may explain this artifact; but also item’s perception due to positive wording may be associated with a positive emotional state rather than a negative perceived burnout condition. This fact may also be explained by stereotypes regarding the items wording and patterns associated in response to a previous observed pattern. That is, students, started answer in one direction and failed to perceive that the item’s direction was changed along the scale leading to misleading answers [26] [27] . Reliability and validity of the MBI-SSi was also slightly higher than of the MBI-SS. Similar results were reported by Bresó et al. [17] with Dutch and Spanish students. These results and results in our study show that when items are worded in the same conceptual direction better convergent validity and reliability was observed.
The tri-factorial structure of the different formats of the MBI has been criticized in aid-related professions. Therefore, other burnout inventories (e.g., OLBI, CBI,…) have proposed a bi-factorial conceptualization of burnout constituted only by Exhaustion and Cynicism. Negative correlations of Exhaustion and Cynicism with Efficacy have leaded the criticism to the 3-factor structure of the MBI and some scholars have proposed that low efficacy is a consequence and not a dimension of Burnout [28] [29] . More recently, Bresó et al. [17] and Schaufeli and Salanova [30] challenged this 2-factor structure conceptualization and proposed that Inefficacy (INEF), assessed by negatively rephrasing the positively worded MBI-GS and MBI-SS efficacy items, is the 3rd burnout dimension. In a sample of Dutch and Spanish students they show that the absolute correlations of EX and CY are higher with INEF than with EF. Simbula and Guglielmi [31] also evaluated the effect of reverting the EF items in teachers and concluded that INEF beliefs relate more strongly to the other burnout dimensions (EX and CY) than EF. Taken together, our observations and data from these authors favour and recommend the use of the inefficacy scale as the “third dimension” of burnout, rather than the efficacy scale. Thus, considering the underlying burnout construct theory and the analysis of construct related validity and reliability of the MBI-SS evaluated on both the original format as well as in new format where the items from Efficacy were reverted to produce a 3rd dimension we termed Inefficacy format. Respecting the theoretical framework of Burnout by Schaufeli, Leiter and Maslach [32] , by rewording 1/3 of the items it is possible to improve the psychometric properties of the MBI.
This study aimed also at setting a layout for psychometric data evaluation, paying due attention to item format and wording, for statisticians who have no or little previous experience with psychometric evaluation, especially in the health sciences. A strong theoretical background support regarding the construct is recommended alongside with statistical techniques, like SEM, which can easily produce results required to attest psychometric data validity and reliability.
5. Conclusion
Item wording affects the psychometric properties of data gathered with instruments with items formulated both with positive and negative wording. For example, for the MBI-SS, formulating the 3rd dimension of burnout as inefficacy improves the MBI-SS psychometric properties, namely construct reliability and validity, in a sample of Portuguese speaking students. Psychometric data properties, which are a characteristic of the data collected with a given psychometric measurement instrument, can easily be evaluated by SEM following the theoretical framework described in this paper.
References
- Pais-Ribeiro, J.L. (2013) Medida na Avaliação Psicológica. Psicologia, Saúde & Doenças, 14, 245-263.
- Borsboom, D. and Mellenbergh, G.J. (2002) True Scores, Latent Variables, and Constructs: A Comment on Schmidt and Hunter. Intelligence, 30, 505-514. http://dx.doi.org/10.1016/S0160-2896(02)00082-X
- Bollen, K.A. (2002) Latent Variables in Psychology and the Social Sciences. Annual Review of Psychology, 53, 605-634. http://dx.doi.org/10.1146/annurev.psych.53.100901.135239
- Zucoloto, M.L., et al. (2014) Psychometric Properties of the Oral Health Impact Profile and New Methodological Approach. Journal of Dental Research, 93, 645-650. http://dx.doi.org/10.1177/0022034514533798
- Anastasi, A. (1988) Psychological testing. 6th Edition, Macmillan Publishing Company, New York.
- Streiner, D.L. and Norman, G.R. (2008) Health Measurement Scales: A Practical Guide to Their Development and Use. 4th Edition, Oxford University Press, New York. http://dx.doi.org/10.1093/acprof:oso/9780199231881.001.0001
- Campos, J.A.D.B., Bonafé, F.S.S., Dovigo, L.N. and Maroco, J. (2013) Avaliação Psicométrica da Escala de Atitudes em Relação à Estatística. Revista Brasileira de Biometria, 31, 327-337.
- Hambleton, R.K., Swaminathan, H. and Rogers, H.J. (1991) Fundamentals of Item Response Theory. Sage, Newbury Park, CA.
- Muthén, B. (1984) A General Structural Equation Model with Dichotomous, Ordered Categorical, and Continuous Latent Variable Indicators. Psychometrika, 49, 115-132. http://dx.doi.org/10.1007/BF02294210
- Muthén, L.K. and Muthén, B. (2001) Mplus: Statistical Analysis with Latent Variables, User’s Guide. Muthén & Muthén, Los Angeles.
- Maroco, J. (2014) Análise de Equações Estruturais. 2nd Edition, Report Number, Lisboa.
- Elosua, P. and Iliescu, D. (2012) Tests in Europe: Where We Are and Where We Should Go. International Journal of Testing, 12, 157-175. http://dx.doi.org/10.1080/15305058.2012.657316
- Kane, M. (2013) Validating the Interpretations and Uses of the Test Scores. Journal of Educational Measurement, 50, 1-73. http://dx.doi.org/10.1111/jedm.12000
- Schaufeli, W.B., Martinez, I.M., Pinto, A.M., Salanova, M. and Bakker, A.B. (2002) Burnout and Engagement in University Students—A Cross-National Study. Journal of Cross-Cultural Psychology, 33, 464-481. http://dx.doi.org/10.1177/0022022102033005003
- Hair, J.F., Black, W.C., Babin, B., Anderson, R.E. and Tatham, R.L. (2005) Multivariate data analysis. 6th Edition, Prentice Hall, Upper Saddle River.
- Campos, J.A.D.B. and Maroco, J. (2012) Maslach Burnout Inventory—Student Survey: Portugal-Brazil Cross-Cultural Adaptation. Revista de Saúde Pública, 46, 816-824. http://dx.doi.org/10.1590/S0034-89102012000500008
- Bresó, E., Salanova, M. and Schaufeli, W. (2007) In Search of the “Third Dimension” of Burnout: Efficacy or Inefficacy? Applied Psychology, 56, 460-478. http://dx.doi.org/10.1111/j.1464-0597.2007.00290.x
- Nunnally, J.C. and Bernstein, I.H. (1994) Psychometric Theory. 3rd Edition, McGraw-Hill, New York.
- AERA, APA and NCME (1999) The Standards for Educational and Psychological Testing. Aera Publication, Washington DC.
- Kline, R.B. (1998) Principles and Practice of Structural Equation Modeling. The Guilford Press, New York.
- Bollen, K.A. (1989) Structural Equations with Latent Variables. John Wiley & Sons, New York.
- Byrne, B.M. (2001) Structural Equation Modeling with Amos: Basic Concepts, Applications and Programming. Lawrence Erlbaum Associates, New Jersey.
- Fornell, C. and Larcker, D.F. (1981) Evaluating Structural Equation Models with Unobservable Variables and Measurement Error. Journal of Marketing Research, 18, 39-50. http://dx.doi.org/10.2307/3151312
- Maroco, J. and Garcia-Marques, T. (2006) Qual a fiabilidade do alfa de Cronbach? Questões antigas e soluções modernas? Laboratório de Psicologia, 4, 65-90.
- Batista-Foguet, J.M., Coenders, G. and Alonso, J. (2004) Análisis factorial confirmatorio. Su utilidad en la validación de cuestionarios relacionados con la salud. Medicina Clinica, 122, 21-27. http://dx.doi.org/10.1157/13057542
- Yeh, W.Y., Cheng, Y., Chen, C.J., Hu, P.Y. and Kristensen, T.S. (2007) Psychometric Properties of the Chinese Version of Copenhagen Burnout Inventory among Employees in Two Companies in Taiwan. International Journal of Behavioral Medicine, 14, 126-133. http://dx.doi.org/10.1007/BF03000183
- Campos, J.A.D.B., Carlotto, M.S. and Maroco, J. (2013) Copenhagen Burnout Inventory—Student Version: Adaptation and Transcultural Validation for Portugal and Brazil. Psicologia: Reflexão e Crítica, 26, 87-97. http://dx.doi.org/10.1590/S0102-79722013000100010
- Halbesleben, J.R.B. and Demerouti, E. (2005) The Construct Validity of an Alternative Measure of Burnout: Investigating the English Translation of the Oldenburg Burnout Inventory. Work and Stress, 19, 208-220. http://dx.doi.org/10.1080/02678370500340728
- Kristensen, T.S., Borritz, M., Villadsen, E. and Christensen, K.B. (2005) The Copenhagen Burnout Inventory: A New Tool for the Assessment of Burnout. Work and Stress, 19, 192-207. http://dx.doi.org/10.1080/02678370500297720
- Schaufeli, W.B. and Salanova, M. (2007) Efficacy or Inefficacy, That’s the Question: Burnout and Work Engagement, and Their Relationships with Efficacy Beliefs. Anxiety, Stress and Coping, 20, 177-196. http://dx.doi.org/10.1080/10615800701217878
- Simbula, S. and Guglielmi, D. (2010) Depersonalization or Cynicism, Efficacy or Inefficacy: What Are the Dimensions of Teacher Burnout? European Journal of Psychology of Education, 25, 301-314. http://dx.doi.org/10.1007/s10212-010-0017-6
- Schaufeli, W.B., Leiter, M.P. and Maslach, C. (2009) Burnout: 35 Years of Research and Practice. Career Development International, 14, 204-220. http://dx.doi.org/10.1108/13620430910966406
NOTES

*Corresponding authors.