Open Journal of Statistics
Vol.3 No.6A(2013), Article ID:41368,6 pages DOI:10.4236/ojs.2013.36A005
Inference for the Normal Mean with Known Coefficient of Variation
Department of Mathematics and Statistics, York University, Toronto, Canada
Email: yuejiao@mathstat.yorku.ca, hangjing@mathstat.yorku.ca, august@yorku.ca
Copyright © 2013 Yuejiao Fu et al. This is an open access article distributed under the Creative Commons Attribution License, which permits unrestricted use, distribution, and reproduction in any medium, provided the original work is properly cited. In accordance of the Creative Commons Attribution License all Copyrights © 2013 are reserved for SCIRP and the owner of the intellectual property Yuejiao Fu et al. All Copyright © 2013 are guarded by law and by SCIRP as a guardian.
Received November 1, 2013; revised December 1, 2013; accepted December 8, 2013
Keywords: Canonical Parameter; Coverage Probability; Curved Exponential Family; Modified Signed Log Likelihood Ratio Statistic
ABSTRACT
Inference for the mean of a normal distribution with known coefficient of variation is of special theoretical interest because the model belongs to the curved exponential family with a scalar parameter of interest and a two-dimensional minimal sufficient statistic. Therefore, standard inferential methods cannot be directly applied to this problem. It is also of practical interest because this problem arises naturally in many environmental and agriculture studies. In this paper we proposed a modified signed log likelihood ratio method to obtain inference for the normal mean with known coefficient of variation. Simulation studies show the remarkable accuracy of the proposed method even for sample size as small as 2. Moreover, a new point estimator for the mean can be derived from the proposed method. Simulation studies show that new point estimator is more efficient than most of the existing estimators.
1. Introduction
Normal distribution is one of the most widely known and commonly used distributions in statistics. Even in the introductory statistics courses, we discussed inference about the mean of a normal distribution. Usually we assume that the population mean and the population standard deviation are unrelated parameters. However, in many physical and biological applications the population standard deviation is often found to be proportional to the mean. That is, the mean and standard deviation are related. The ratio of the standard deviation to the mean is defined as the coefficient of variation (CV) in statistics. The focus of this paper is to make inference on the normal mean using the extra information on the CV.
In practice, this problem arises more frequently than we might anticipate. For example, in environmental studies, inference about the mean of the pollutant is of special interest. And in those studies, the standard deviation of a pollutant is often assumed to be directly related to the mean of the pollutant (Niwitpong [1]). In agricultural studies, it is customary to conduct multi-location trials. From the results of a few locations, the CV can be calculated and subsequently used as a known value for studying the mean of the experiment conducted in a new location (Bhat and Rao [2]). Brazauskas and Ghorai [3] also give examples of this problem emerging from biological and medical experiments. From the theoretical point of view, estimating a normal mean with known CV is also an interesting problem because it has a scalar parameter but a two-dimensional minimal sufficient statistic. In other words, we have a curved exponential family model, and standard inferential methods cannot be directly applied (see Efron [4]).
In literature, many authors have studied point estimation of a normal mean with known CV. For example, a consistent estimator was obtained by Searls [5] based on truncation of extreme observations. Khan [6] derived the best unbiased estimator with minimum variance. Gleser and Healy [7] obtained the uniformly minimum risk estimator when the loss function is the squared error. Sen [8] proposed a simple and consistent estimator but the proposed estimator is biased. Guo and Pal [9] worked out an estimator based on the scaled quadratic loss function. Chaturvedi and Tomer [10] extended the method in Singh [11] and proposed a three-stage procedure and an accelerated sequential procedure to estimate the normal mean. By various ways of combining the minimal sufficient statistic, Anis [12] proposed three simple but biased estimators. And most recently, Srisodaphol and Tongmol [13] suggested that the estimator based on jackknife technique is preferred as it has the smallest mean square error.
Despite the large literature devoted to point estimation, very few literature is available for interval estimation and hypothesis test for the normal mean with known CV. Hinkley [14] derived two locally most powerful test for right alternatives based on an ancillary statistic. Bhat and Rao [2] examined the likelihood ratio test and the Wald test. Niwitpong [1] proposed two confidence interval for the normal mean based on the work of Searls [5].
In this paper, we extended the approach of Bhat and Rao [2] and proposed the modified signed log-likelihood ratio test for the normal mean with known CV. The proposed method is known to have third-order accuracy. Moreover, a new estimator is obtained from the modified signed log-likelihood ratio statistic.
The rest of the paper is organized as follows. In Section 2, the modified signed log-likelihood ratio method is reviewed. Application of the method to the normal mean with know CV problem is presented in Section 3. Simulation results to illustrate the accuracy of the proposed method are given in Section 4. The overall conclusions are summarized in Section 5.
2. Review of the Modified Signed Log Likelihood Ratio Method
Suppose we have a statistical model  for a response
  with
with  that takes the exponential family model form:
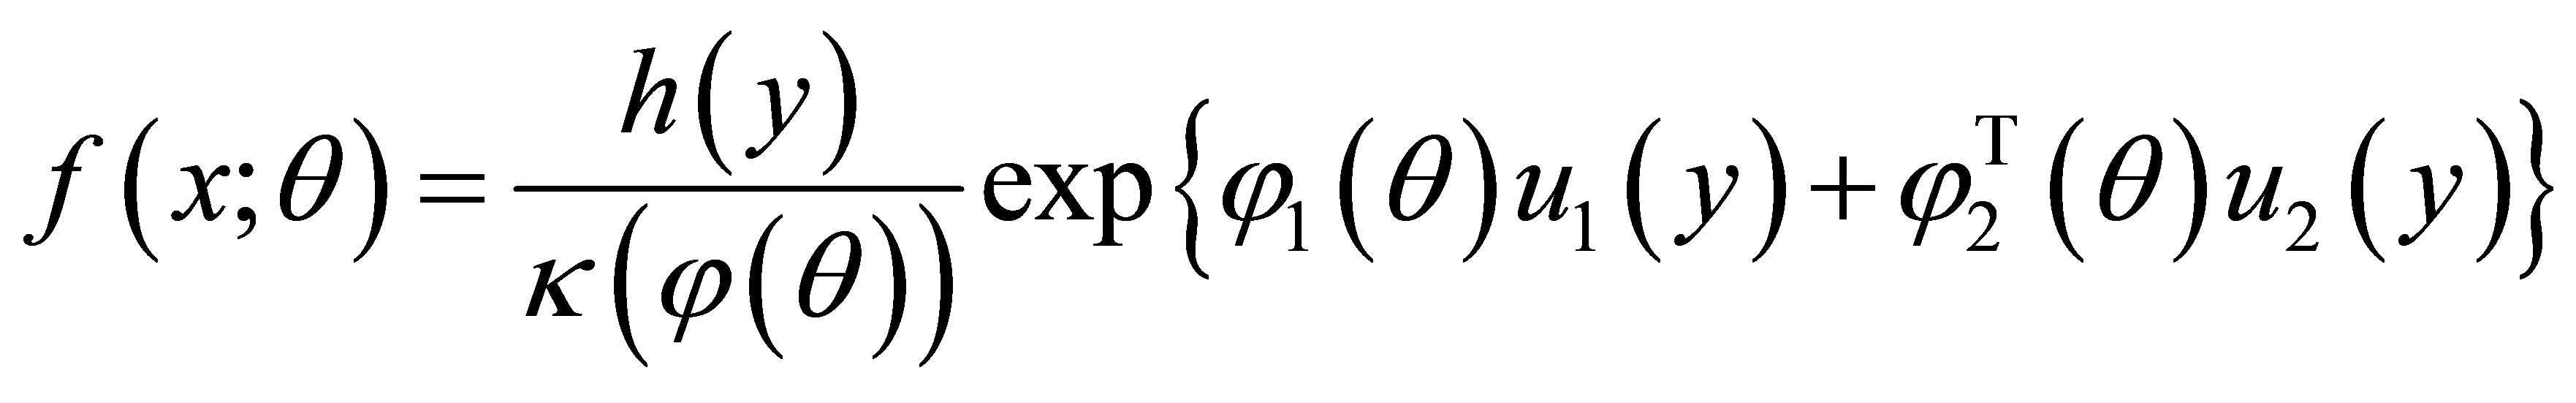 (1.1)
(1.1)
where the canonical parameter  in
in  is one-to-one transformation of
 , and
, and
 in
in  is a minimal sufficient statistic. Let
  be the scalar parameter of interest and
  is a vector of nuisance parameters. Hence, the log-likelihood function is
Fraser, Reid and Wu [15] approximated the p-value function of  with third order accuracy by
 (1.2)
(1.2)
where  is the cumulative distribution of the standard normal distribution,
 (1.3)
(1.3)
 (1.4)
(1.4)
are the signed log-likelihood ratio statistic, and a standardized maximum likelihood departure calculated in the canonical parameter scale, respectively. Here
 is the overall maximum likelihood estimate of
  satisfying
  and
and  is the constrained maximum likelihood estimate of
  for a fixed
  satisfying
  Moreover,
is the observed information matrix evaluated at  and
and
is the nuisance observed information matrix evaluated at . In Equation (1.2),
  is the modified signed loglikelihood ratio statistic as defined in Barndorff-Nielsen [16,17]. It is important to note that
  is invariant to reparameterization, whereas
  is not and has to be calculated in the canonical parameter scale. A
  confidence interval for
  is
is
where  is the
  percentile of the standard normal distribution.
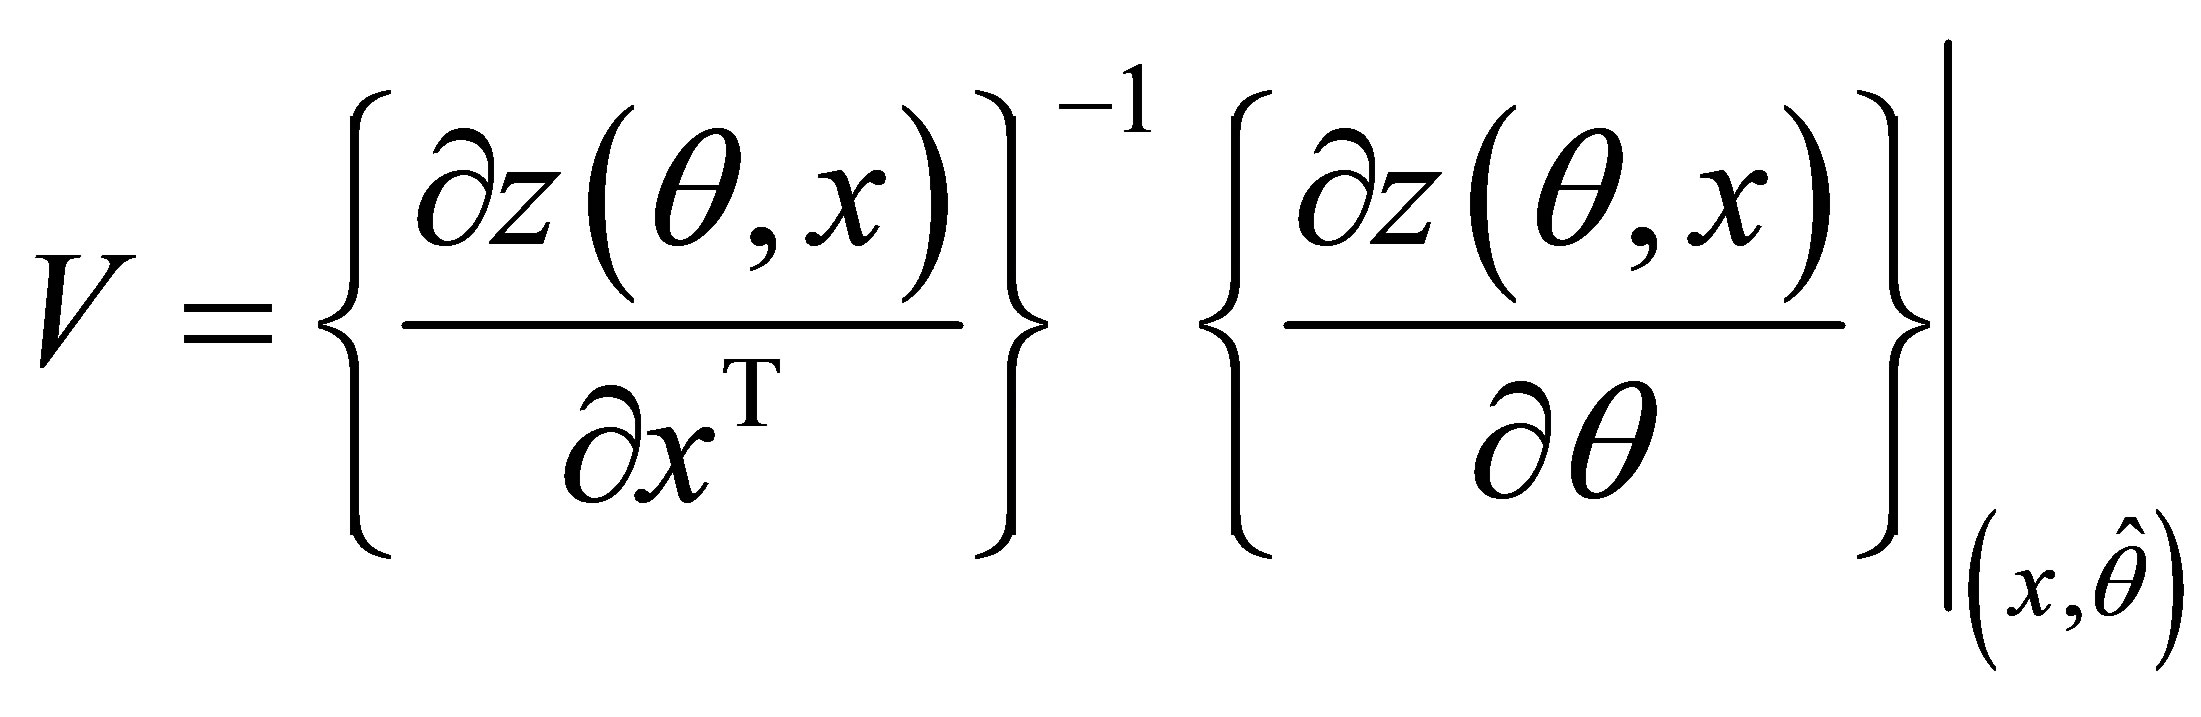
Fraser, Reid and Wong [18] considered the gamma mean problem where the parameter of interest  is not a component of the canonical parameter. In this case, the modified signed log-likelihood ratio method can still be applied with
  given in (1.3) because it is invariant to reparameterization, and
  has to be re-calculated in the canonical parameter scale and it takes the form
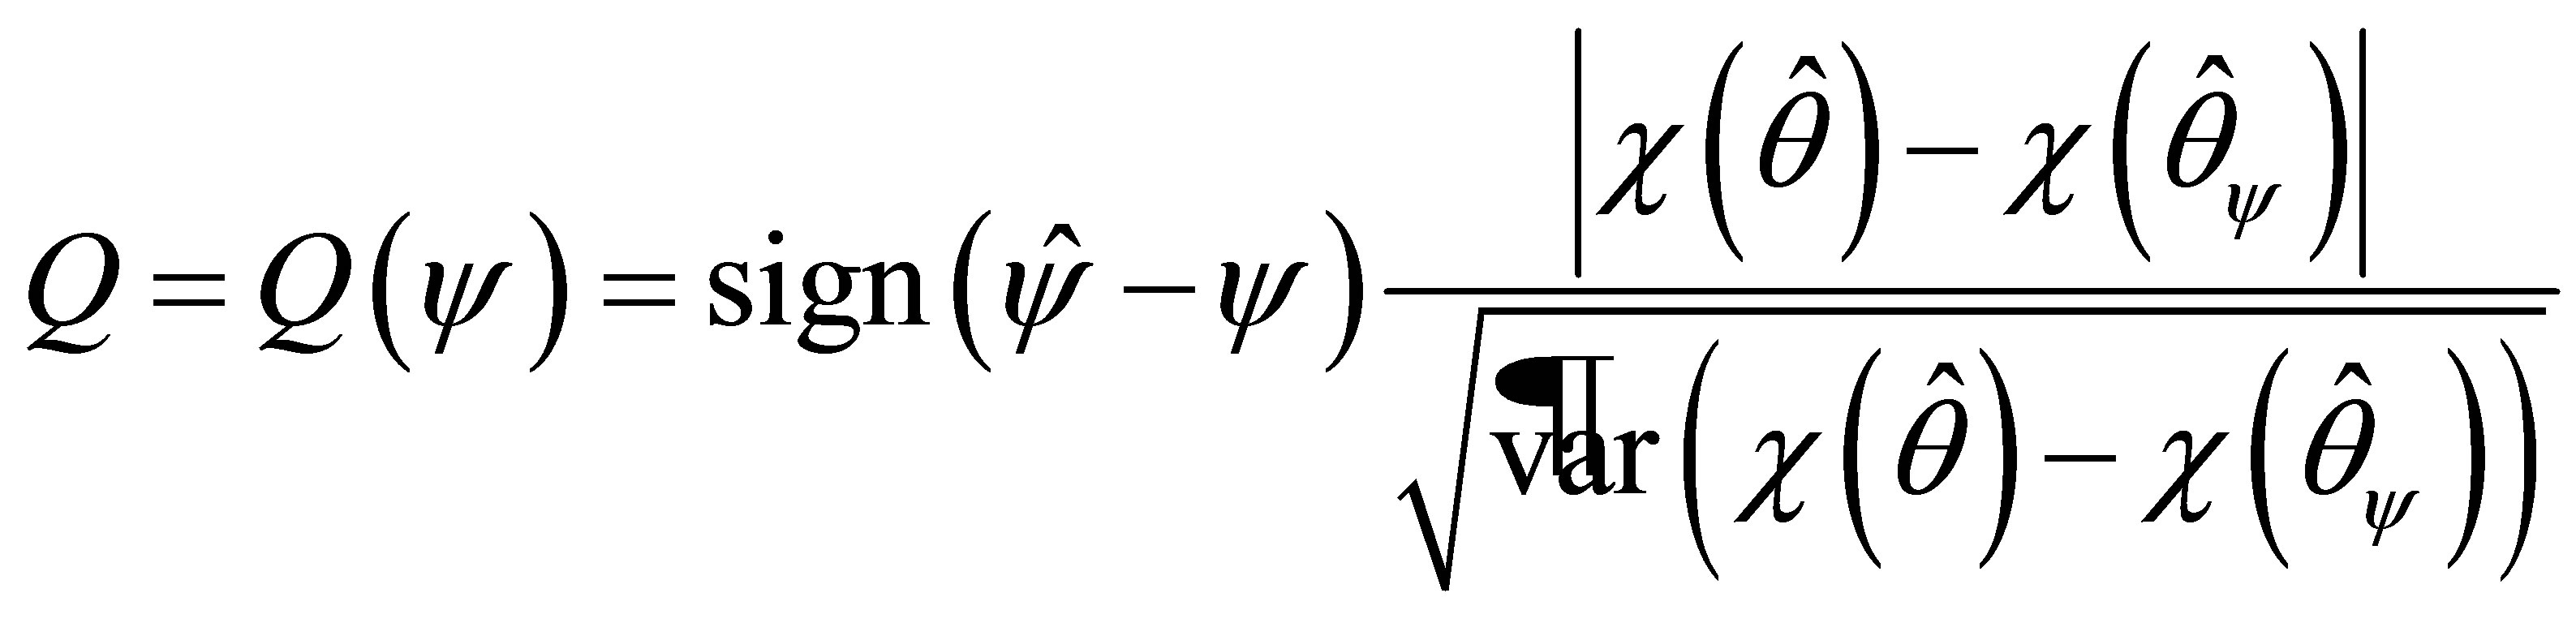 (1.5)
(1.5)
where
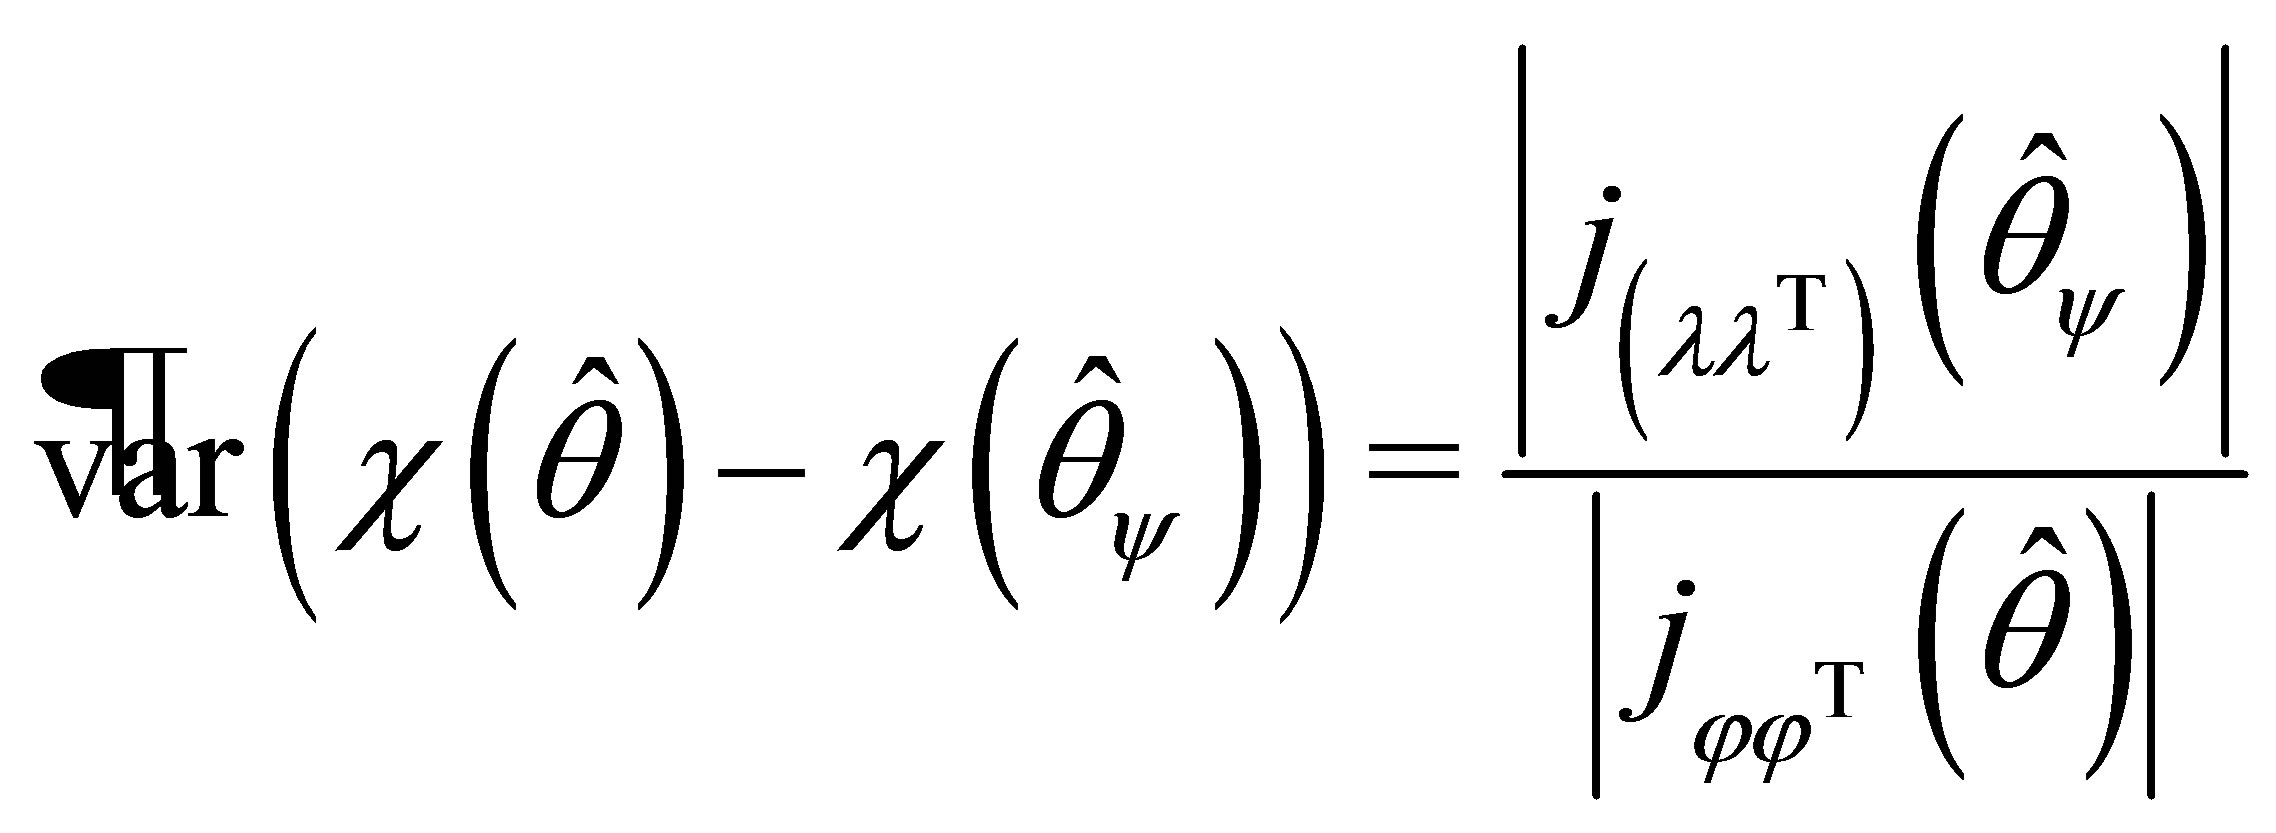 (1.6)
(1.6)
with
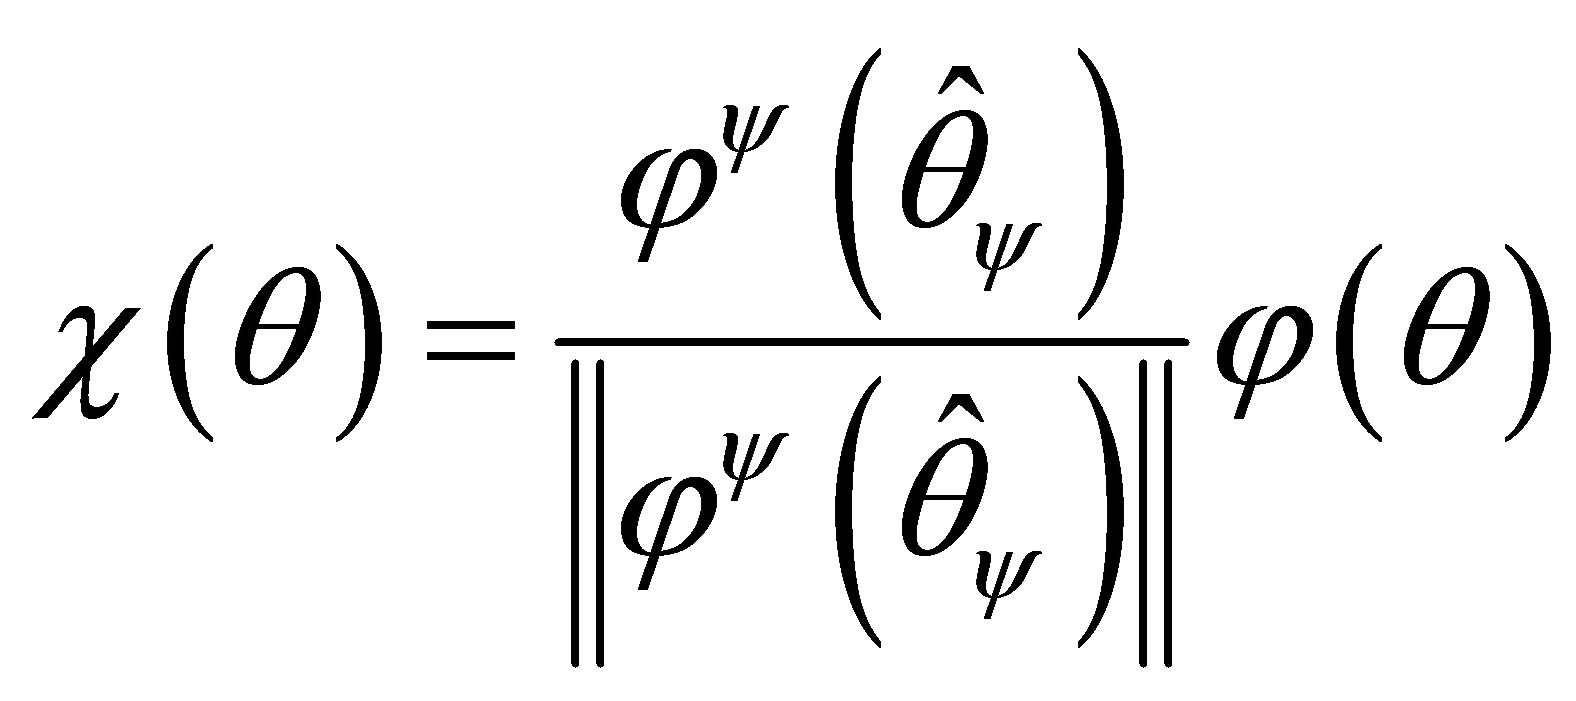 (1.7)
(1.7)
is a rotated coordinate of  that agrees with
  at
at . Let
. Let  and
and  be the derivatives of
  with respect to
  and
and , respectively,
  is the row of
  that corresponds to
 , and
, and
 is the Euclidean distance of the vector
 .
.
Then by change of variable from  to
to , we have
and
For a model that does not belong to an exponential family, Fraser and Reid [19] proposed a systematic method to obtain the locally defined canonical parameter . Their method is to, first, obtain the ancillary direction
  by
by
 (1.8)
(1.8)
where  is an n-dimensional pivotal quantity. Then the locally defined canonical parameter is defined as:
 (1.9)
(1.9)
Thus, the modified signed log-likelihood ratio statistic method can be applied to obtain the p-value function of , and confidence interval for
 . Fraser and Reid (1995) showed that the method maintained third order accuracy.
3. Main Results
We studied the modified signed log-likelihood ratio test to the normal mean with known CV problem. The main results are as follows. Let  be a random sample from a normal distribution with mean
  and variance
 . Without loss of generality, we follow the set up in Srisodaphol and Tongmol [13] that the coefficient of variation
  is known. The log likelihood function is
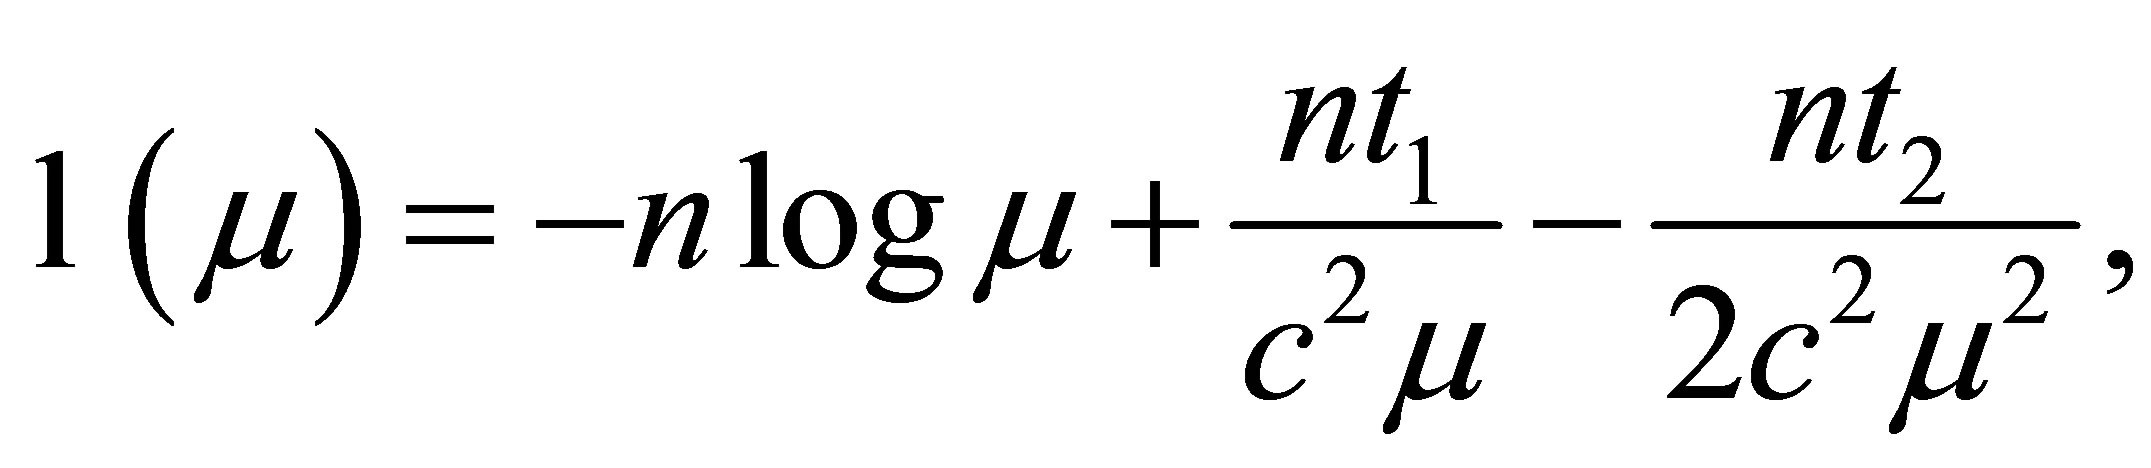 (1.10)
where 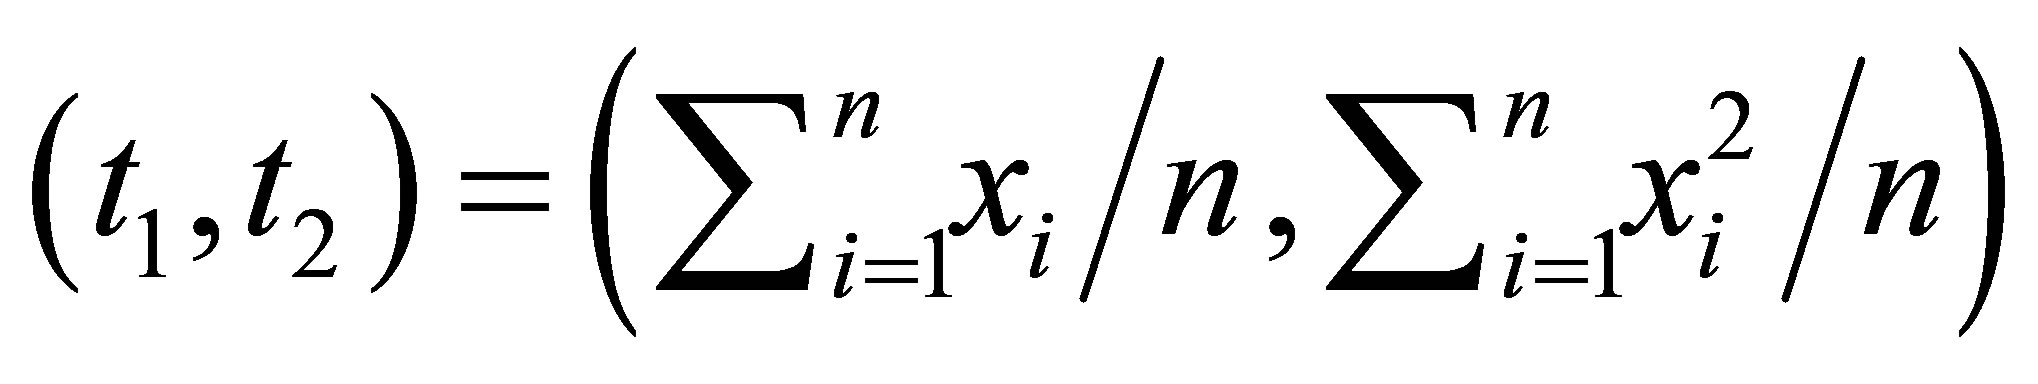 is a minimal sufficient statistic. This belongs to the curved exponential family as defined in Efron [4] with a two-dimensional minimal sufficient statistic but only a scalar parameter. Classical statistical methods cannot be directly applied to obtain the p-value function of
 .
.
Since  and
and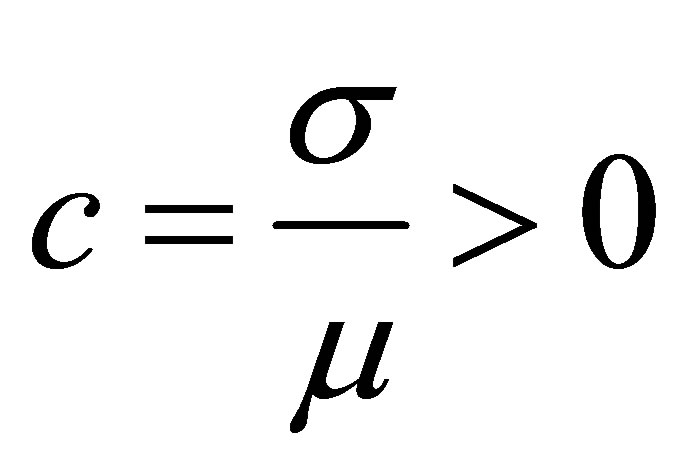 , therefore
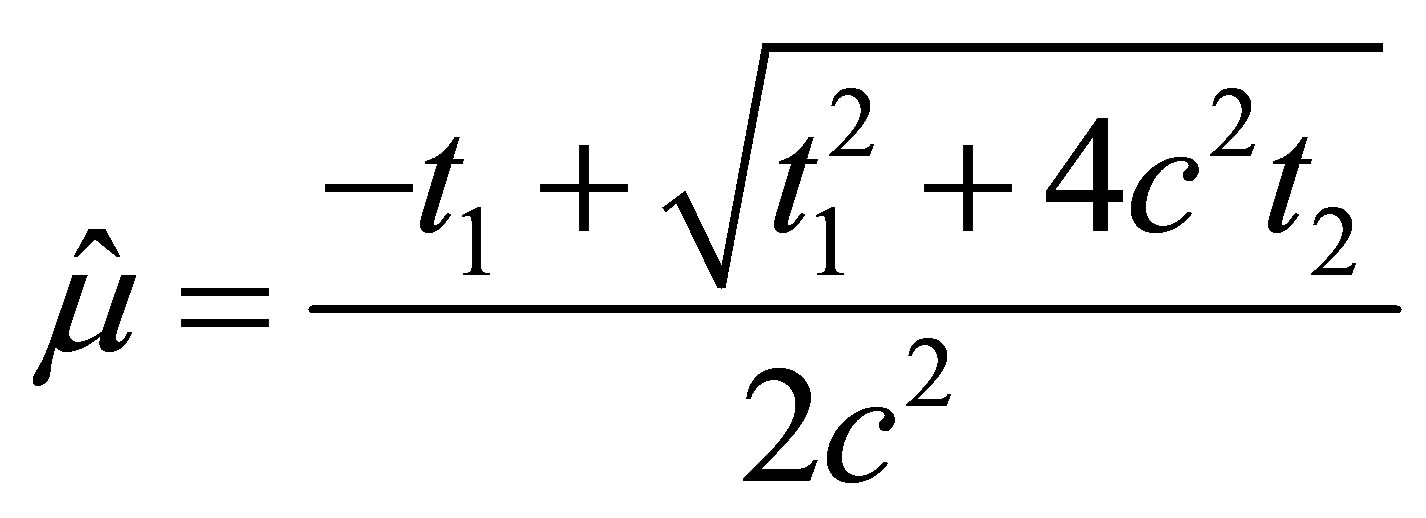
  has to be positive, and the maximum likelihood estimate of
  is
is
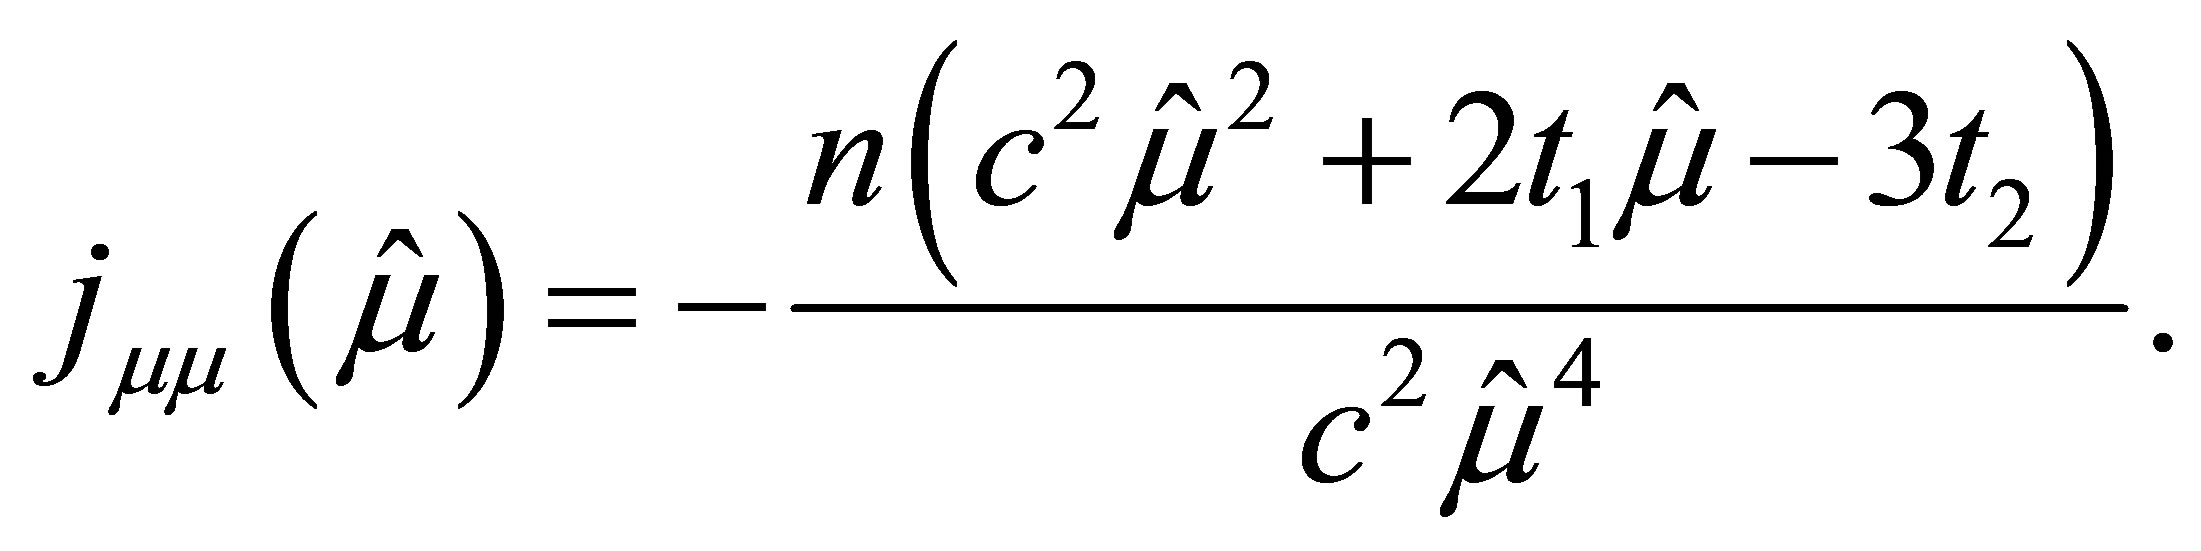
with the observed information evaluated at  is
is
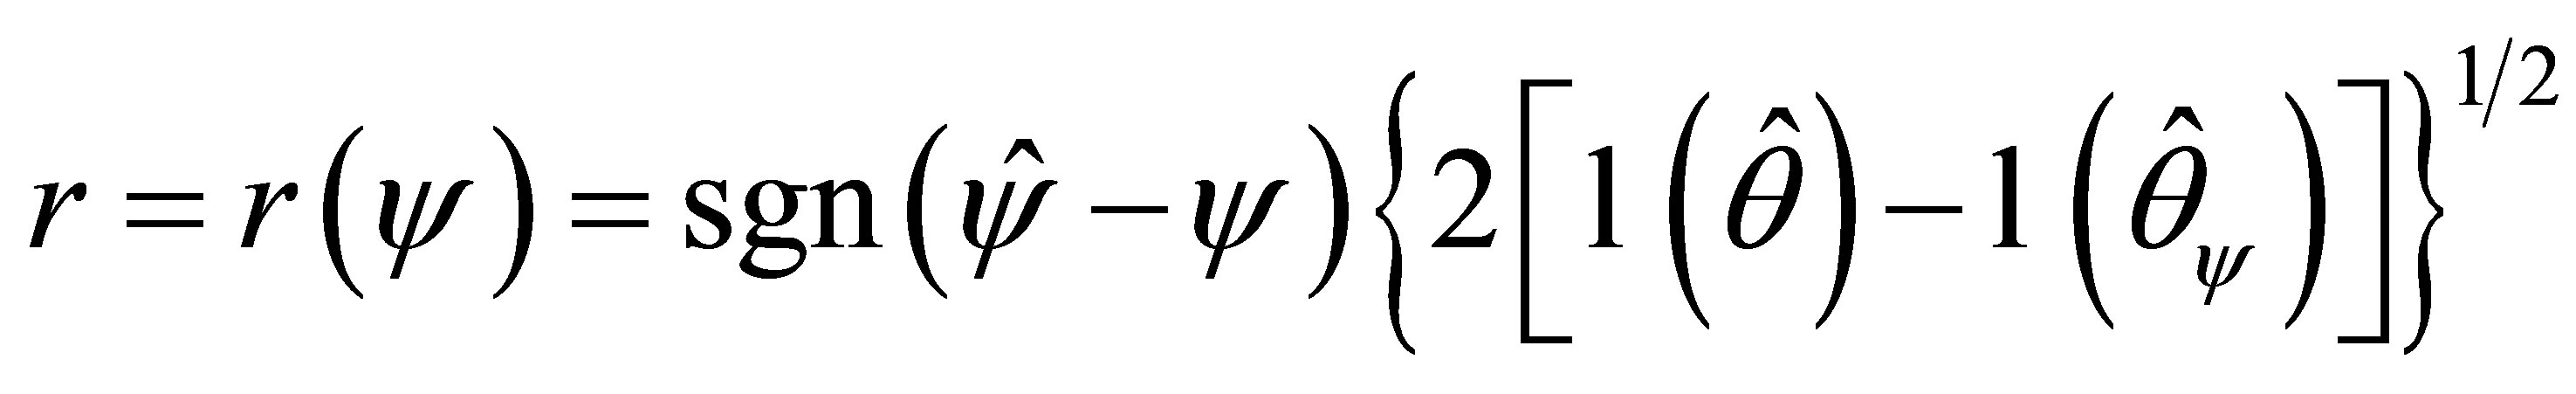
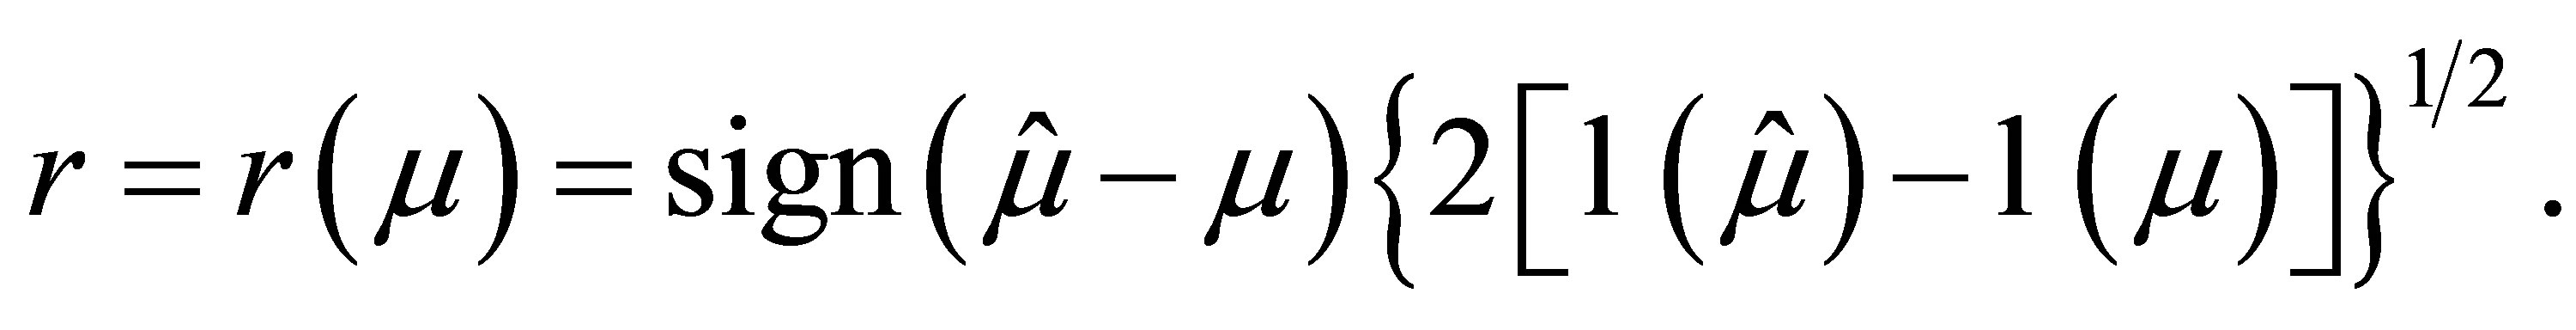
The signed log likelihood ratio statistic is
To calculate , we need to first obtain the locally defined canonical parameter
  which depends on the pivotal quantity
 . In this case, the pivotal quantity for the
  observation is
and we have
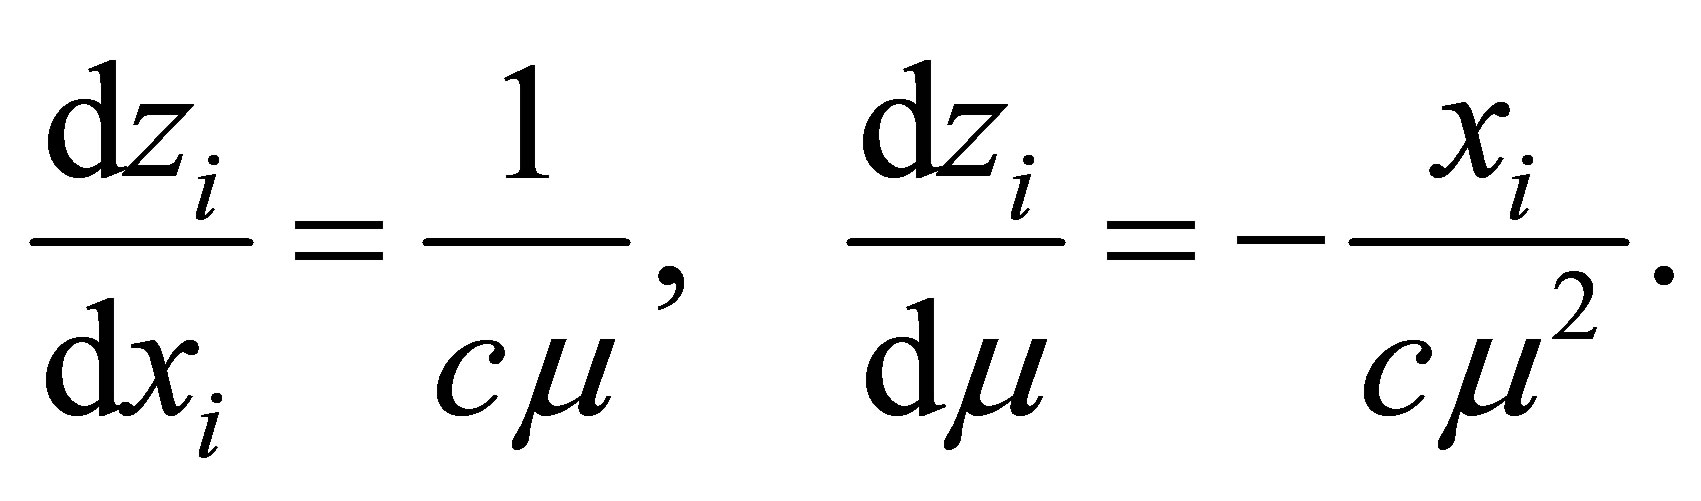
The  component of the ancillary direction is
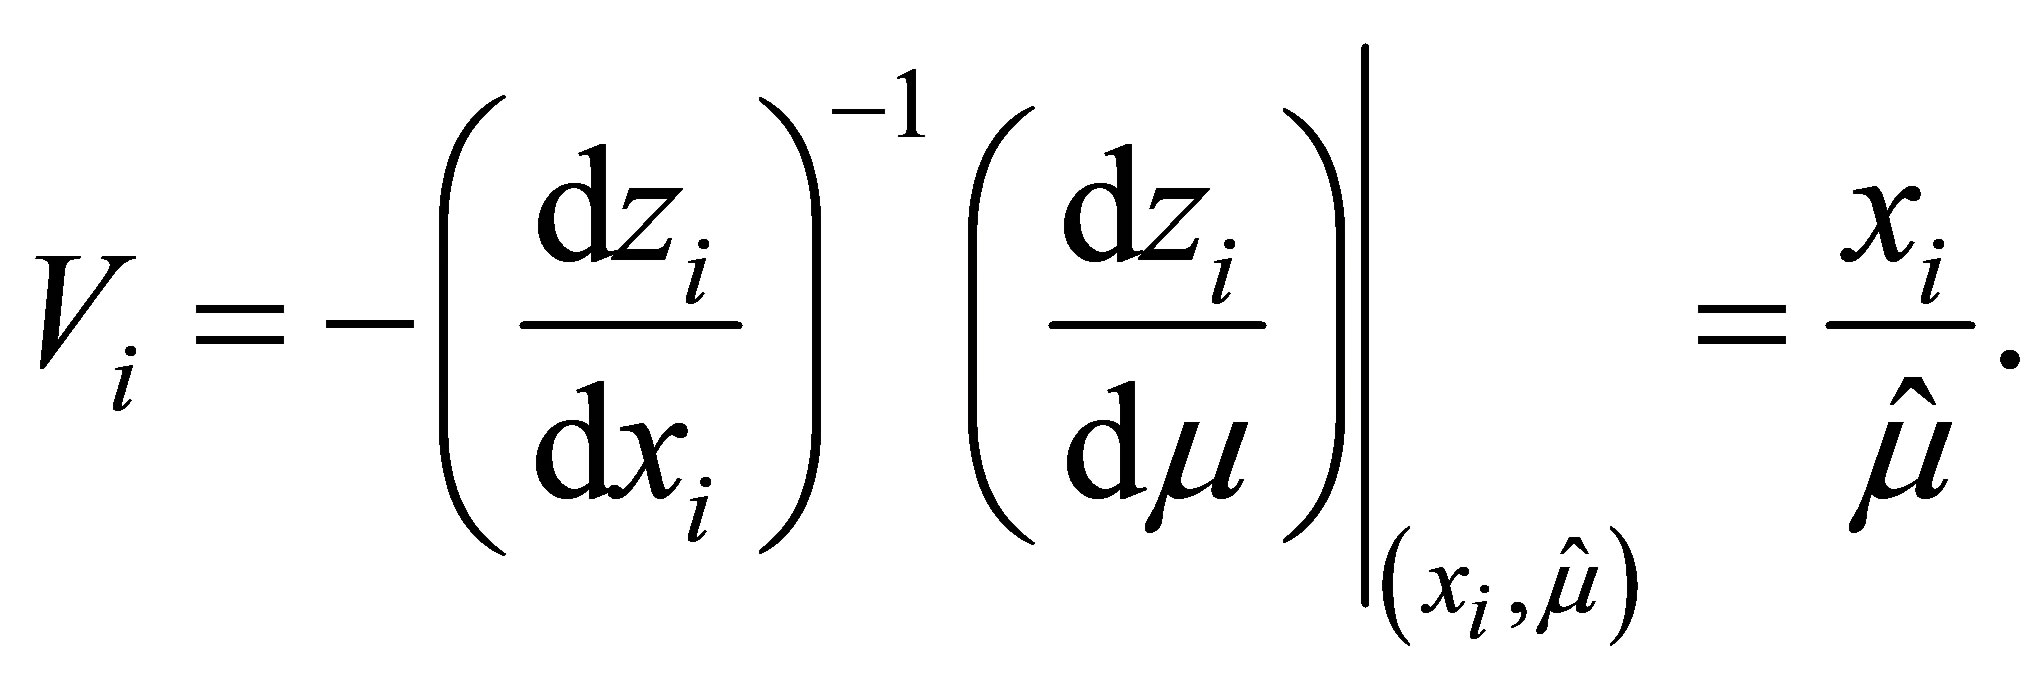
Moreover
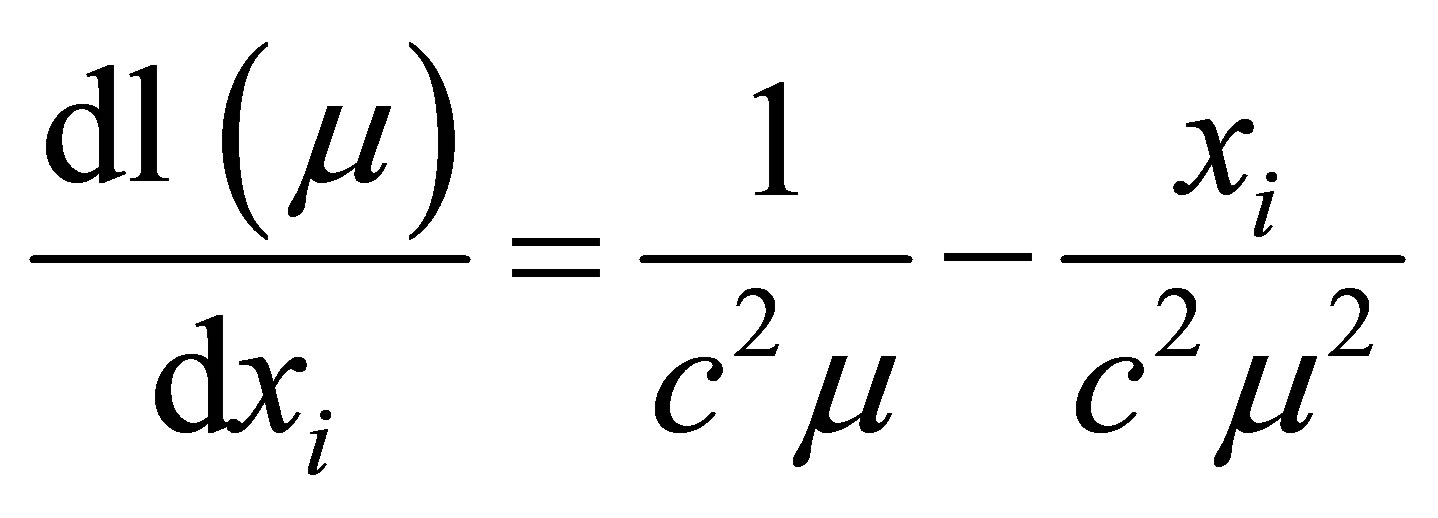
and, the locally defined canonical parameter  is
is
with
Since there is no nuisance parameter involved in this problem, simplifying (1.7) and (1.6), we have
and
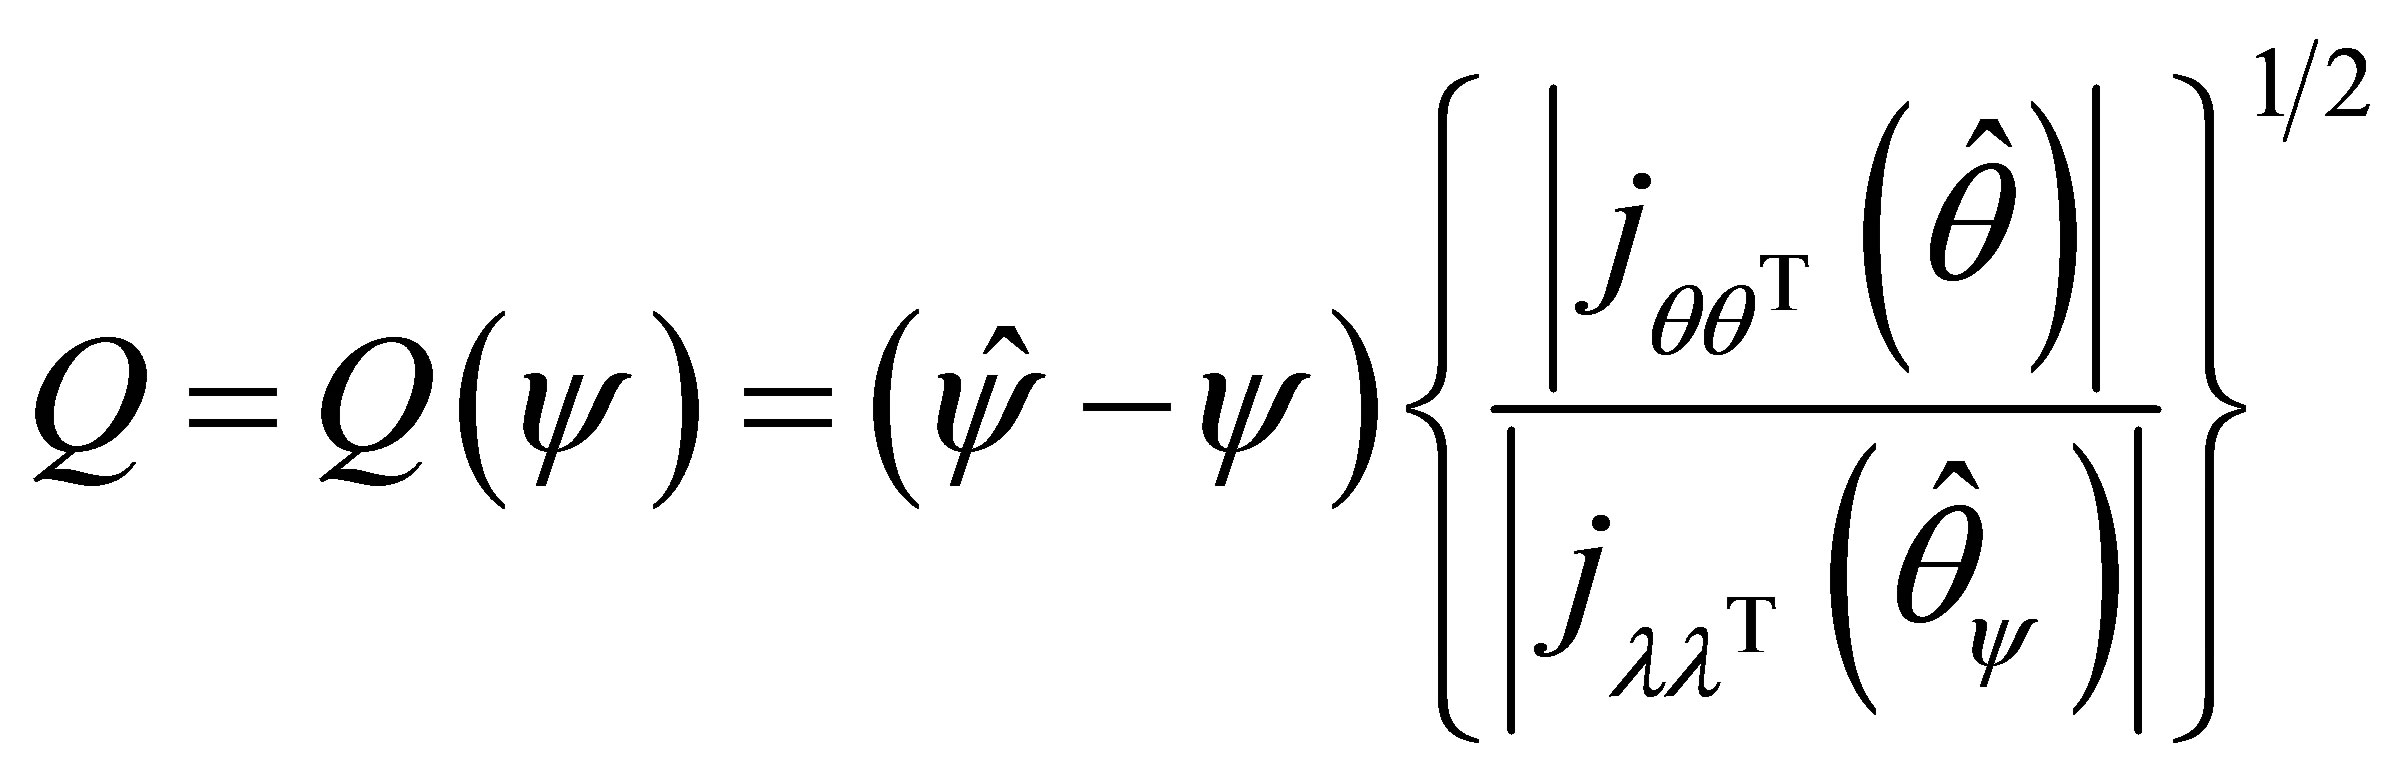
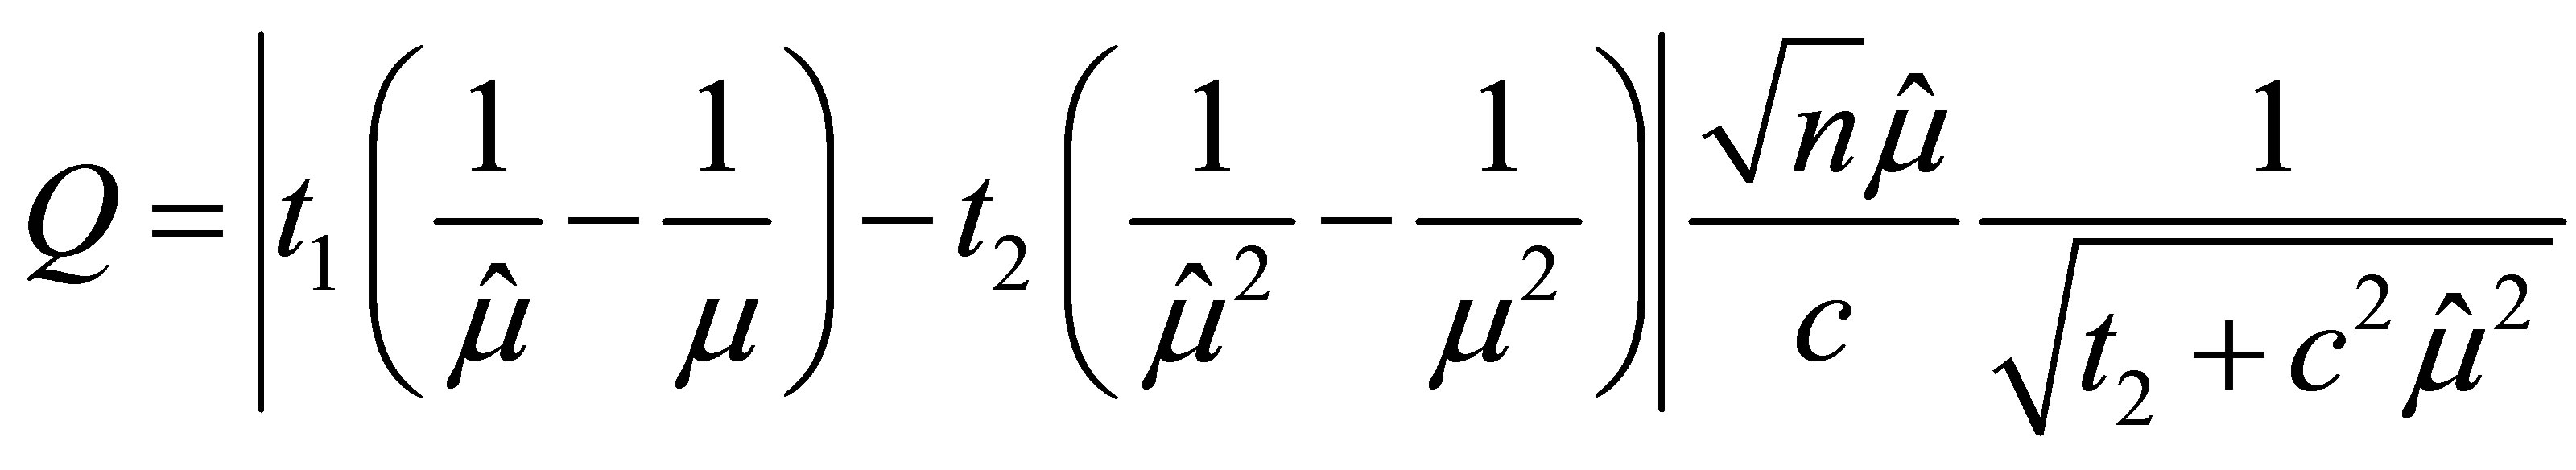
Finally, the maximum likelihood departure in  scale is
and thus the p-value function of ,
,  , can be obtained by the modified signed log likelihood ratio method.
In addition, we proposed a new estimator of  which is a by-product of the modified signed log likelihood ratio method,
 . We denote our new estimator as
  which satisfies
or equivalently
Although the explicit form of  is not available, it can be obtained easily by simple numerical methods.
4. Numerical Studies
Our first simulation study is to compare the accuracy of the confidence intervals obtained from the Wald method (Wald) and the likelihood ratio method (LR) as discussed in Bhat and Rao [2] and those obtained by the proposed method . We consider the extreme case of
 . For each combinations of
  and
and ten thousand Monte Carlo replications are performed. For each generated sample, the 95% confidence interval for
  is calculated. The performance of a method is judged using the following criteria:
• The coverage probability (CP): Proportion of the true  falls within the 95% confidence interval;
• The lower tail error rate (LE): Proportion of the true  falls below the lower limit of the 95% confidence interval;
• The upper tail error rate (UE): Proportion of the true  falls above the upper limit of the 95% confidence interval;
• The average bias (AB)
The desired values are 0.95, 0.025, 0.025 and 0, respectively. These values reflect the desired properties of the accuracy and symmetry of the interval estimates of . Results are recorded in Table 1. The Wald method gives unsatisfactory coverage probability. LR gives decent coverage probability. Both the Wald method and the likelihood ratio method gives asymmetric intervals. However, the proposed modified signed log likelihood ratio method gives excellent results in all four criteria even for this extreme sample size case. Table 2 recorded a large sample size case
  with
with  and
and . In this case, the Wald method still gives decent coverage probability but also gives asymmetric intervals. Both LR and
  give similar coverage probability with
  having a smaller average bias. Simulation results for other combinations of
  are available upon request to authors.
Anis [12] compares the relative efficiency of ten point
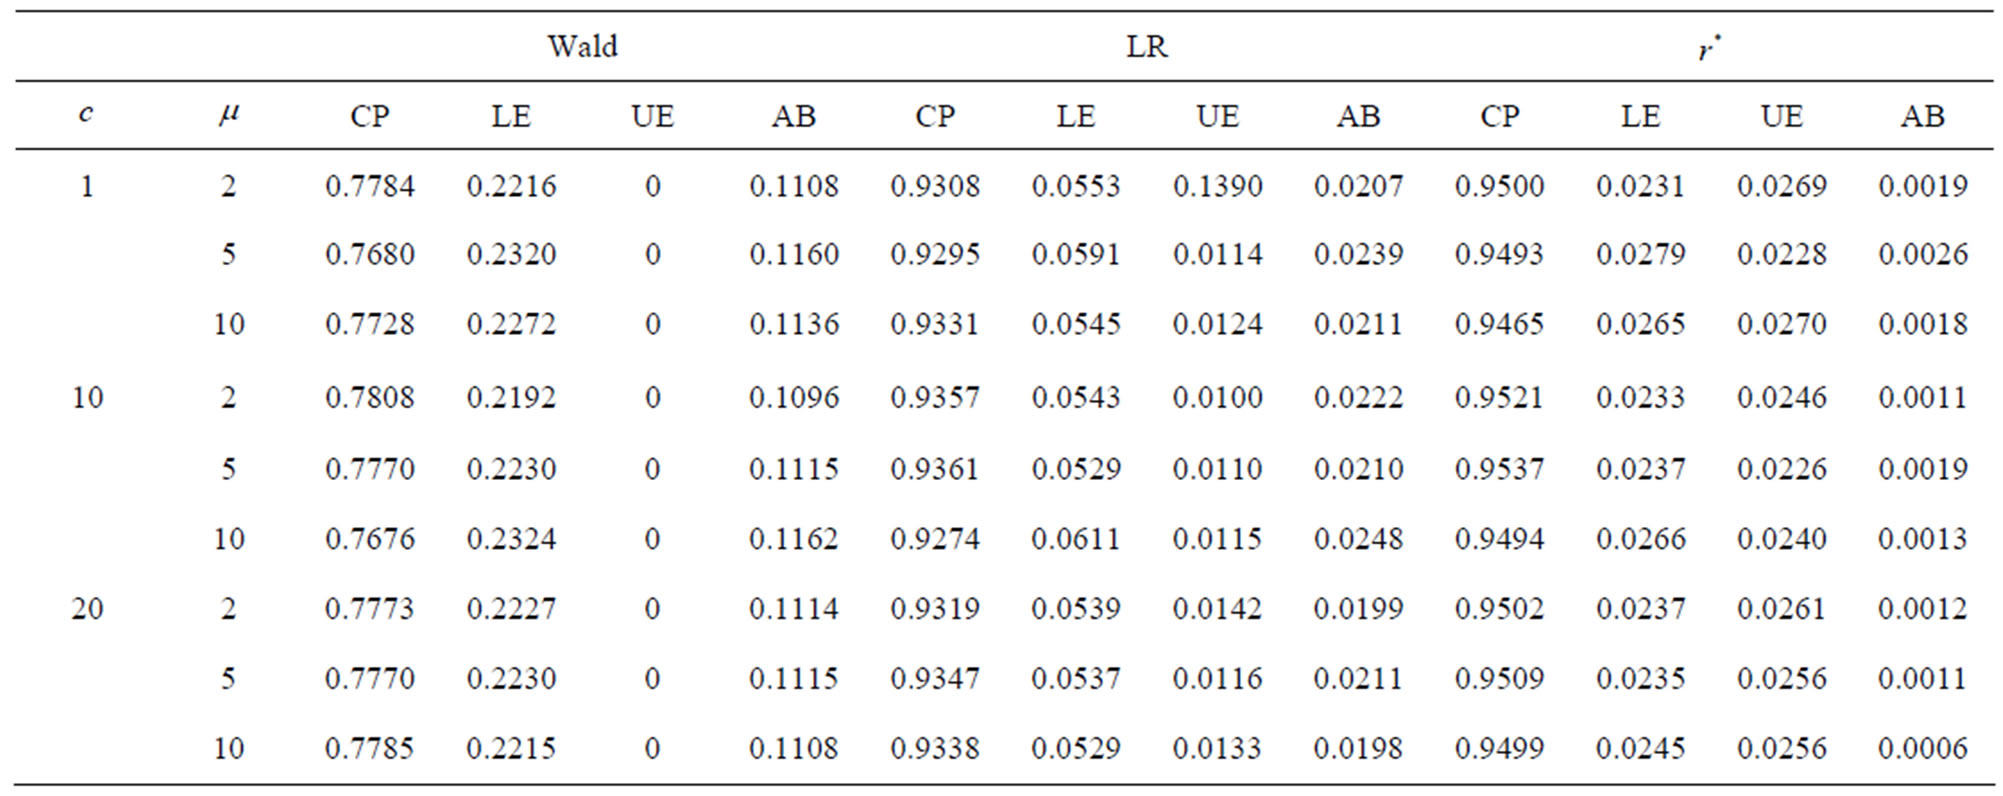
Table 1. Comparing the methods proposed in Bhat and Rao [2] and the proposed method using  and various combinations of
  and
and .
.
estimators of  (denoted as
 ) with the “standard” estimator
  and concluded that
 , which is the maximum likelihood estimator, performs best. Moreover,
  , which is easy to compute, is comparable to
  and
and .
.
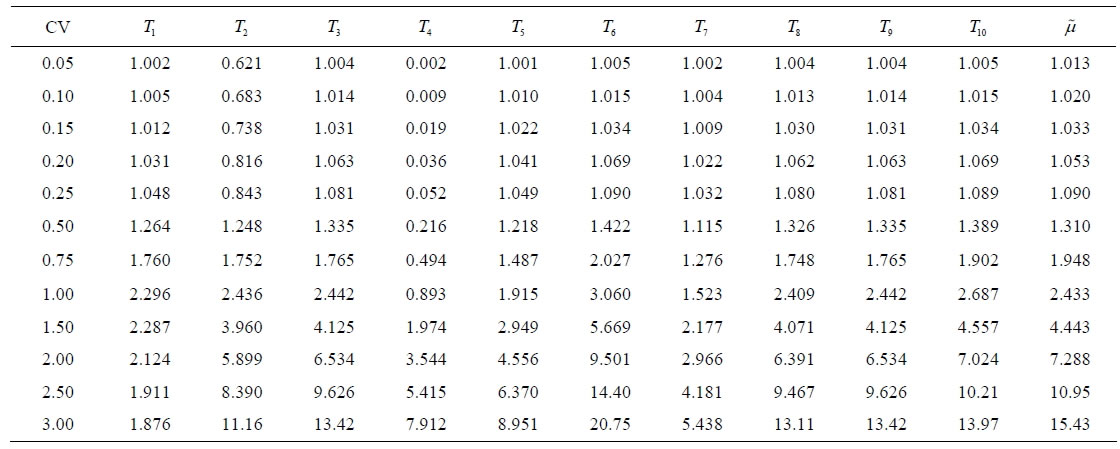
We mimic the simulation study discussed in Anis [12] to compare our proposed estimator,  , to the ten estimators discussed in Anis [12]. As in Anis [12], we chose
 , for each of the combinations of
  and
and , ten thousand Monte Carlo replications were performed. For each generated sample, we calculated the relative efficiency of the estimator with the “standard” estimator
 . Results are reported in Table 3" target="_self"> Table 3.
Table 2. Comparing the methods proposed in Bhat and Rao [2] and the proposed method for the case ,
,  and
and .
.
 (a)
(a) 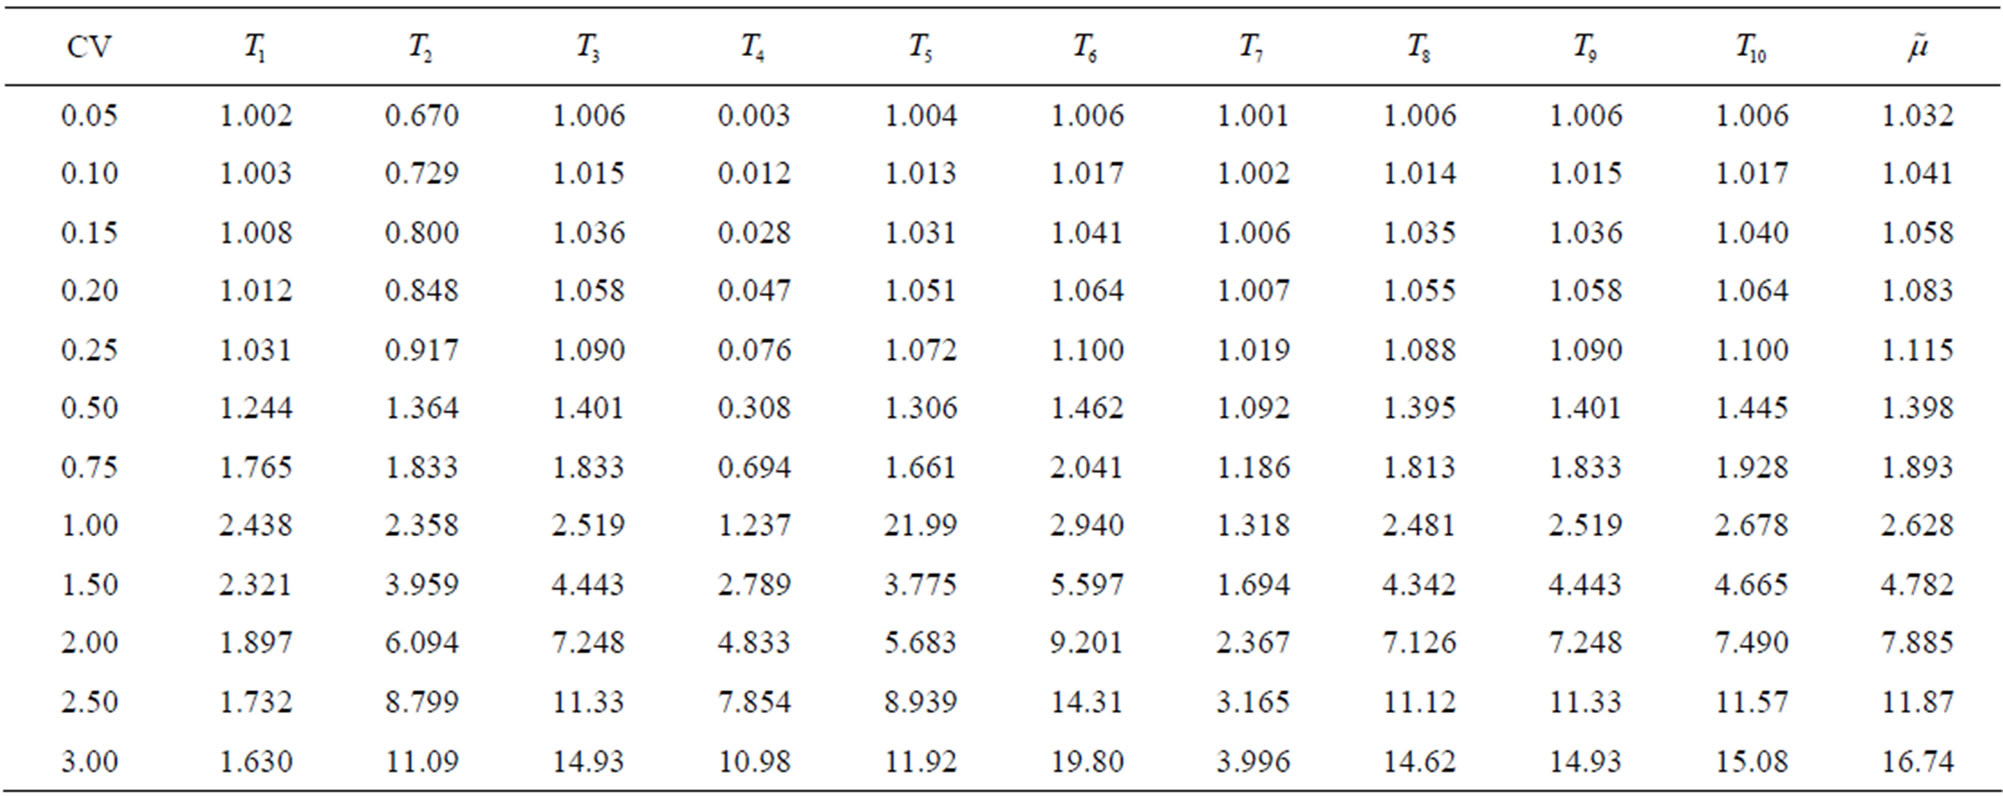 (b)
(b)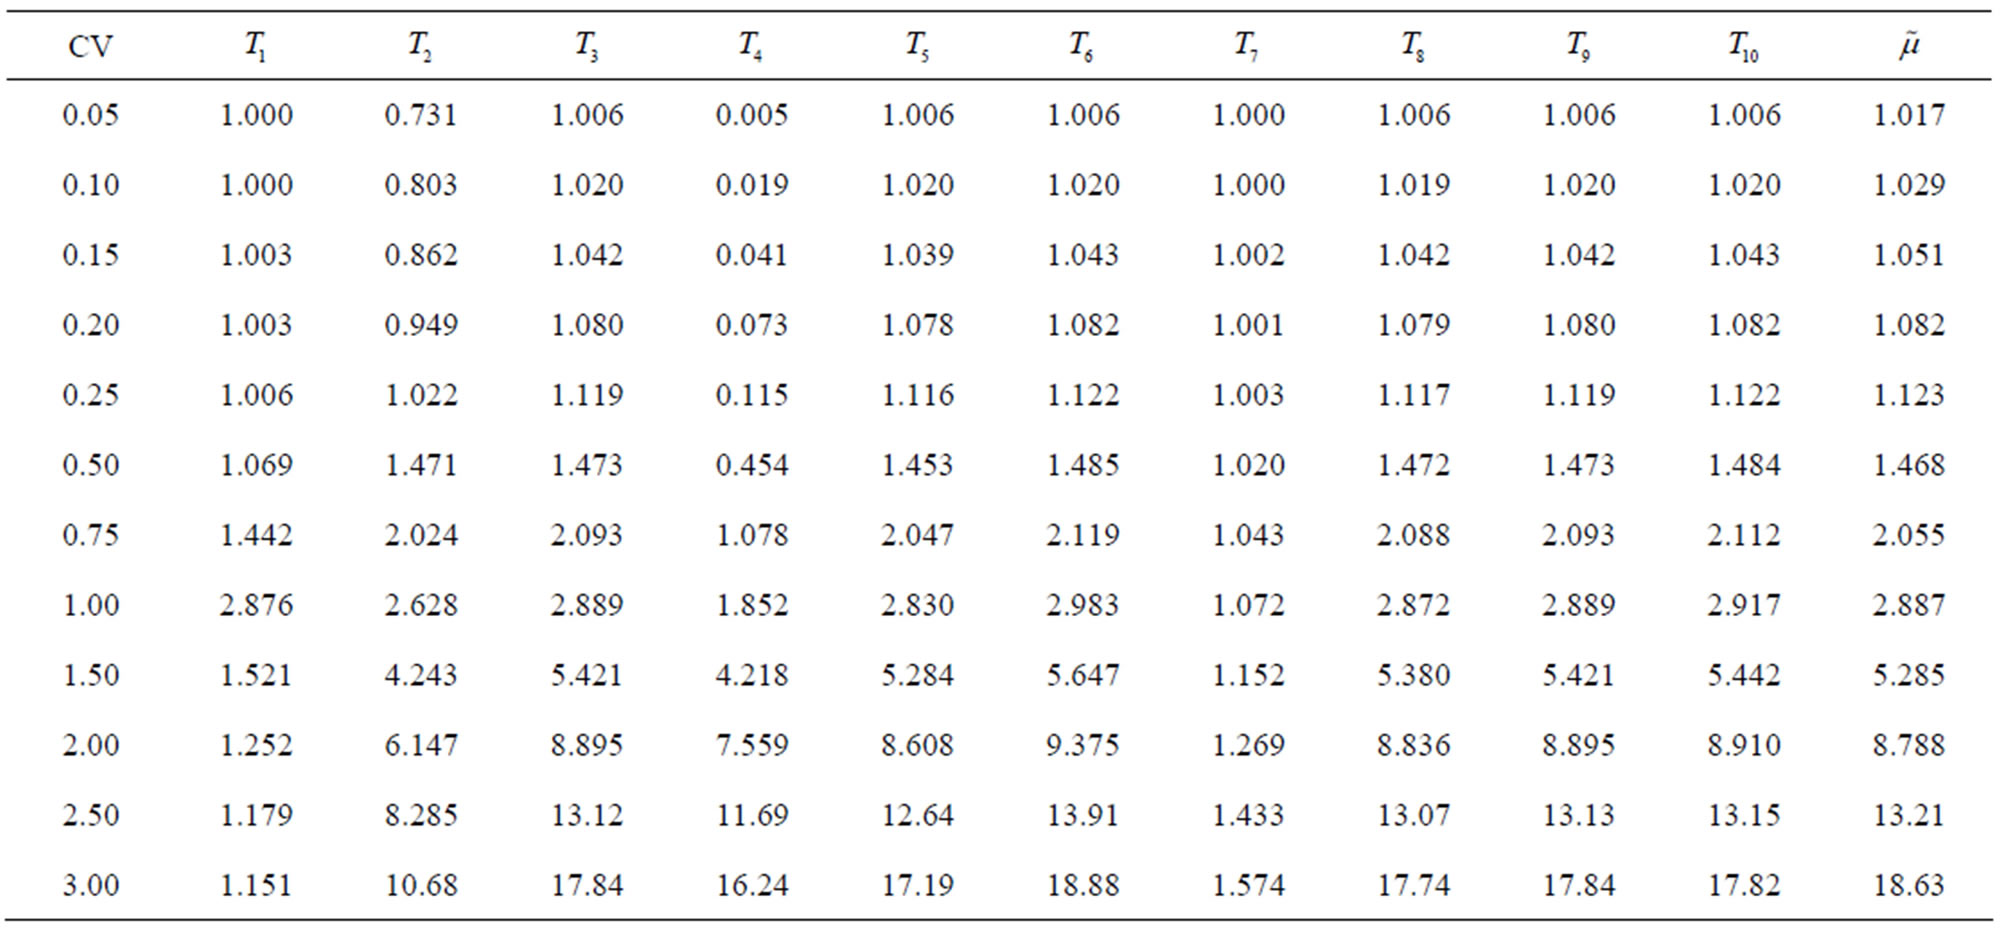 (c)
(c)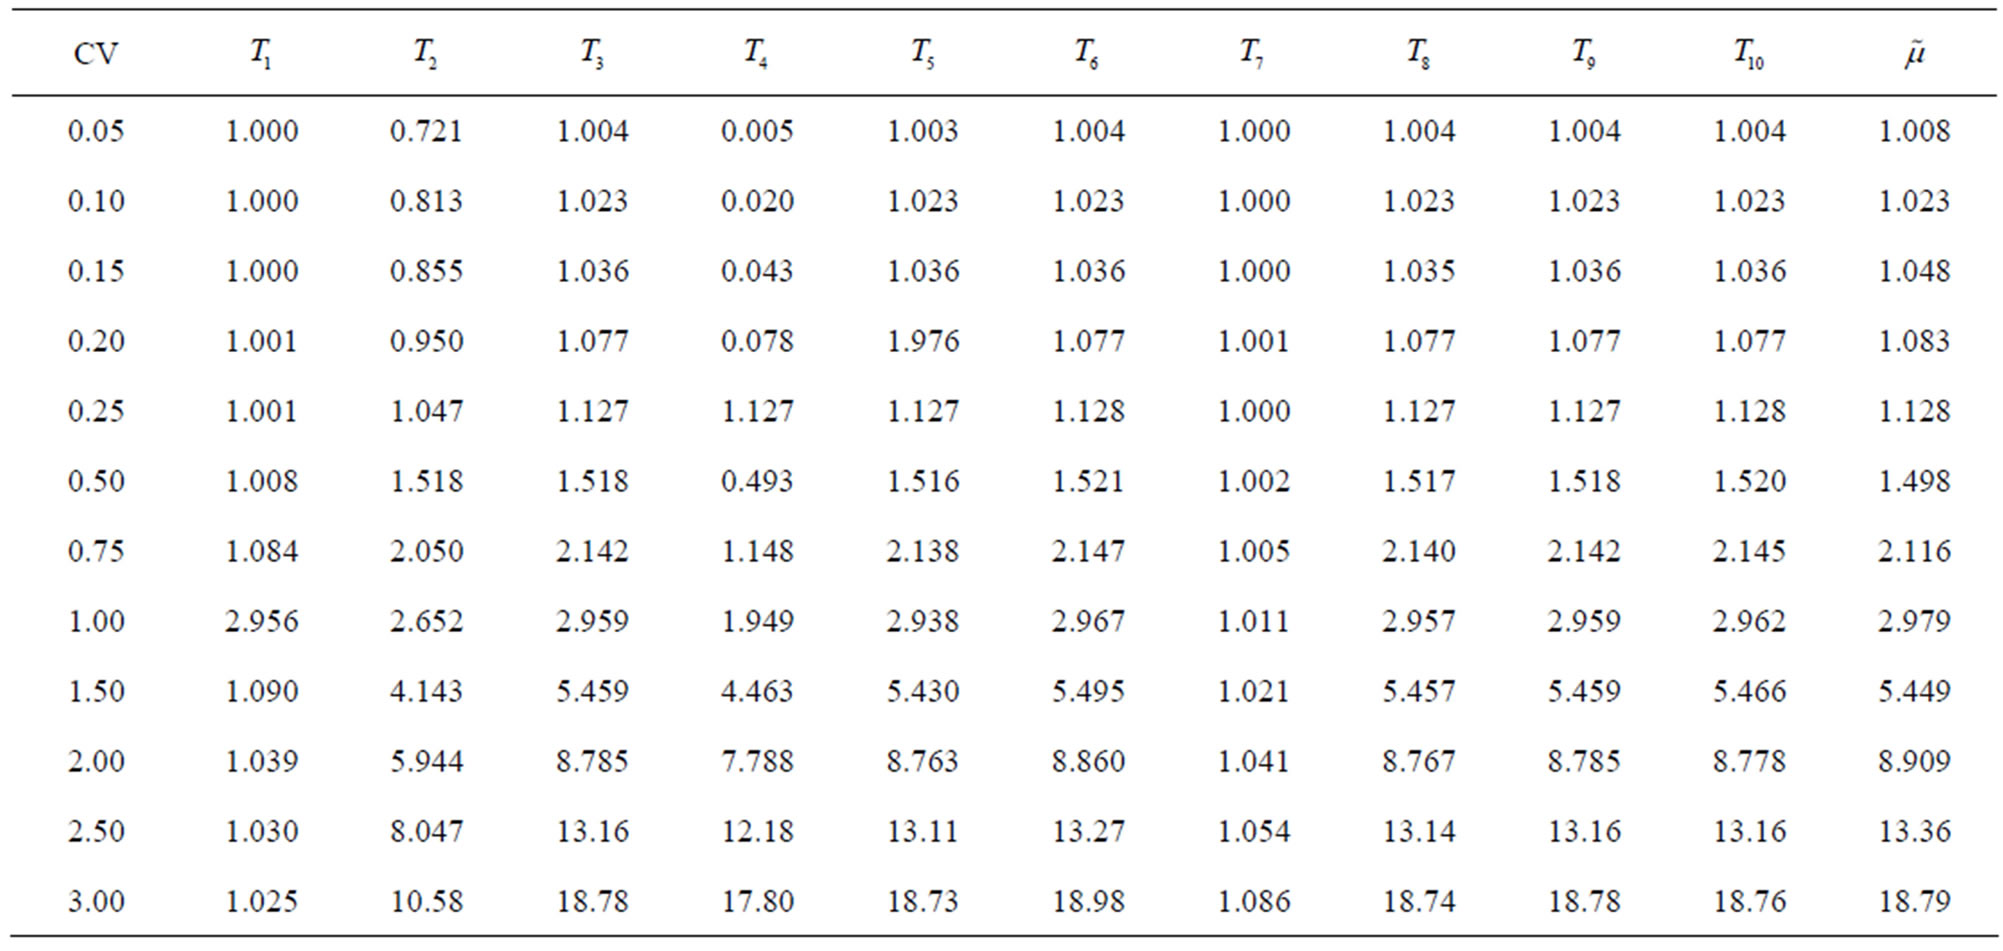 (d)
(d)
Table 3. (a) Relative efficiency of different estimators with respect to  for
for ; (b) Relative efficiency of different estimators with respect to
  for
for ; (c) Relative efficiency of different estimators with respect to
  for
for ; (d) Relative efficiency of different estimators with respect to
  for
for .
.
From Table 3, we can observe that  performs best and our proposed estimator
  ranks second. However, as shown in the our first simulation study, the inference based on the maximum likelihood estimate (the Wald method) gives unsatisfactory results. In other words, although
  is most efficient among the estimators discussed in this paper, it does not give satisfactory coverage properties. On the other hand, the point estimate based on the modified signed log likelihood ratio statistic is, in general, the second most efficient estimator among the estimators discussed in this paper, and the corresponding interval estimate has the best coverage properties. Thus, the proposed method is the recommended method.
5. Discussion
In this paper, we proposed a modified signed log-likelihood ratio method to obtain inference for the mean parameter of a normal distribution when the coefficient of variation is known. A by-product of the proposed method is the availability of an efficient point estimator of the mean. Theoretically, the proposed method has rate of convergence  and simulation results show the extreme numerical accuracy of the proposed method even when the sample size is small. The proposed method can be applied to any model to obtain inference for a scalar parameter of interest.
REFERENCES
- S. Niwitpong, “Confidence Intervals for the Normal Mean with Known Coefficient of Variation,” World Academy of Science, Engineering and Technology, Vol. 69, 2012, pp. 677-680.
- K. Bhat and K. A. Rao, “On Tests for a Normal Mean with Known Coefficient of Variation,” International Statistical Review, Vol. 75, No. 2, 2007, pp. 170-182. http://dx.doi.org/10.1111/j.1751-5823.2007.00019.x
- V. Brazauskas and J. Ghorai, “Estimating the Common Parameter of Normal Models with Known Coefficients of Variation: A Sensitivity Study of Asymptotically Efficient Estimators,” Journal of Statistical Computation and Simulation, Vol. 77, No. 8, 2007, pp. 663-681. http://dx.doi.org/10.1080/10629360600578221
- B. Efron, “Defining the Curvature of a Statistical Problem (with Applications to Second Order Efficiency),” Annals of Statistics, Vol. 3, No. 6, 1975, pp. 1189-1242. http://dx.doi.org/10.1214/aos/1176343282
- D. T. Searls, “The Utilization of a Known Coefficient of Variation in the Estimation Procedure,” Journal of the American Statistical Association, Vol. 59, No. 308, 1964, pp. 1225-1226. http://dx.doi.org/10.1080/01621459.1964.10480765
- R. A. Khan, “A Note on Estimating the Mean of a Normal Distribution with Known Coefficient of Variation,” Journal of the American Statistical Association, Vol. 63, No. 323, 1968, pp. 1039-1041. http://dx.doi.org/10.2307/2283896
- L. J. Gleser and J. D. Healy, “Estimating the Mean of Normal Distribution with Known Coefficient of Variation,” Journal of the American Statistical Association, Vol. 71, No. 356, 1976, pp. 977-981. http://dx.doi.org/10.1080/01621459.1976.10480980
- A. R. Sen, “Relative Efficiency of Estimators of the Mean of a Normal Distribution When Coefficient of Variation Is Known,” Biometrical Journal, Vol. 21, No. 2, 1979, pp. 131-137. http://dx.doi.org/10.1002/bimj.4710210206
- H. Guo and N. Pal, “On a Normal Mean with Known Coefficient of Variation,” Calcutta Statistical Association Bulletin, Vol. 54, 2003, pp. 17-29.
- A. Chaturvedi and S. K. Tomer, “Three-Stage and ‘Accelerated’ Sequential Procedures for the Mean of a Normal Population with Known Coefficient of Variation,” Statistics, Vol. 37, No. 1, 2003, pp. 51-64. http://dx.doi.org/10.1080/0233188031000065433
- R. Singh, “Sequential Estimation of the Mean of Normal Population with Known Coefficient of Variation,” Metron, Vol. 56, 1998, pp. 73-90.
- M. Z. Anis, “Estimating the Mean of Normal Distribution with Known Coefficient of Variation,” American Journal of Mathematical and Management Sciences, Vol. 28, No. 3-4, 2008, pp. 469-487. http://dx.doi.org/10.1080/01966324.2008.10737739
- W. Srisodaphol and N. Tongmol, “Improved Estimators of the Mean of a Normal Distribution with a Known Coefficient of Variation,” Journal of Probability and Statistics, Vol. 2012, 2012, Article ID: 807045. http://dx.doi.org/10.1155/2012/807045
- D. V. Hinkley, “Conditional Inference about a Normal Mean with Known Coefficient of Variation,” Biometrika, Vol. 64, No. 1, 1977, pp. 105-108. http://dx.doi.org/10.1093/biomet/64.1.105
- D. A. S. Fraser, N. Reid and J. Wu, “A Simple General Formula for Tail Probabilities for Frequentist and Bayesian Inference,” Biometrika, Vol. 86, No. 2, 1991, pp. 249- 264. http://dx.doi.org/10.1093/biomet/86.2.249
- O. E. Barndorff-Nielsen, “Inference on Full or Partial Parameters, Based on the Standardized Signed Log-Likelihood Ratio,” Biometrika, Vol. 73, No. 2, 1986, pp. 307- 322.
- O. E. Barndorff-Nielsen, “Modified Signed Log-Likelihood Ratio,” Biometrika, Vol. 78, No. 3, 1991, pp. 557- 563. http://dx.doi.org/10.1093/biomet/78.3.557
- D. A. S Fraser, N. Reid and A. Wong, “Simple and Accurate Inference for the Mean Parameter of the Gamma Model,” Canadian Journal of Statistics, Vol. 25, No. 1, 1997, pp. 91-99. http://dx.doi.org/10.2307/3315359
- Fraser, D.A.S. and Reid, N., “Ancillaries and Third Order Significance,” Utilitas Mathematica, Vol. 7, 1995, pp. 33- 55.