Open Journal of Physical Chemistry
Vol. 2 No. 1 (2012) , Article ID: 17536 , 7 pages DOI:10.4236/ojpc.2012.21005
Circular Dichroism and Derivative Spectra Study of the Excitonic Aggregation of Pinacyanol by Aerosol-OT
1Department of Chemistry, American University of Madaba, Madaba, Jordan
2Fachbereich Chemie, Universität Duisburg-Essen, Essen, Germany
Email: *sbkhouri@yahoo.com
Received August 8, 2011; revised August 31, 2011; accepted October 25, 2011
Keywords: Cyanine Dye; Pinacyanol; Surfactant; Aerosol-OT; Aggregation; Circular Dichroism; Derivative Spectra
ABSTRACT
Different structures are proposed for the complexes formed from the interaction between the cationic cyanine dye 1, 1’-diethyl-2, 2’-carbocyanine chloride (Pinacyanol chloride) and the anionic surfactant sodium bis (2-ethylhexyl) sulfosuccinate (Aerosol-OT) in ethanol-water solutions. UV/vis and electronic circular dichroism (CD) spectra provide tools to study the concentration and solvent dependence of this interaction. The aggregation spectra of the dye are dominated by a strongly blue-shifted, sharp and single visible band, which appears at concentrations much below the critical micelle concentration (cmc) of Aerosol-OT. Above the cmc, the spectra in pure aqueous solution indicate dissociation into monomer and dimer species, and the system becomes completely empty of chirality. Two different CD spectra with a distinct isosbestic point are observed for complexes with different surfactant to dye ratios. Both the addition of ethanol (more than 7.5%) and increasing the temperature retards the metachromatic process between the dye and Aerosol-OT. By using the peakFit program, the two overlapping excitonic absorption bands together with the optically inactive absorption band for one spectrum (the most optimal one) at a specific Aerosol-OT concentration were separated.
1. Introduction
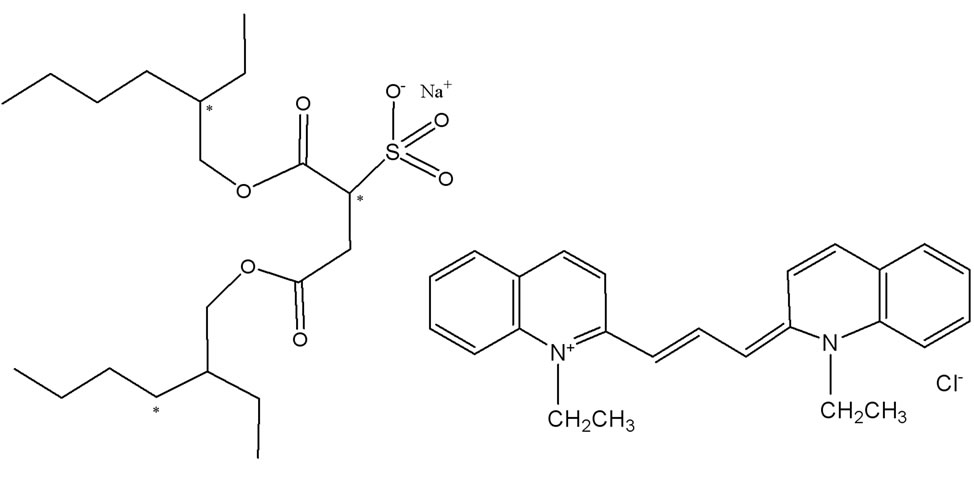
Aerosol-OT (AOT for short, Figure 1(a)) is an anionic surfactant with two branching hydrophobic tails. The surfactant has three asymmetric carbon atoms; one of them is next to the sulfonate group, which makes this group optically active that can induce chirality in a symmetric cationic molecule after they bond [1]. Symmetric cationic cyanine dyes play a major role in the aggregation process of anionic surfactants even below its critical micelles concentration (cmc), in which these cationic dyes act as mutual counter ion to reduce the electrostatic repulsion between the groups that carry the negative charge [2]. Many researchers have been reported on the micelles aggregation’s type of AOT surfactant by using different physical methods [3-6]. AOT is soluble in any type of solvents and can form micro-emulsions with or without co-surfactants with oils [7,8].
Cyanine dyes have a natural tendency to aggregate spontaneously in pure aqueous solutions or in mixed solvents when their concentration is increased or the temperature is lowered. Cyanine dyes have two types of aggregates; Hand J-types that can be formed depending on the conformation of the aggregates. H-type is formed when the dye molecules arrange themselves face-to-face in near vertical stacks with blue shifts of the absorption maxima that depend quantitatively on the number of monomers in the aggregates [9]. J-aggregates are formed when the dye molecules arrange themselves into slanted stacks with red shifts of the absorbance [10].
Anionic surfactants (above or below their cmc) can also affect in contrast the aggregation of cationic cyanine dyes, in which ion-pairing is a prerequisite for this process [11,12]. The aggregated species that formed from a dye in solution lead to the development of new blueshifted spectral bands relative the monomer band [13]. 1, 1’-diethyl-2, 2’-carbocyanine chloride (Pinacyanol chloride or PIN for short, Figure 1(b)) is the dye that was studied in this work. This dye is a symmetric cationic cyanine dye, where its absorption spectrum in solution shows three overlapping spectral bands; for monomer, dimer and higher aggregates [14]. The interaction of cyanine dyes with various types of surfactants was interested by many researchers [6,15,16]. Pal and Pal [15] have shown that AOT induces strong dichroism in the cationic pinacyanol dye aqueous solutions, and that was the first report of the induction of circular dichroism in a
 (a) (b)
Figure 1. (a) The structure of Aerosol-OT; (b) The structure of Pinacyanol chloride.
cationic dye by AOT or by other detergents in dilute pure aqueous solutions (as they reported).
In the present work, we intend to study the UV/vis and elecrtronic induced CD absorption spectra of the symmetrical cyanine dye, PIN, in the presence of different concentrations of AOT with different experimental conditions. The resulted spectra were treated using derivative spectroscopy [17]. Peak analysis was used to analyze and separate the various new absorption bands that resulted by such interaction for the most optimal spectrum. All measurements in this study are conducted mainly in 7.5% v/v ethanol/water solutions, at which the excitonic absorption band was the optimum one.
2. Materials and Methods
2.1. Materials
AOT was obtained from Merck and PIN was obtained from Sigma. Spectrophotometric grade ethanol was from Merck. Triple distilled water was used throughout the study.
2.2. Experimental Methods and Instruments Used
Standard dye and AOT solutions were prepared in 25 ml volumetric flasks. 4.00 ml of AOT-dye solutions were prepared in stoppered rolled rim glasses of 10 cm3 capacity. To prevent the dye to precipitate at the glass walls, AOT solutions were added first into a rolled rim glass, followed by the required amount of the dye solution.
The UV/vis spectra were recorded with a Perkin-Elmer Lambda 5 spectrophotometer, and CD-spectra were measured with AVIV circular dichroism spectrophotometer, Model 62DS. Both instruments were connected to a personal computer for data collection in ASCII-file format.
3. Results and Discussions
3.1. UV/Vis and CD Spectra
Figure 2 presents the UV/vis of PIN (11 µM) in ethanol-aqueous solution (7.5% v/v) in the presence of five different concentrations of AOT (5 - 500 µM) corresponding to molar concentration ratios of surfactant to dye from 0.45:1 to 45:1 respectively. The effect of changing AOT concentration on the spectral shape of PIN was clear in Figure 2. The absorption maxima of the free dye are found at 600 and 546 nm in addition to a shoulder over 505 nm, which are attributed to the monomer, dimer, and higher aggregate forms of PIN respectively [9,18]. The intensity of the apparent bands at 600 and 552 nm decreases as the surfactant to dye ratio increases, and the formation of a new broad blue-shifted band is visible, with intensity and maximum wavelength deeding
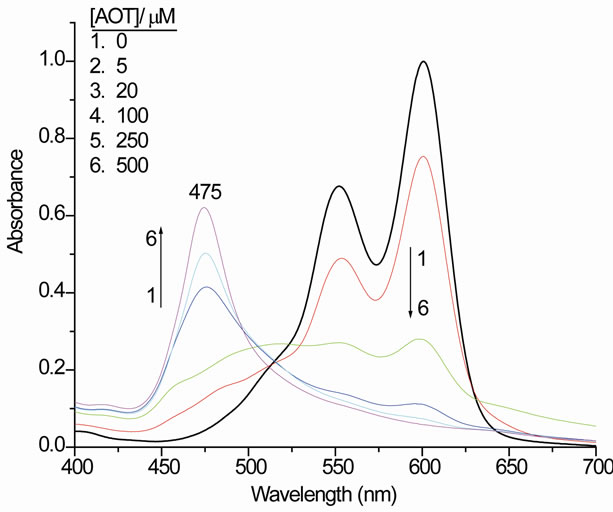
Figure 2. The visible absorption spectra of an ethanol-aqueous solution (7.5% v/v) of 11 µM PIN in the presence of five different concentrations of AOT at 25˚C in a 1.00 cm cell.
on the AOT to dye ratio (Figure 2). At an AOT/PIN ratio of 9:1 (spectrum 4 in Figure 2), the blue-shifted band over about 475 nm is clearly shown. The absorbance over 600 nm reaches its lowest intensity at an AOT/PIN molar ratio of 45:1 (spectrum 6 in Figure 2). At even higher AOT/dye molar ratios, the intensity of the induced blue shifted band at 475 nm remains the same. There is a clear isosbestic point at about 497 nm for the spectra 4 - 6 in Figure 2.
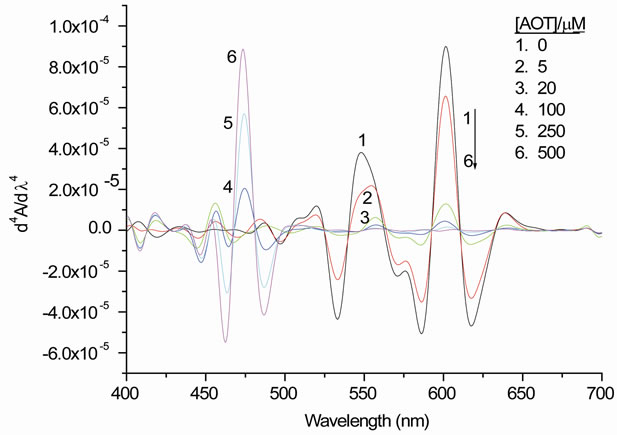
Figure 3(a) shows the fourth derivative spectra of the UV/vis-spectra shown in Figure 2. The changes in the intensity of the derivative bands in Figure 3(a) become clearer and they were measured quantitatively [17,19]. Figure 3(b) shows the most obvious bands of PIN over 475, 550, and 601 nm as increasing or decreasing in their intensities against the change in AOT concentration. The increase of band over 475 nm indicates a favourable interaction between the higher aggregates of PIN and the surfactant. Due to irrelevance, there is nothing to say in Figure 3(b) about the intensity changes for the other components presented in the fourth derivative spectrum (Figure 3(a)).
 (a)
(a)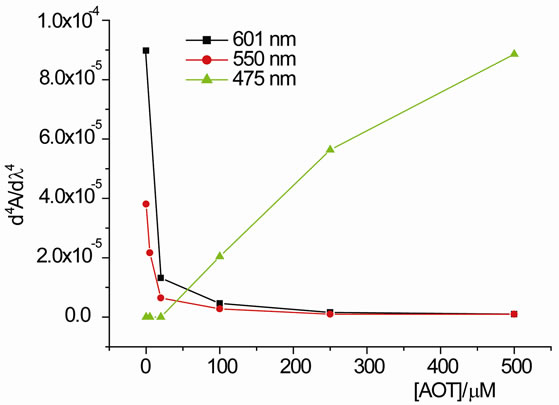 (b)
(b)
Figure 3. (a) The fourth derivative spectra that shown in Figure 2; (b) The peak heights of the fourth derivative spectra for the main absorption bands as a function of AOT concentration.
Figure 4 shows the CD spectra of PIN (11 µM) in ethanol-aqueous solution (7.5% v/v) in the presence of four different concentrations of AOT (5 - 750 µM) corresponding to molar concentration ratios of surfactant to dye from 0.45:1 to 68:1 respectively. No CD spectrum is observed in the absence of AOT. A negative band at 467 nm and a positive one at about 499 nm are clearly shown. This broad couplet reaches its maximum amplitude in spectrum 3, which corresponds to Spectrum 6 in Figure 2.
The reported value of the critical micelle concentration (cmc) for AOT in water at room temperature is 2400 µM [20]. All spectra in Figures 2 and 4 regarding AOT concentrations are below the cmc value. Cmc values show rise in the case of adding solvents less polar than water like ethanol. The two overlapping excitonic absorption bands breaks down completely and loses its optical activity when AOT concentration exceeding its cmc, which we have observed experimentally at AOT/PIN molar ratio of 270:1.
Figure 5 shows the resolved absorption bands of spectrum 6 in Figure 2 using PeakFit program, which is non-linear peak-fitting program from Systat software Inc. Voigt function was chosen for the pure analytical computation and the line shape arising as a result of the convolution of the Lorentzian and Gaussian components within a spectroscopic peak. The three λmax values over 467, 475, and 499 nm that obtained from PeakFit program for the most excitonic obvious band (spectrum 6 in Figure 2) are in very good agreement with the values obtained from the fourth-derivative spectrum (Figure 3(a)) and from the excitonic CD band in Figure 4. There is nothing to say about the other λmax values more than 500 nm due to irrelevance here. The graph of the residuals (not shown here), which depicts the difference between the experimental absorption spectrum and the spectrum calculated with PeakFit program on the basis of
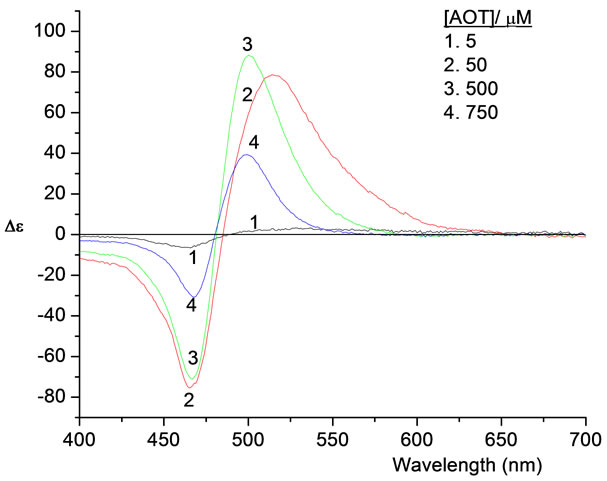
Figure 4. CD spectra of an ethanol-aqueous solution (7.5% v/v) of 11 µM PIN in the presence of four different concentrations of AOT at 25˚C in a 1.00 cm cell.
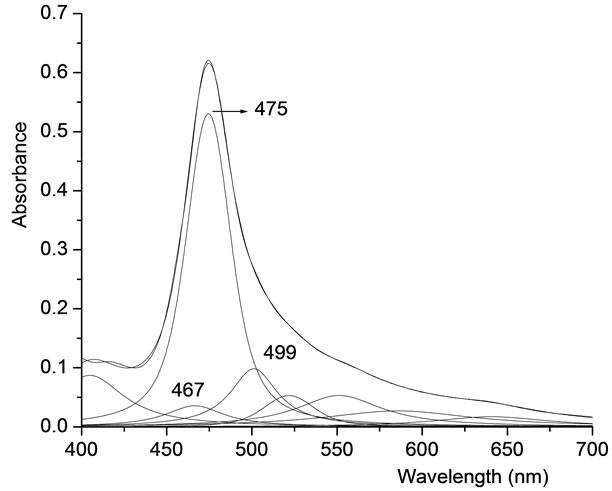
the different components, shows absolute values that are statistically highly acceptable, in which their percentage in their maximum values to the values of the absorption are tried during this work to be less than 1%.
3.2. Effect of Ethanol on the Spectra
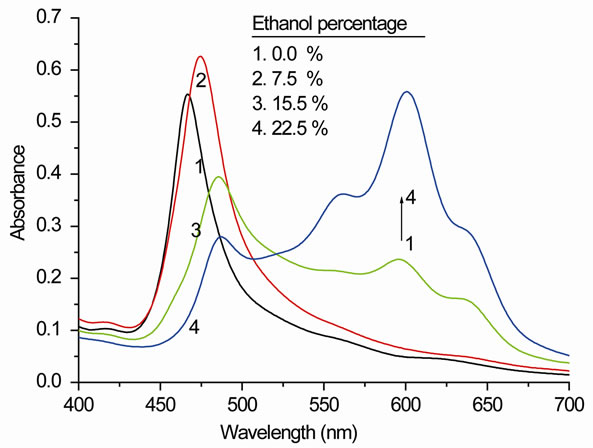
Ethanol is known to affect the aggregation behavior of dyes, and it will affect the aggregation behavior of the surfactant, including its cmc. Figure 6" target="_self"> Figure 6(a) shows the effect of added ethanol (from 0% to 22.5%) to an aqueous solution of an AOT/PIN molar ratio of 45:1 on the UV/vis spectral shape. Except for an initial weak increase in the absorption intensity, the band at 468 nm is seen to decrease strongly in intensity as ethanol is added to the solution. The associated red-shift of the band maximum can be assumed to be due to the overlap with the developing bands at the low-energy side of the spectrum. We also note the strong increase of the monomer dye absorption at 600 nm and the dimer absorption at 555 nm. There is, even at the highest ethanol concentration, a significant residual absorption at around 480 nm, which indicates the presence of a higher dye aggregate.
In the corresponding CD spectra (Figure 6(b)) the couplet between 467 and 499 nm, which dominated the spectra shown in Figure 4, is present at ethanol concentrations below 10%. It reaches its largest amplitude at 7.5% ethanol content. The amplitude is about three-fold compared to the spectra without ethanol. Increasing the ethanol concentration, however, has the opposite effect, where the couplet breaks down, just as the blue-shifted band in the visible absorption. The residual band at 485 nm, which is seen under these conditions in the visible spectrum, displays a positive absorption in the CD.
It should be concluded that ethanol in low concentrations promotes formation of the strongly CD active aggregate resulting from the interaction between the AOT
 (a)
(a)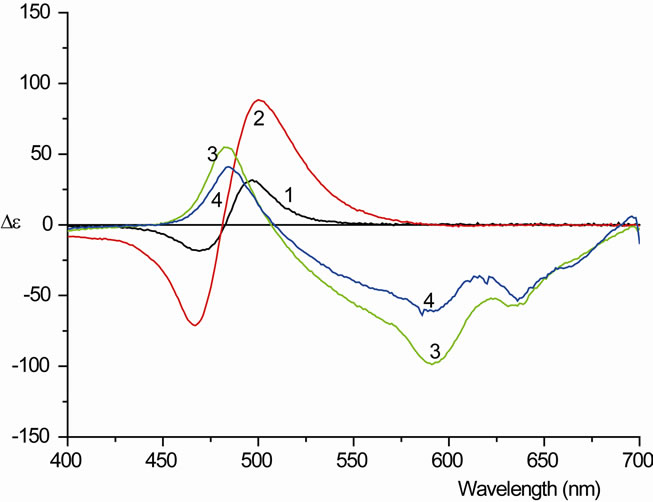 (b)
(b)
Figure 6. (a) The visible absorption an aqueous solution of PIN (11 µM) and AOT (500 µM) with different ethanol percentages (0% to 22.5%) at room temperature; (b) The CD spectra of Figure 6(a).
and PIN. At higher ethanol concentrations the dye becomes mostly dissolved in monomeric form, but a part of it remains aggregated, though in a different form.
3.3. Effect of Temperature on the Spectra
Figure 7 shows how the visible absorption and the CD spectra of an AOT/PIN ethanol-aqueous solution (7.5%) of a 45:1 molar ratio respond to changes of the temperature. At lower temperature (5˚C), the intensity of the absorption band has its largest value; we also note a slight blue-shift of the band maximum to 470 nm. The absorbance of the monomeric dye at 600 nm is minimal. Increasing the temperature has two effects: the intensity of the blue-shifted band decreases, and the band is shifted to the red. At the same time most of the absorbance is shifted into a broad band reaching from 500 to 650 nm, in which peaks corresponding to monomeric dye and to other aggregated species are clearly visible.
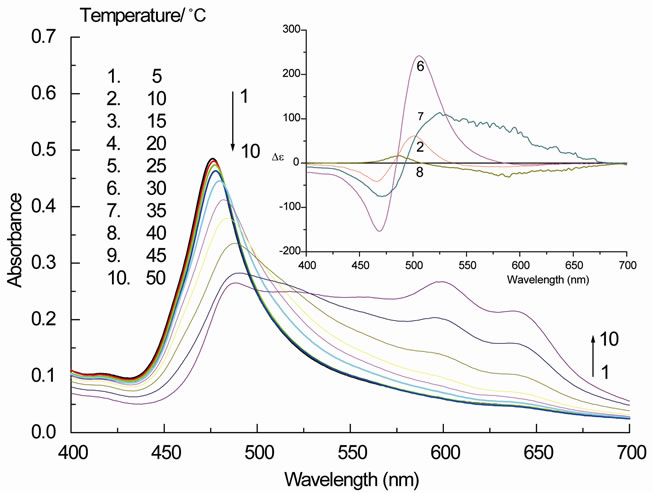
Figure 7. The visible absorption of an ethanol-aqueous solution (7.5% v/v) of PIN (11 µM) and AOT (500 µM) at different temperatures (5˚C to 50˚C) (insets: corresponding CD spectra for spectra 2, 6, 7, and 8).
The CD spectra (insets) reflect this somewhat unstructured behavior. The designate CD band at low temperature collapses into one positive band at 460 nm when a temperature of 45˚C is reached, and the broad band shows weak negative CD absorption. Both the visible absorption and the CD spectra taken at 45˚C are similar in shape to the spectrum 3 in Figure 6, indicating that excess ethanol and excess heat affect the aggregating behavior of PIN in the presence of AOT in a similar way.
4. Discussion
AOT induces very strong blue-shifted band in PIN solutions at concentrations below the cmc (Figure 2). The reported value for the cmc (2400 µM, [20], of AOT in pure water at room temperature would correspond to an AOT/PIN molar ratio of 220:1 when the PIN concentration is 11 µM. In the figure, there is a developed progressive blue shifted band, which its intensity increases until the AOT/PIN molar ratio is reached to 45:1 with a wavelength of 475 nm. It is obvious that AOT induces a sharp and single absorption band with PIN, indicating that the dye cations aggregate systematically with reasonable distances between each other, and they are not overcrowded because there are no multiple bands.
Conductometric titrations show a 1:1 stoichiometry interaction between the cationic dye and AOT [15]. The question arises whether PIN binds at alternating anionic groups of aggregated AOT, and whether these aggregates are already present in the solution before PIN is added. The cmc tells us that AOT is also present in monomeric form when the AOT/PIN molar ratio is less than 220:1, because the transition from premicellar to micellar solution at the cmc occurs dramatically over a narrow concentration range, and additional surfactant exists as aggregates or micelles [21]. As the surfactant concentration increases further, micelles can be deformed and can change into different shapes [22]. The presence of cationic dye molecules in the solution may induces the formation of AOT aggregates, which can easily interact with the anionic site in AOT molecules. Ionic coupling yields larger molecular structures, which become saltlike macromolecules and have the capability to aggregate in solution. The enhancement of this aggregation depends directly on the AOT/PIN molar ratio.
The intense and sharp positive and negative bands in the CD spectra (Figure 4) reflect a presence of exciton splitting [23], which indicates to a strong dye-dye interaction with an optimum status at the AOT/PIN molar ratio of 45:1. Regardless of the interaction between a part of AOT and PIN, the cmc of the free excess AOT in the solution should not change significantly; however, the new structure may behaves different from the free excess AOT itself. This behavior is noted from the spectral shape of the UV/vis band at an AOT/PIN molar ratio of 270:1 by using pure water solvent, in which the surfacetant is present in a concentration above the cmc, which has an absorbance band shape very similar to the one observed at the ratio of 45:1. This makes us conclude that the mode of aggregation of PIN molecules that induced by AOT molecules less than cmc is similar to that induced by the surfactant at or above its cmc.
The aggregated PIN molecules at the AOT/PIN molar ratio of 270:1 loses its optical activity because the micelles itself that formed at this ratio are optically inactive. In homogeneous solution, 270 molecules of AOT are distributed with one PIN molecule. The micelle size that expressed experimentally as the number of monomers making up the spherical micelles (aggregation number), is generally between 50 and 100 for ionic surfactant with a radius similar to that of the length of an extended hydrocarbon chain, which associated to form regions from which the solvent (water) is effectively excluded and has properties closely related to the liquid hydrocarbon [24]. According to this reported micelle size, the micelle/PIN molar ratio here is about 4:1, and PIN molecules almost present out of the spherical micelle cavity due to location of the sulfonate groups outside the sphere and to the steric consideration with respect to the size of the dye molecules relative to the cavity presents inside the sphere. At the 270:1 molar ratio, the mode of aggregation, in the presence of achiral micelle and probably deformed micelle, forms absence of real induced CD bands. Among the attempts to explaine why AOT/PIN molar ratio over cmc loses its optical activity is the PIN molecules may enter within micelles side by side to the sulfonate groups. Thus, on the basis of steric considerations and also the distortion of the symmetrical shape of the micelle from the presence of PIN molecules inside the micelle cavity, it is to be expected that this explanation in the absence of any optical activity should be excluded.
As a suggested additional work based on our practical results with respect to the shifts in maximum wavelengths of the excitonic absorption bands that caused by the addition of AOT, a study and investigation to this change may be come from extensive theoretical calculations to find out further interpretations and conclusions regarding the mode of AOT/PIN interactions at various conditions, which may draw attentions for promising further important information on this system.
5. Acknowledgements
This work was supported financially by KAAD in Bonn. The technical assistance of Mr. Robert Knierim from Duisburg-Essen University is highly acknowledged.
REFERENCES
- A. N. Maitra and H. F. Eicke, “Effect of Rotational Isomerism on the Water-Solubilizing Properties of Aerosol OT as Studied by Hydrogen-1 NMR Spectroscopy,” Journal of Physical Chemistry, Vol. 85, No. 18, 1981, pp. 2687-2691. doi:10.1021/j150618a024
- E. Pramauro and E. Pelizzetti, “Surfactants in Analytical Chemistry: Applications of Organized Amphiphilic Media,” Elsevier, Amsterdam, 1996.
- F. Candau, Y. S. Leong, G. Pouyet and S. Candau, “Inverse Microemulsion Polymerization of Acrylamide: Characterization of the Water-in-Oil Microemulsions and the Final Microlatexes,” Journal of Colloid and Interface Science, Vol. 101, No. 1, 1984, pp. 167-183. doi:10.1016/0021-9797(84)90017-1
- J. Eastoe, B. H. Robinson, A. J. W. G. Visser and D. C. Steytler, “Rotational Dynamics of AOT Reversed Micelles in Near-Critical and Supercritical Alkanes,” Journal of the Chemical Society, Faraday Transactions, Vol. 87, No. 12, 1991, pp. 1899-1903. doi:10.1039/ft9918701899
- G. Calvaruso, A. Minore and V. Turco Liveri, “FT-IR Investigation of the Urea State in AOT Reversed Micelles,” Journal of Colloid and Interface Science, Vol. 243, No. 1, 2001, pp. 227-232. doi:10.1006/jcis.2001.7878
- L. M. Nikolenko, A. V. Ivanchihina, S. B. Brichkin and V. F. Razumov, “Ternary AOT/Water/Hexane Systems as ‘Micellar Sieves’ for Cyanine Dye J-Aggregates,” Journal of Colloid and Interface Science, Vol. 332, No. 2, 2009, pp. 366-372. doi:10.1016/j.jcis.2008.12.022
- A. Jada, J. Lang and R. Zana, “Relation between Electrical Percolation and Rate Constant for Exchange of Material between Droplets in Water in Oil Microemulsions,” Journal of Physical Chemistry, Vol. 93, No. 1, 1989, pp. 10-12. doi:10.1021/j100338a004
- S. Bisal, P. K. Bhattacharya and S. P. Moulik, “Conductivity Study of Microemulsions: Dependence of Structural Behavior of Water/Oil Systems on Surfactant, Cosurfactant, Oil, and Temperature,” Journal of Physical Chemistry, Vol. 94, No. 1, 1990, pp. 350-355. doi:10.1021/j100364a060
- W. West and S. Pearce, “The Dimeric State of Cyanine Dyes,” Journal of Physical Chemistry, Vol. 69, No. 6, 1965, pp. 1894-1903. doi:10.1021/j100890a019
- D. L. Akins and J. W. Macklin, “Dependence of Raman Scattering by Aggregated 2,2-Cyanine on pH and Excitation Wavelength,” Journal of Physical Chemistry, Vol. 93, No. 16, 1989, pp. 5999-6007. doi:10.1021/j100353a014
- P. Bilski, R. N. Holt and C. F. Chignell, “Premicellar Aggregates of Rose Bengal with Cationic and Zwitterionic Surfactants,” Journal of Photochemistry and Photobiology A, Vol. 110, No. 1, 1997, pp. 67-74. doi:10.1016/S1010-6030(97)00166-4
- M. Sarkar and S. Poddar, “Studies on the Interaction of Surfactants with Cationic Dye by Absorption Spectroscopy,” Journal of Colloid and Interface Science, Vol. 221, No. 2, 2000, pp. 181-185. doi:10.1006/jcis.1999.6573
- H. Von Berlepsch and C. Böttcher, “Network Superstructure of Pseudoisocyanine J-Aggregates in Aqueous Sodium Chloride Solution Revealed by Cryo-Transmission Electron Microscopy,” Journal of physical chemistry B, Vol. 106, No. 12, 2002, pp. 3146-3150. doi:10.1021/jp0143701
- P. Mukerjee and K. J. Mysels, “A Re-Evaluation of the Spectral Change Method of Determining Critical Micelle Concentration,” Journal of the American Chemical Society, Vol. 77, No. 11, 1955, pp. 2937-2943. doi:10.1021/ja01616a003
- M. K. Pal and P. K. Pal, “Dichroic Probe of Different Modes of Aggregation of Pinacyanol by Bis(2-Ethylhexyl)sulfosuccinate below and above Its Critical Micelle Concentration,” Journal of Physical Chemistry, Vol. 94, No. 6, 1990, pp. 2557-2559. doi:10.1021/j100369a062
- R. Sabaté and J. Estelrich, “Determination of Micellar Microenvironment of Pinacyanol by Visible Spectroscopy,” Journal of physical chemistry B, Vol. 107, No. 17, 2003, pp. 4137-4142. doi:10.1021/jp027409q
- L. Antonov and D. Nedeltchera, “Resolution of Overlapping UV-Vis Absorption Bands and Quantitative Analysis,” Chemical Society Reviews, Vol. 29, No. 3, 2000, pp. 217-227. doi:10.1039/a900007k
- H. Min, J. Park, J. Yu and D. Kim, “The Spectroscopic Studies on the Aggregation Behavior of Cyanine Dyes,” Bulletin of the Korean Chemical Society, Vol. 19, No. 6, 1998, pp. 650-654.
- S. J. Khouri, and V. Buss, “UV/Vis Spectral Study of the Self-Aggregation of Pinacyanol Chloride in Ethanol-Water Solution,” Journal of Solution Chemistry, Vol. 39, No. 1, 2010, pp. 121-130. doi:10.1007/s10953-009-9476-2
- E. F. Williams, N. T. Woodberry and J. K. Dixon, “Purification and Surface Tension Properties of Alkyl Sodium Sulfosuccinates,” Journal of Colloid and Interface Science, Vol. 12, No. 4, 1957, pp. 452-459.
- W. C. Presto and W. Preston, “Some Correlating Principles of Detergent Action,” Journal of Physical and Colloid Chemistry, Vol. 52, No. 1, 1948, pp. 84-97. doi:10.1021/j150457a010
- C. Burda, X. Chen, R. Narayanan and M. A. El-Sayed, “Chemistry and Properties of Nanocrystals of Different Shapes,” Chemical Reviews, Vol. 105, No. 4, 2005, pp. 1025-1102. doi:10.1021/cr030063a
- N. Berova and K. Nakanishi, “Exciton Chirality Method: Principles and Applications,” In: N. Berova, K. Nakanishi and R. Woody, Eds., Circular Dichroism: Principles and Applications, Wiley-VCH, New York, 2000, p. 337.
- J. L. Lynn and B. H. Bory, “Surfactants,” In: R. Kirk, Ed., Concise Encyclopaedia of Chemical Technology, Wiley, New York, 1999, p. 1949.
NOTES
*Corresponding author.