Optics and Photonics Journal
Vol.2 No.1(2012), Article ID:18257,10 pages DOI:10.4236/opj.2012.21005
Solvatochromism and Molecular Selectivity of C-(4-chlorophenyl)-N-phenylnitrone: A Photophysical Study
1Department of Chemistry, University of Burdwan, Burdwan, India
2Department of Chemistry, Dr. Bhupendra Nath Dutta Smriti Mahavidyalaya, Hatgobindapur, India
Email: *tanchem_bu@yahoo.co.in, *manasban@rediffmail.com
Received December 9, 2011; revised January 24, 2012; accepted January 31, 2012
Keywords: 1,3-DC efficiency; binding constant; nitrone selectivity; DFT
ABSTRACT
The ground state interaction of C-(4-chlorophenyl)-N-phenylnitrone (N1) with three different a,b-unsaturated ketones (K1 - K3) in very dilute solution (10−6 mol·dm−3) has been noticed through charge transfer band formation in the visible region. The experimentally measured transition dipole, ground state resonance energy and formation constants of the complexes indicate interaction selectivity of the acyclic nitrone (N1) for the ketones. Molar absorptivity of the absorbing complexes were determined for all the three N1/K (1:1) interacting systems in toluene. Experimental findings were well rationalized with the help of electron density based global electrophilicity and nucleophilicity indices as well as with frontier molecular orbital calculations.
1. Introduction
Chemists are increasingly interested in the cooperative effect in non-covalent interactions, which can be successfully employed for the construction of quite complex structures [1]. Multiple hydrogen bonds, coordination bonds, as well as several other forms of homogeneous and heterogeneous weak interactions were thought to have been effective to bind two different entities strongly. In both chemistry and biology non-covalent electron donor-acceptor (EDA) interactions have received much attention in recent years [2-4]. These EDA complex compounds can be utilized as photocatalysts [5], organic semiconductors [6] and dendrimers [7]. They are important in studying redox process [8], nonlinear optical activity [9] and in microemulsion activity [10]. EDA interactions also play a vital role in the field of drug-receptor binding mechanisms [11].
The polar heterocyclic compounds show strong solvatochromism [12]. Nitrones, an important category of 1,3-dipolar species [13-17], undergo facile concerted [π4s + π2s]-cycloaddition to different dipolarophiles producing isoxazolidines which serve as a key step in a number of natural product syntheses [13,18-20]. Nitrones are a family of such heterocyclic compounds that have been studied extensively [13-22] due to their stability.
The 1,3-dipolar cycloaddition reaction between a nitrone and an unsaturated dipolarophile is a well-known process in the ground state leading to cyclic adducts. Much computational [23,24] investigation of these reactions were done, mostly following the optimization of transition state (TS) which is energetically an activated complex lying between the reactants and products. The existence of ground state activated complex of these reactions has prompted us to see whether there exists some weak complexation of the reactants in ground state in the solution phase. Any such possibility could be monitored and studied experimentally by common techniques [25] through measuring binding property and formation of such weak complexes [26].
A link is therefore sought for predicting the cycloaddition efficiency in terms of tendency towards formation of weak complexes in solution, despite that many other dominant factors prevailing in solution might affect the prediction in gas phase. However, we have explored this avenue in conjunction with reactivity based on DFT computed electrophilicity/nucleophilicity indices in order to predict the efficiency of 1,3-DC reactions. The success of our model seems to be revealed through the results and discussion section.
Here, we have reported the solvatochromic properties of C-(4-chlorophenyl)-N-phenylnitrone (N1 in Figure 1). The objective of this present work is to investigate systematically the intermolecular interactions associated
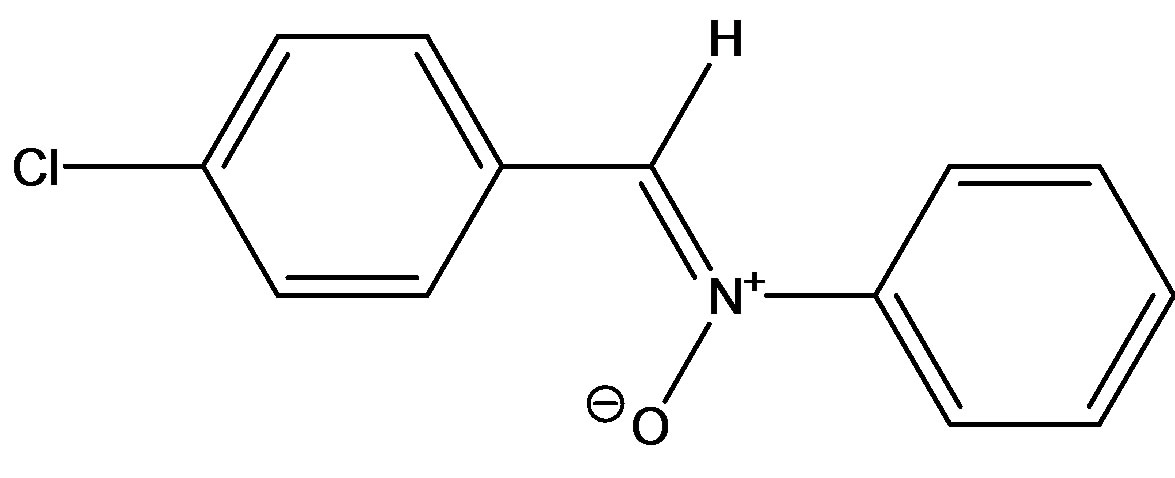 (C-(4-chlorophenyl)-N-phenylnitrone(N1)
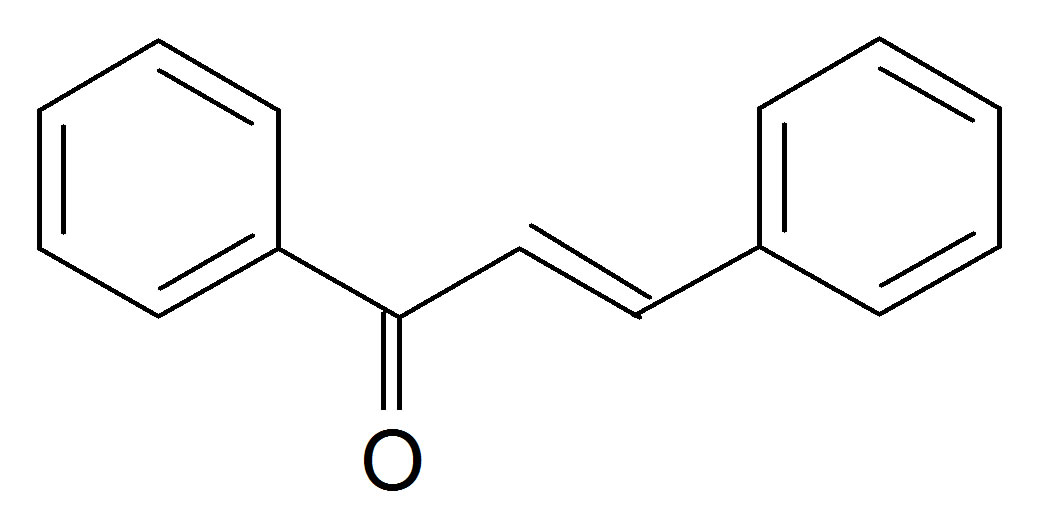 Benzal acetophen
one (K1) 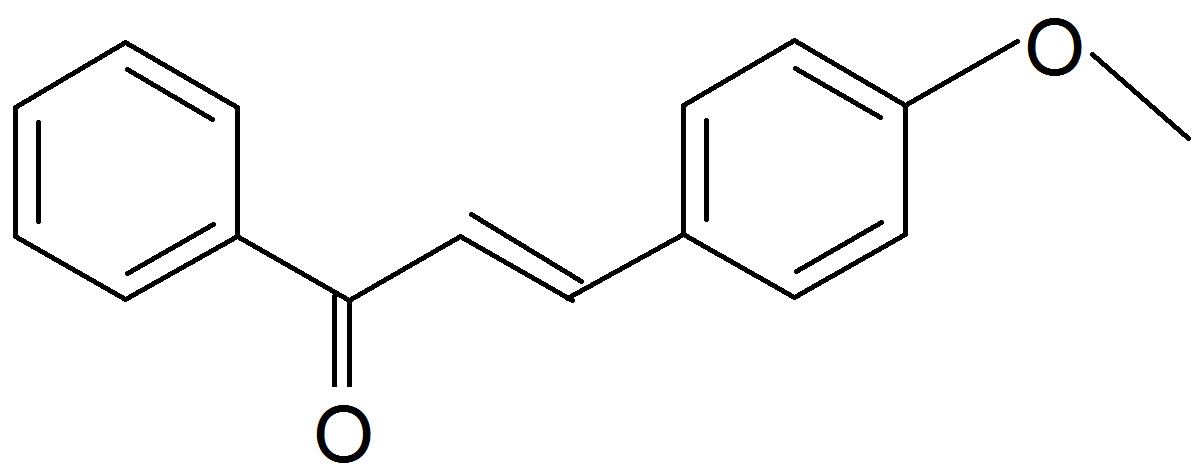 (Anisalacetophenone (K2)
 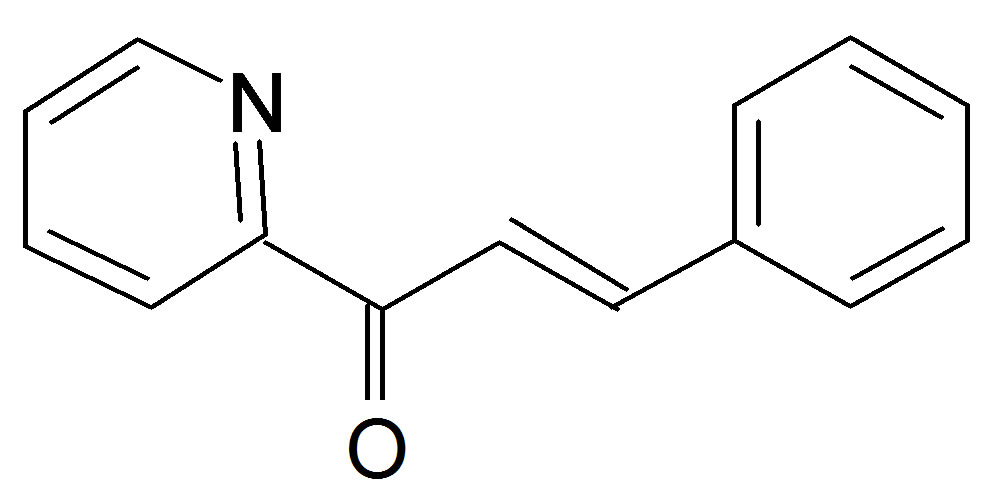 Benzylidene 2-acetylpyridine (K3)
Figure 1. Structures of the nitrone (N1) and the three a,bunsaturated ketones (K1 - K3) used here.
with the nitrone molecules (Figure 1) in different solvent environments as well as in the presence of different a,b-unsaturated ketones. On these grounds, we decided to observe the non-covalent interaction occurring mainly through charge transfer between the nitrone N1 and three different unsaturated ketones K1, K2 and K3 (shown in Figure 1) which could predict the molecular selectivity of the nitrone. When we observe the electronic spectra of the complex and the individual compounds involved in the complex, we find a new electronic absorption band attributed to neither the nitrone (N1) nor the ketones (K). In our previous study [27] the molecular selectivity of [60]-fullerene among different porphyrin molecules was checked by using the fluorescence probe method. The present paper reports the trend of forming charge transfer complexes by the nitrone (N1) with the unsaturated ketones (K1 - K3) in terms of experimental transition dipole strengths, resonance energies and formation constants of the complexes in non-polar toluene medium. Experimental findings of the trend in non-covalent interaction were well substantiated theoretically with the help of DFT calculated electrophilicity and nucleophilicity indices [23,24,28-30] as well as in terms of frontier molecular orbital energies [24].
2. Experimental Section
2.1. Materials
Toluene of HPLC grade (for spectroscopic study from Merck Chemical Co.) was used as solvent without further purification. C-(4-chlorophenyl)-N-phenylnitrone (N1) was synthesized and purified according to the existing procedure [18,19]. Benzalacetophenone (K1), anisalacetophenone (K2) and benzylidene-2-acetylpyridine (K3) were synthesized according to literature [31].
2.2. Apparatus and Methods
UV Spectra were recorded using a Shimazdu UV-2450 spectrophotometer. The steady state fluorescence emission spectra were recorded on a Hitachi F-4500 spectrofluorimeter equipped with a temperature controlled cell holder.
The geometries of molecular structures were optimized using the hybrid density functional B3LYP method using 6-31G(d) basis set. All the calculations were performed on a IBM-HS21 server cluster/LAN running parallel version of Linda, employing the LINUX version of Gaussian09 [32] together with Gaussview05.
3. Results and Discussion
3.1. Photophysical Study/Solvent Interaction
The photophysical parameters [electronic absorption maxima (λabs), emission maxima (λem) and fluorescence quantum yield (Φfl)] of the nitrone (N1) were determined in a few polar, nonpolar, both protic and aprotic solvents. The energy of maximum absorption [E(A)], fluorescence [E(F)] and Stoke’s shift [E(St)] were reported by using the conversion:
E/kcal·mol−1 = 28590/(λ/nm)
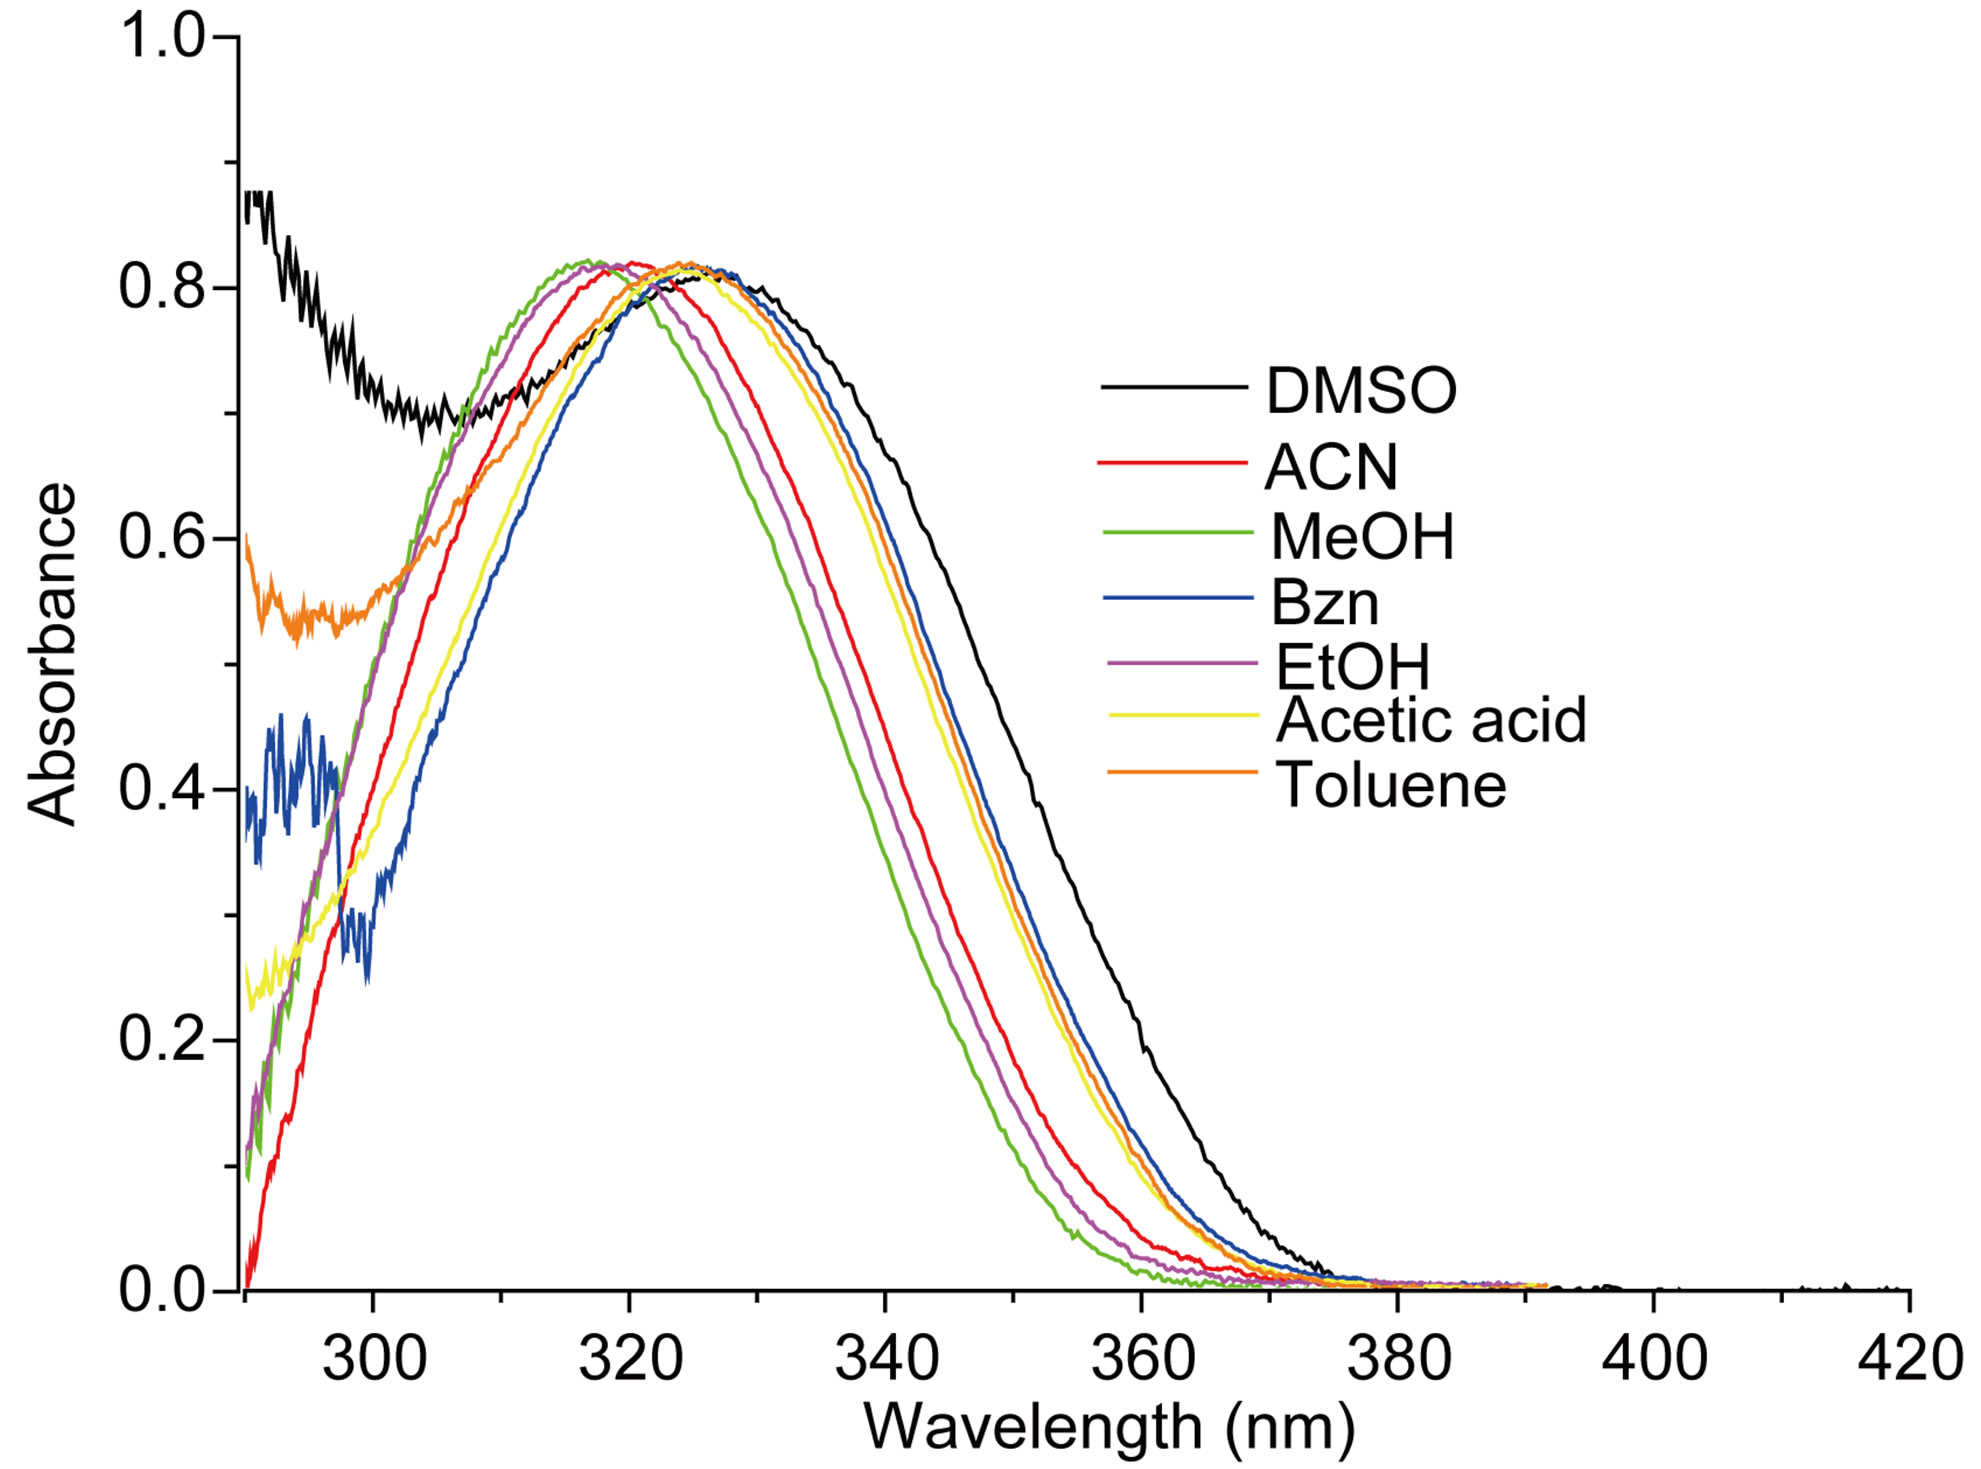
The measured E(A) and E(F) values for the nitrone N1 alone in solvent were given in Table 1. The nitrone shows intense S0 ® S1 absorption at 86.37 (kcal·mol−1) in carbon tetrachloride (CCl4) and the absorption maxima were seen to be shifted hypsochromically by (1 - 3 kcal·mol−1) in other solvents. For the steady state fluorescence, solvent-dependent shifts of the nearest fluorescence band were more or less similar (1 - 5 kcal·mol−1) in the respective solvents. In aprotic solvents the fluorescence band shows almost similar type of structure which looses their prominence as the polarity of the solvent is increased (in Figure 2). The possible origin of structure of the band is presumably the nitrone vibrations.
The maximum absorption energies E(A) of N1 expressed in kcal·mol−1 for aprotic and protic solvents, show a linear correlation with the Reichardt parameter ET (30) [12], as was shown in Figure 3. A linear correlation with the ET(30) scale of solvent polarity is indicative of
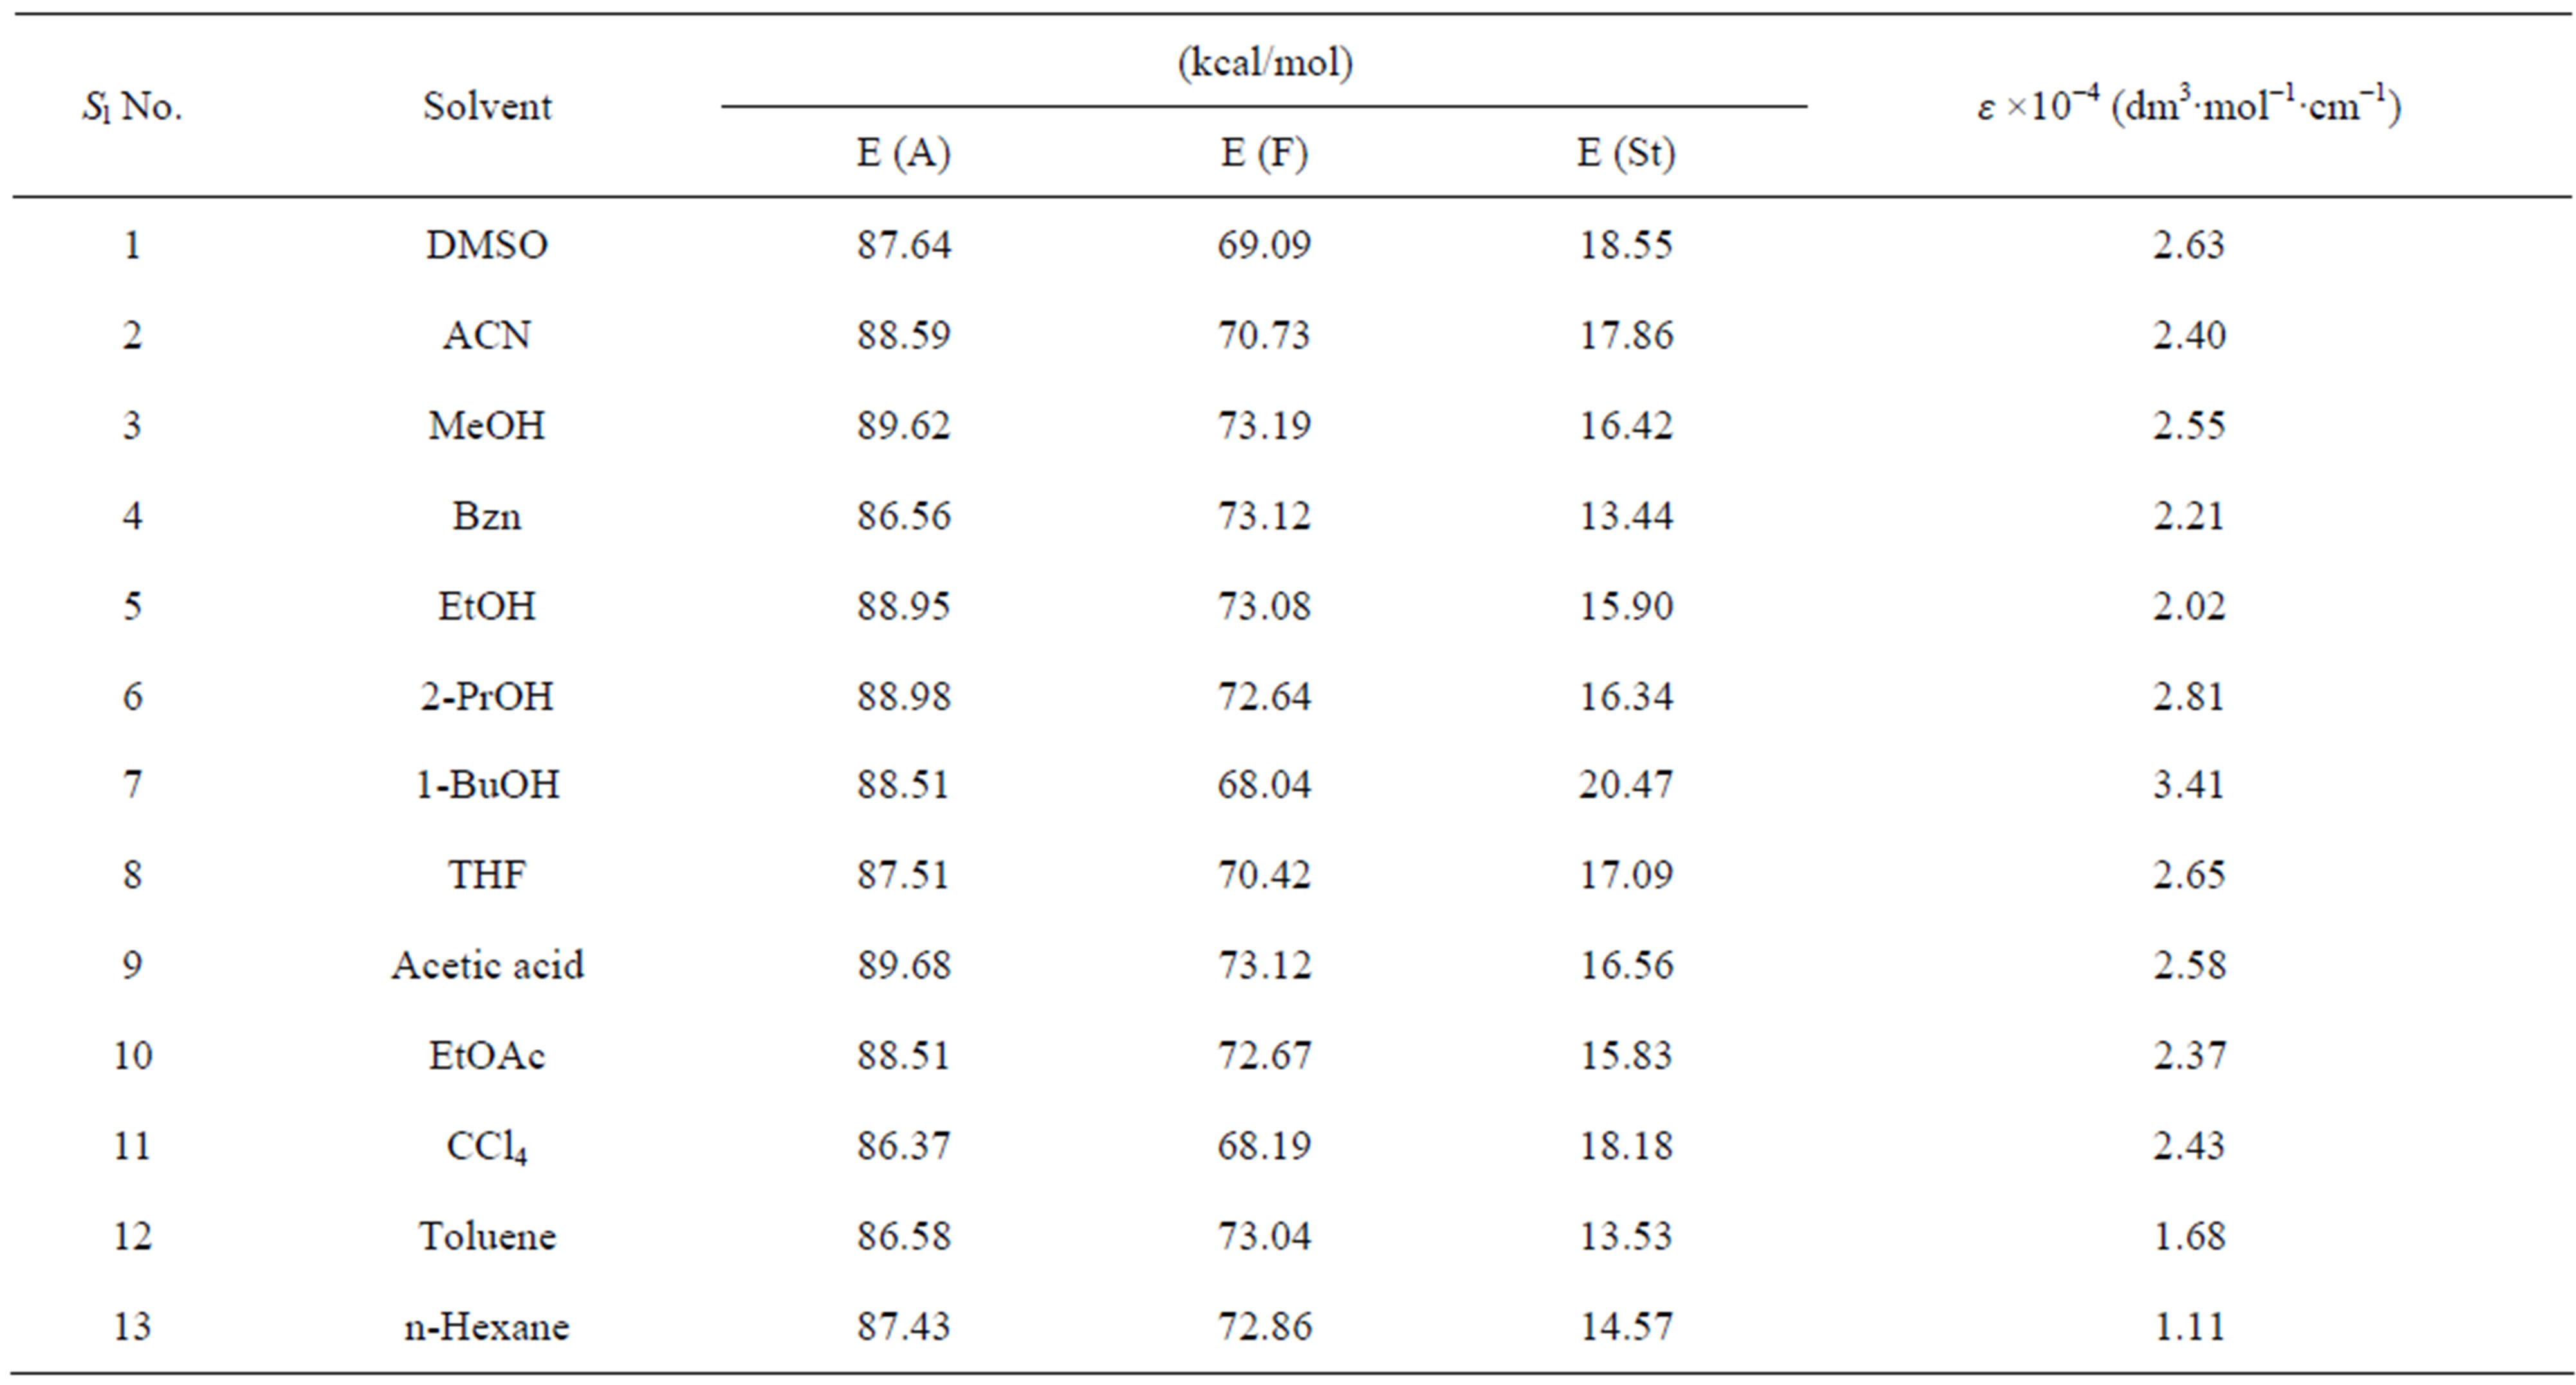
Table 1. Photophysical parameters of N1 in different solvent media.
 (a)
(a)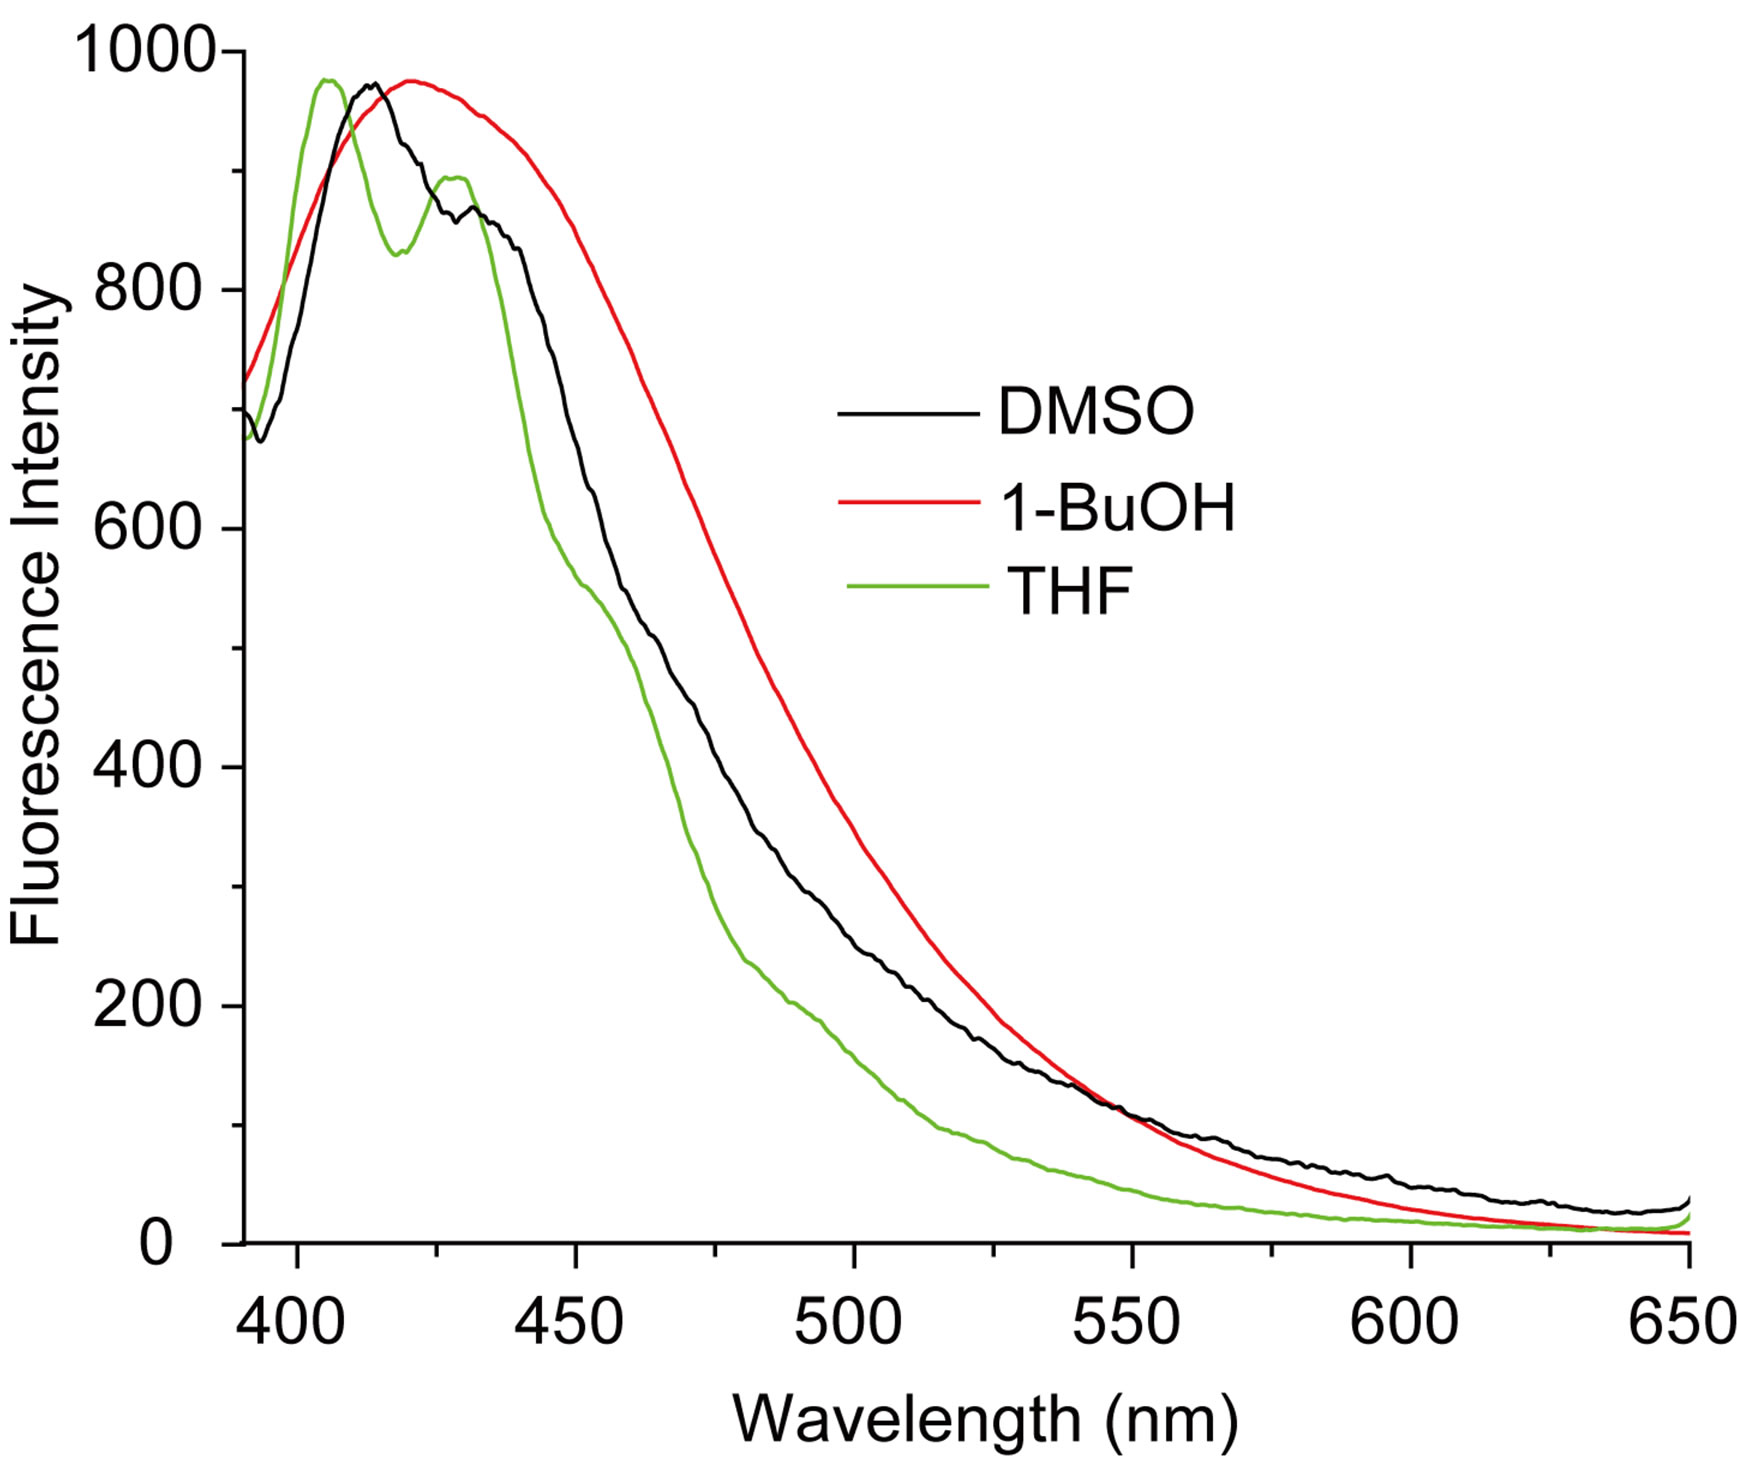 (b)
(b)
Figure 2. (a) Absorption and (b) emission spectra of N1 (4.75 × 10⁻⁶ mol·dm−3) in different solvents.
intramolecular charge transfer (ICT) accompanying the S0 ® S1 transition. The positive slope of E(A) vs ET(30) plot in Figure 3 indicated that the transition is accompanied by a decrease in the dipole moment for the nitrone N1, as is also true for the indicator dye of the ET(30) scale. The poorer sensitivity of E(F) compared to E(A) towards change in the solvent polarity was observed. This could be intelligible in terms of decreased solutesolvent dipolar interaction in the excited state.
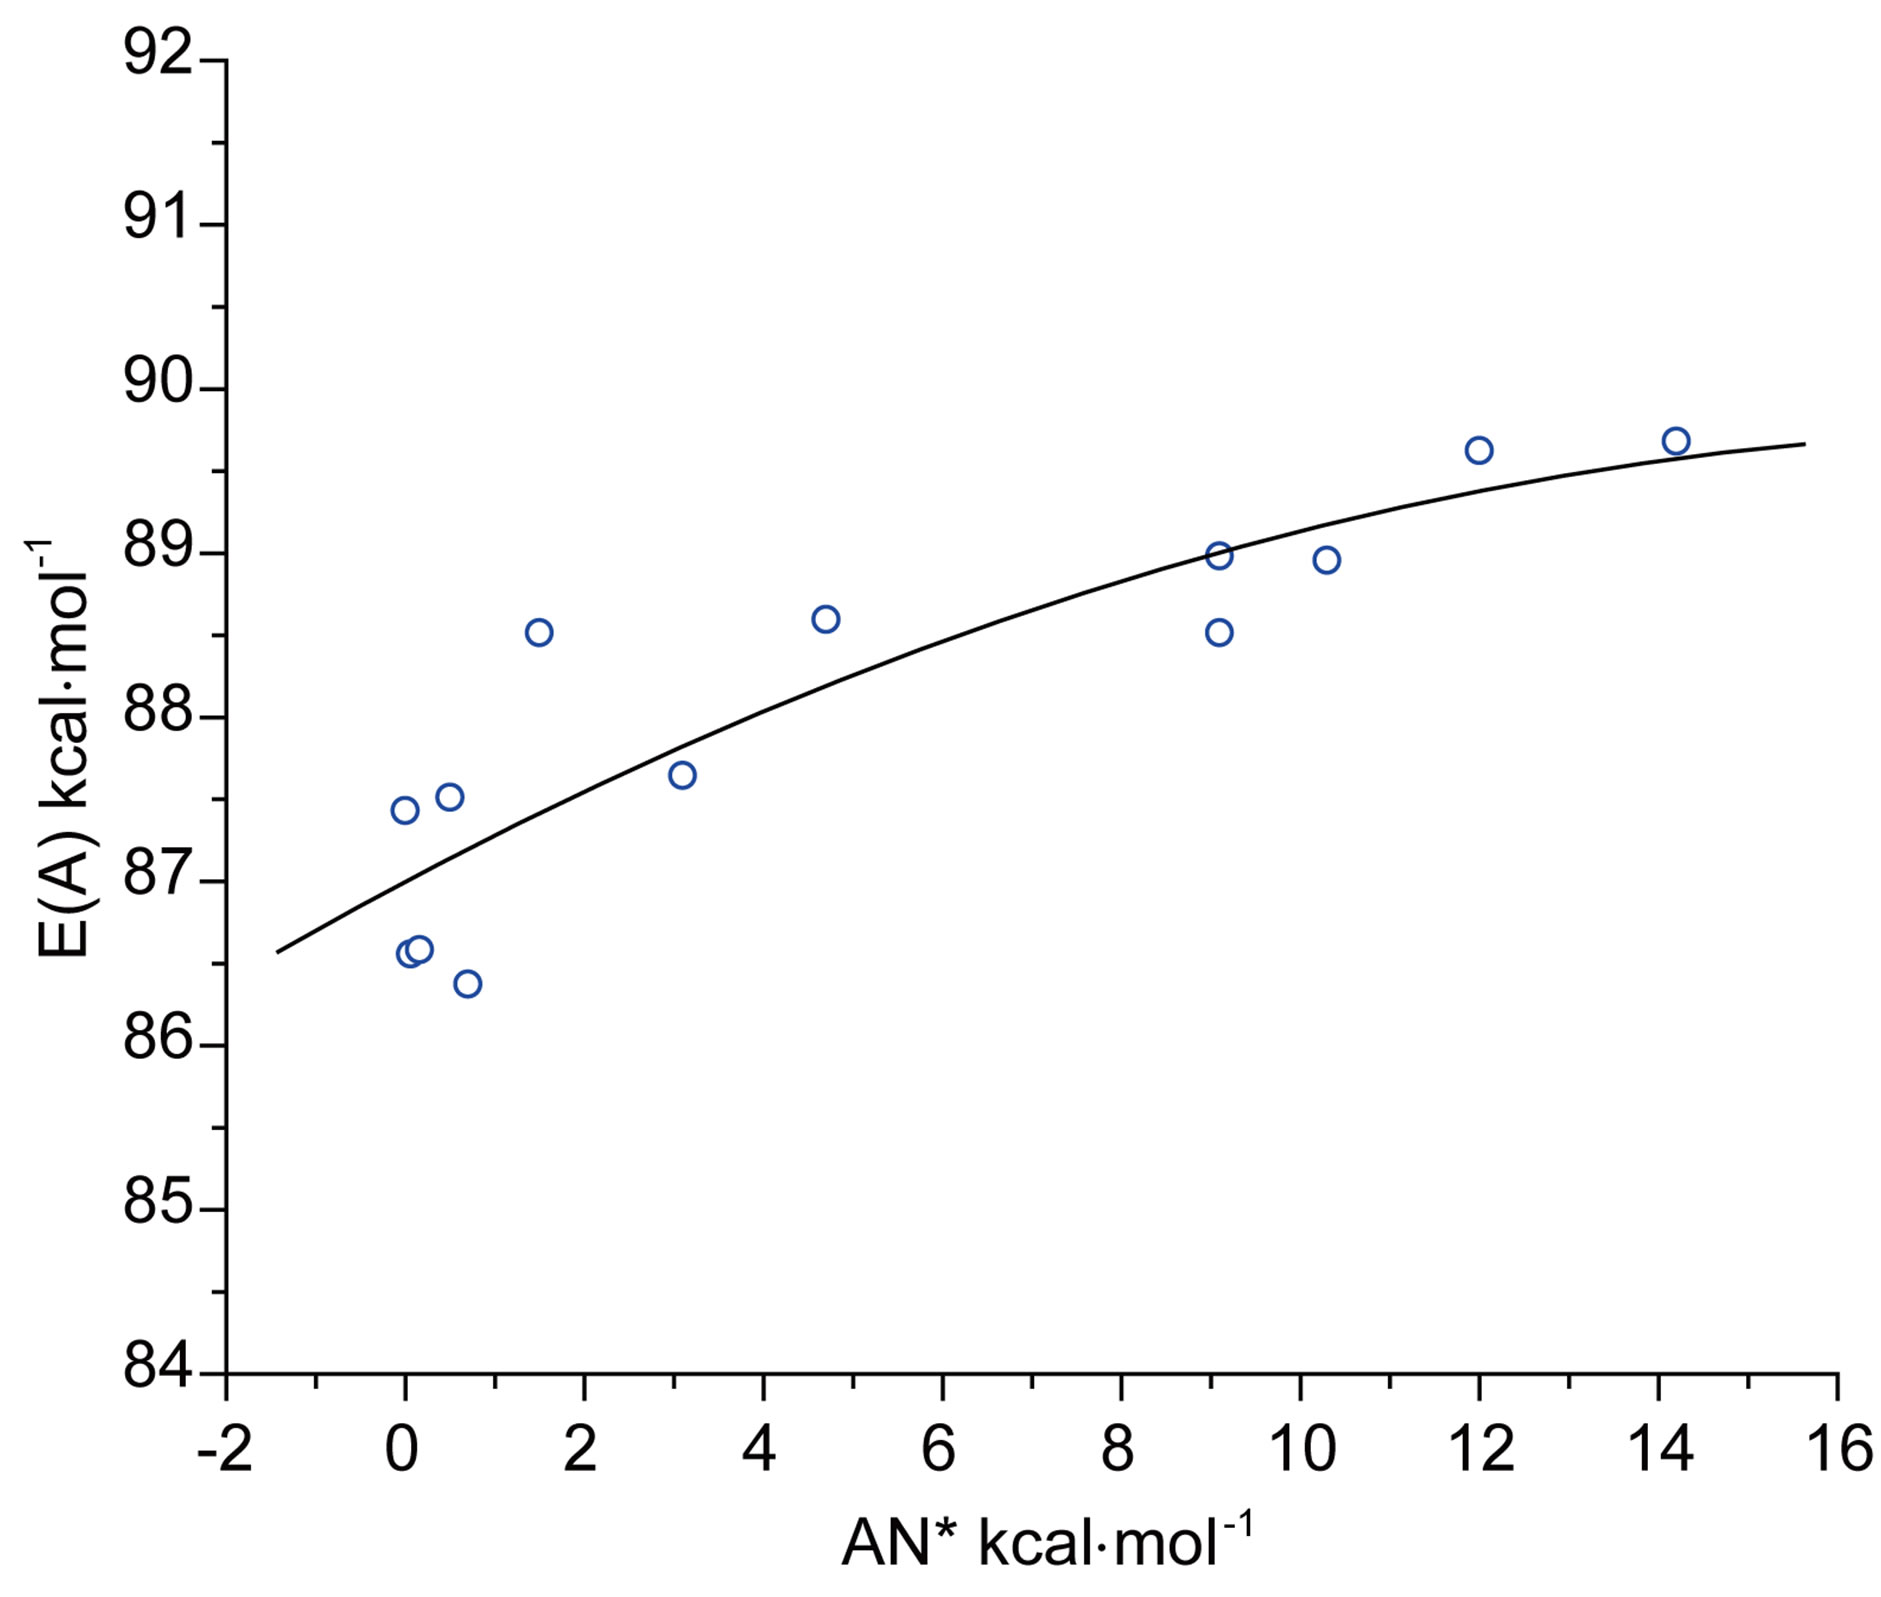
Besides the polarity aspect, Gutmann’s donor number (DN) [33] and modified acceptor number (AN*) of solvents [34] can be used as these are measures of the strength of solvents as Lewis bases and acids respectively. On their basis the effects on E(A) and E(F) could be explained. The maximum absorption energies E(A) of N1 in aprotic and protic solvents, show non-linear growth with the acceptor number of solvents, as has been shown in Figure 4(a). The exponential curvature of the plot indicated that with increasing Lewis acidity, hypsochromic shift in absorption energy is observed and an opposite effect will be expected with increasing basicity of the solvent. It was found that acidity shows better correlation with E(A) than shown by basicity. The opposite type sensitivity of E(F) compared to E(A) towards varia-
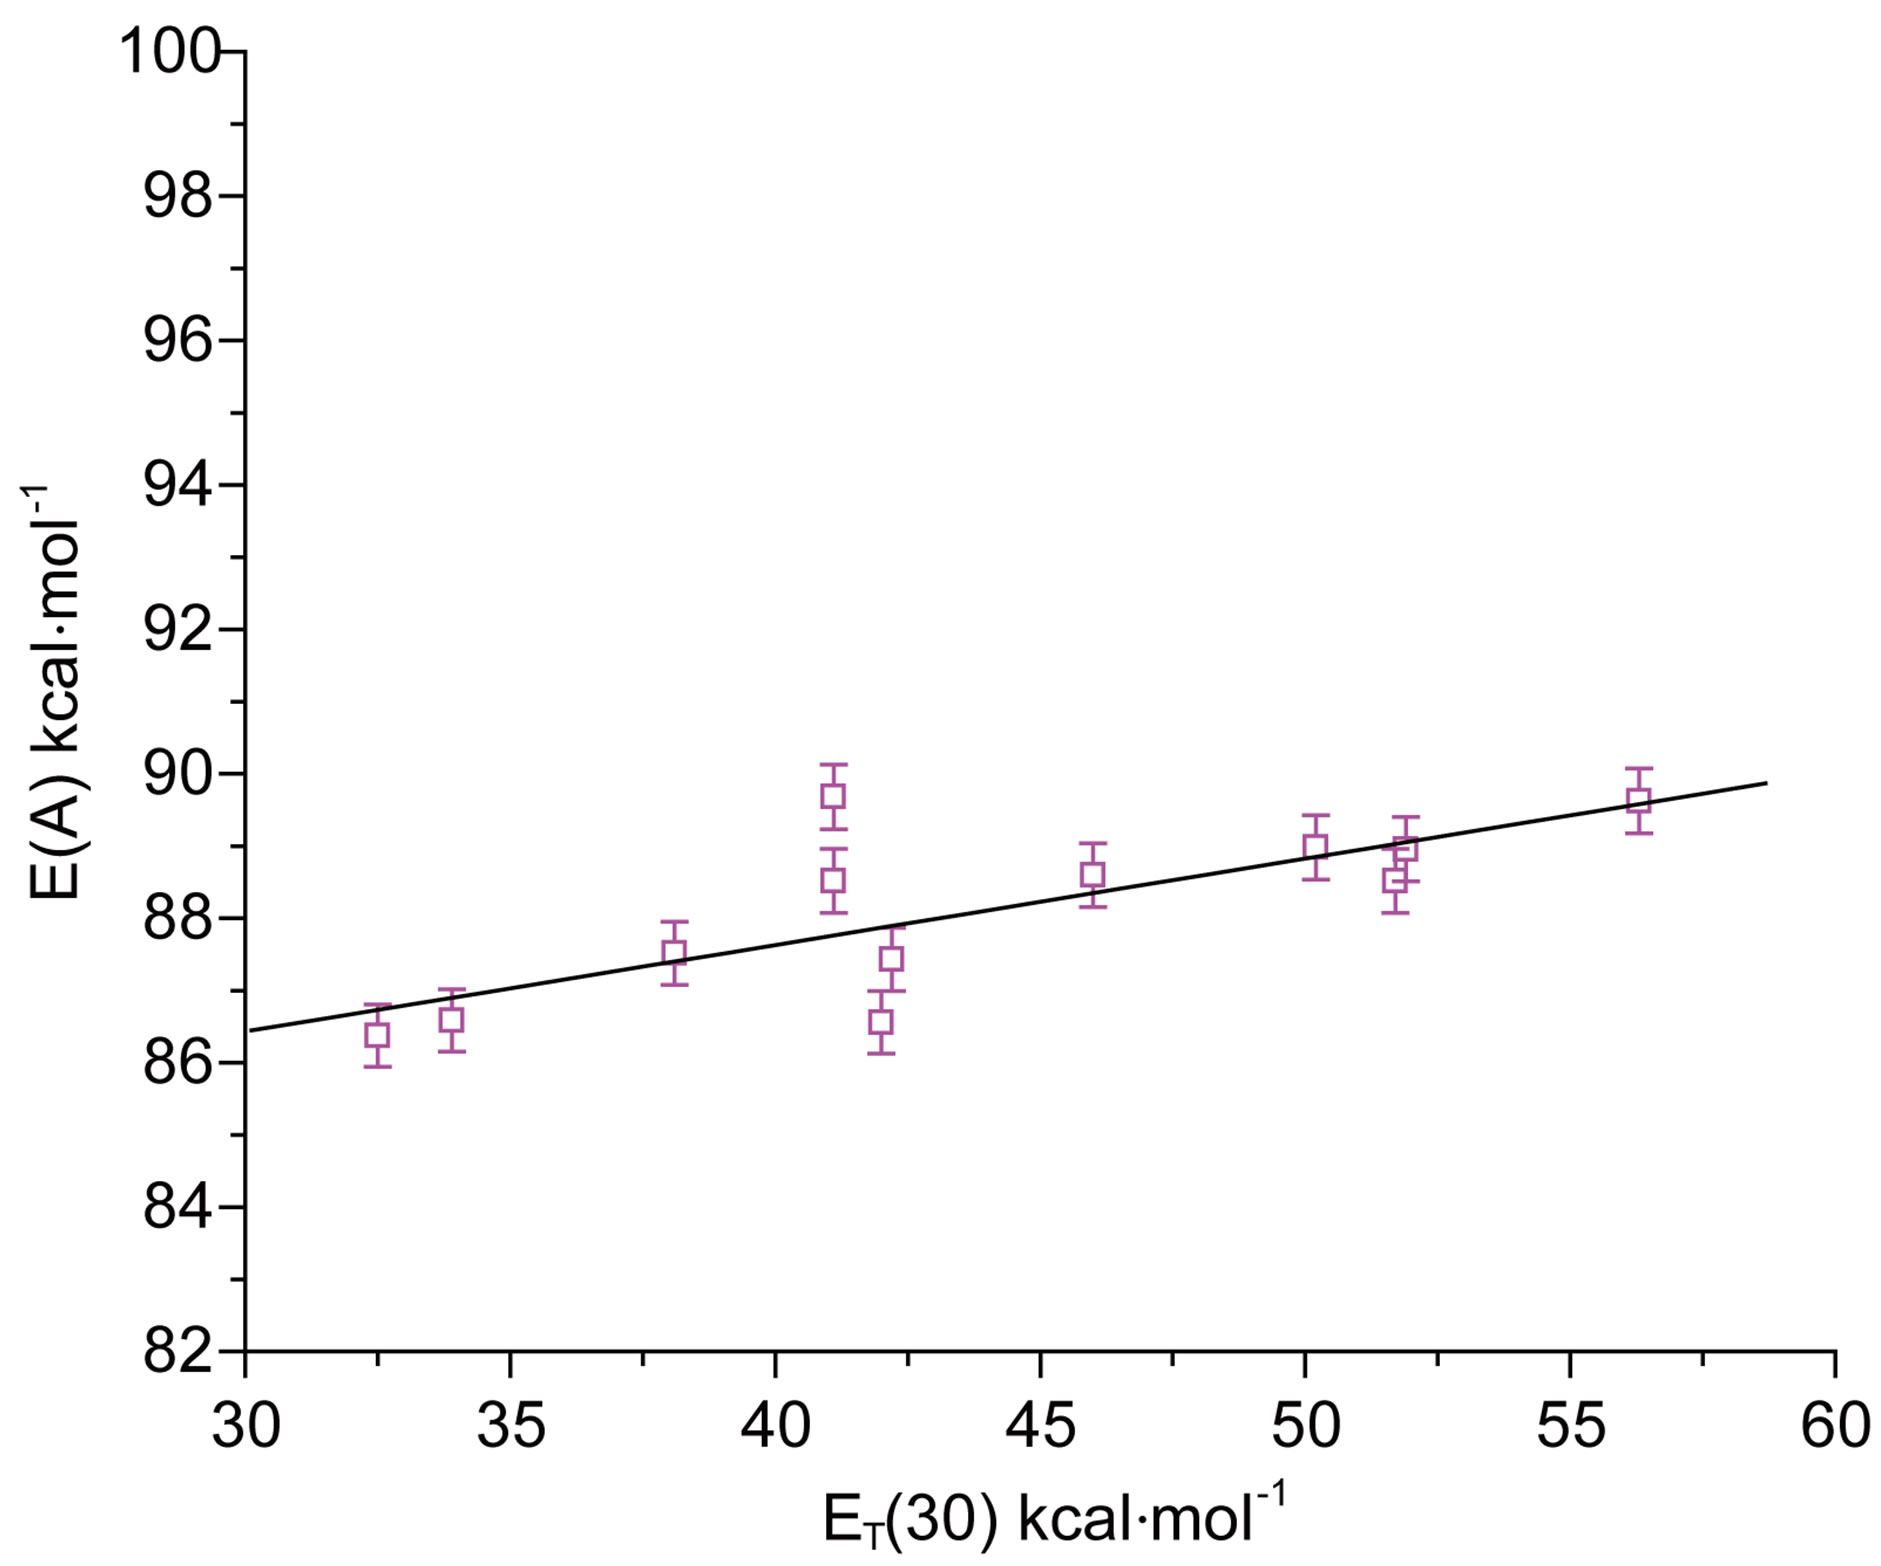
Figure 3. E(A) vs ET(30) plot for N1.
tion in the acceptor number (AN*) of solvents may be seen from the curvature of the plot in Figure 4(b). It may be noted that with increasing acidity of solvent media energy of fluorescence E(F) passes through a minimum, just opposite to that in the case of absorption and that the correlation was also poor. The difference is obviously due to different characteristics of the ground and excited states.
Multiple linear regression analysis has been done where correlation of E(A) or E(F) was sought with respect to the solvatochromic parameters representing dipolarity (p*), hydrogen bond donating (a, HBD) and hydrogen bond accepting (b, HBA) ability of solvents (following the Taft’s scale [35]: p*, a and b). This was done with the help of the expression (1)
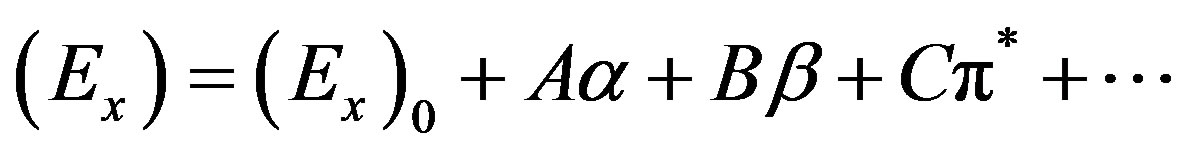 (1)
(1)
where (Ex)0 is the value of (Ex) in a hypothetical inert solvent, and A, B and C are the adjusted coefficients reflecting the dependence of Ex on the a, b and p* parameters. The following regression equations were obtained:
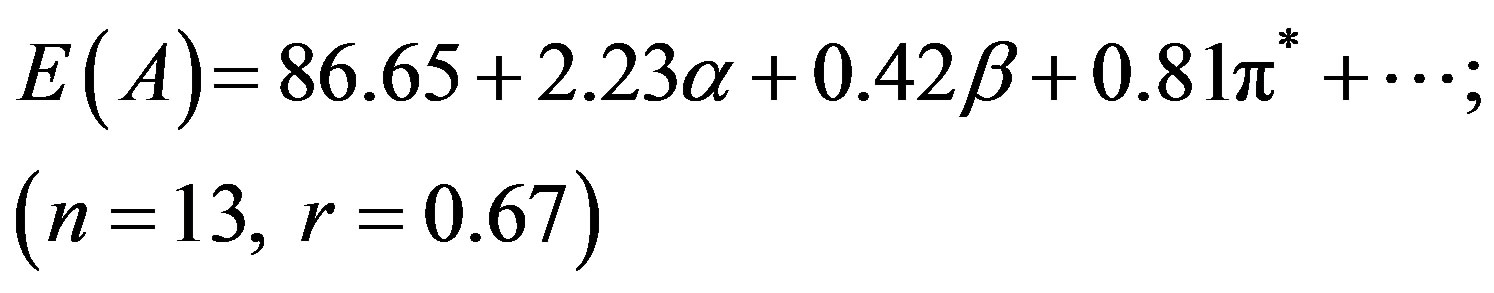 (2)
(2)
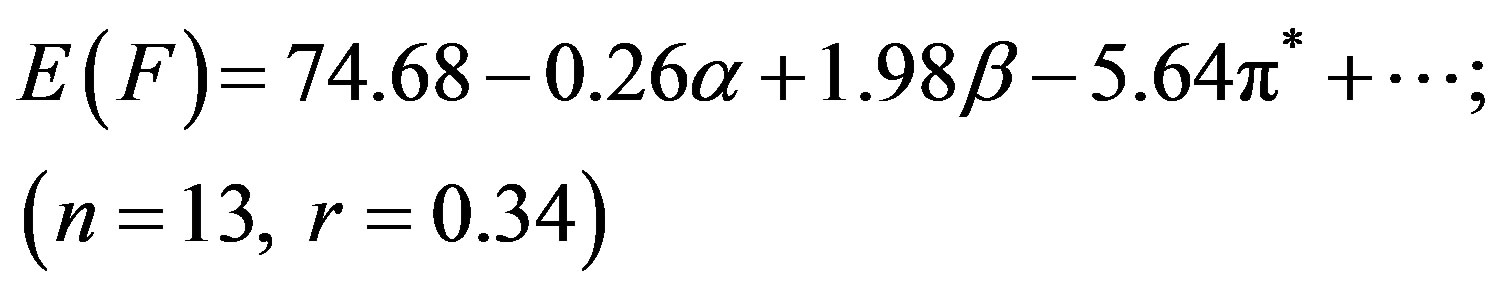 (3)
(3)
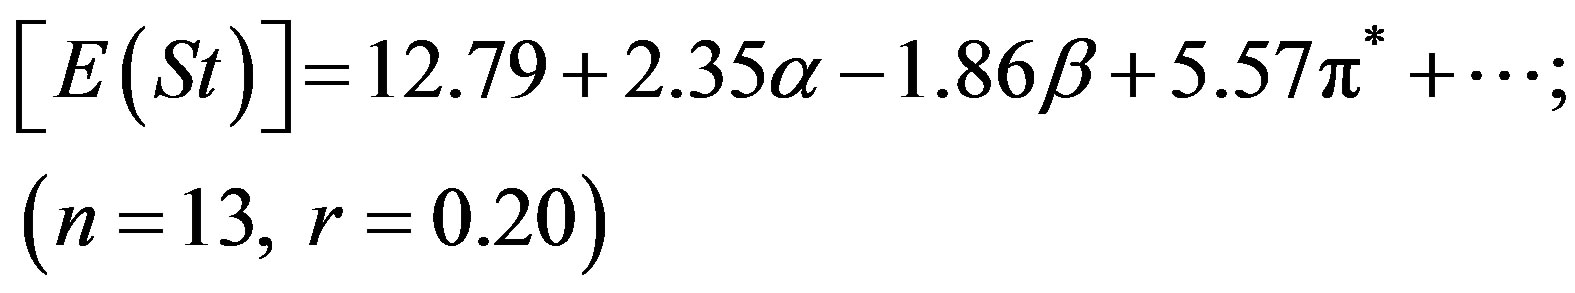 (4)
(4)
Although N1 showed better correlation (r) of absorption energy E(A) in terms of the Taft’s p*-, aand bparameters, the correlation coefficient (r = 0.34) was far from unity for E(F) due to the low solvatochromic shifts observed in the emission (Table 1), leading to a higher
 (a)
(a)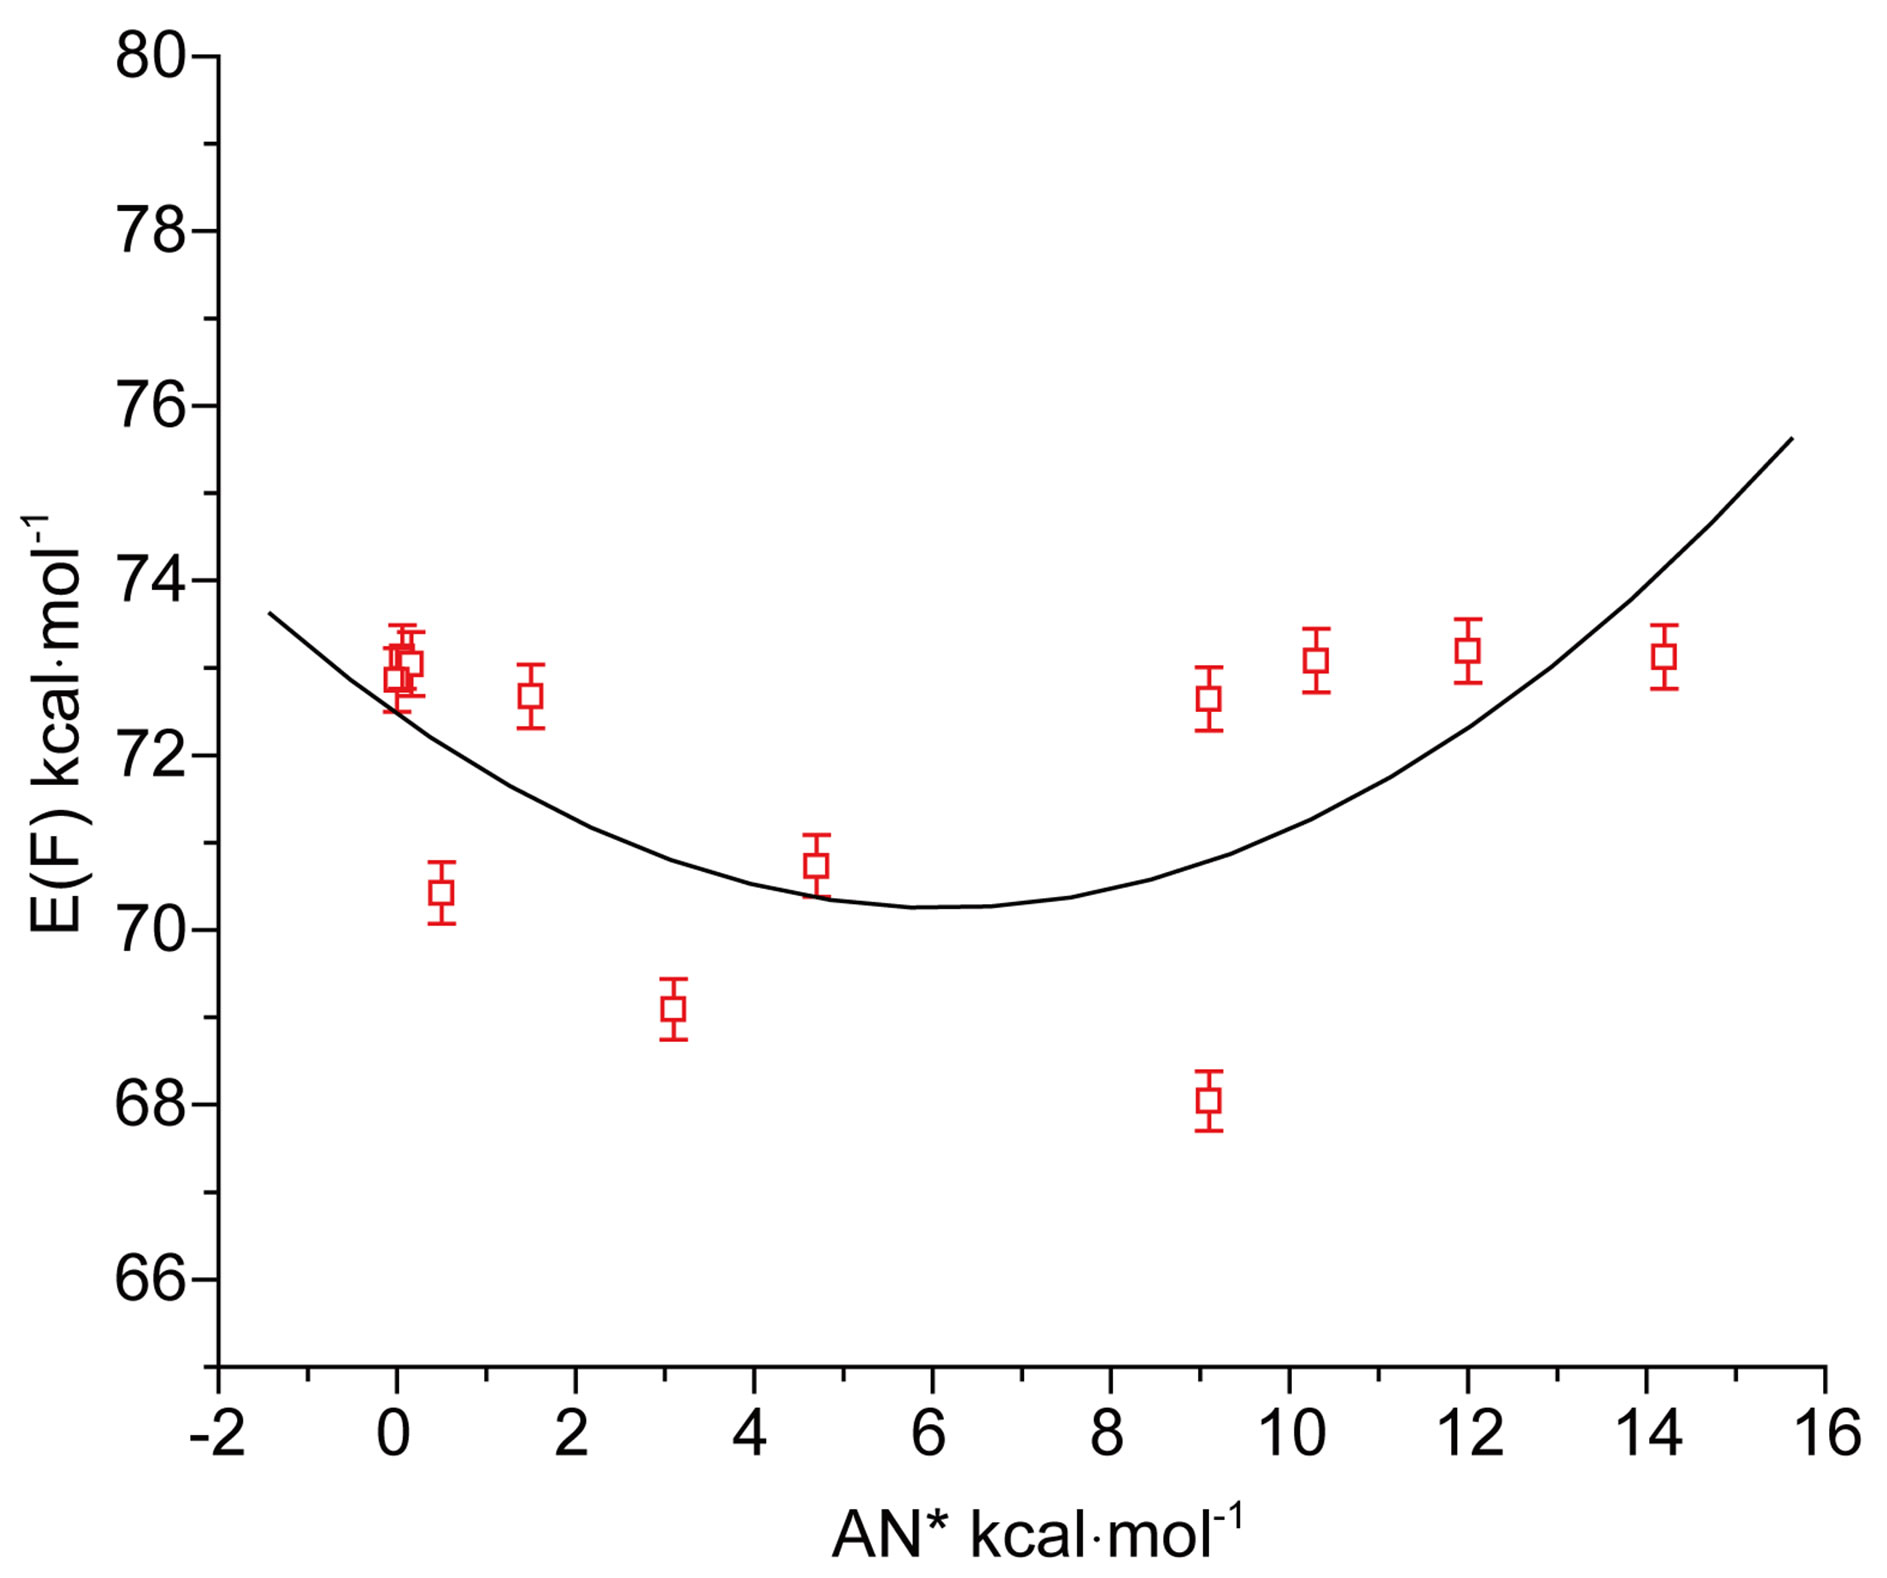 (b)
(b)
Figure 4. (a) Plot of E(A) of N1 against acceptor number (AN*) of solvents; (b) Plot of E(F) of N1 against acceptor number (AN*) of solvents.
dispersion of the experimental values. In our previous studies we have seen that pyromethene dyes [36] or saturated b-diketones [37] also showed similar features. The adjusted coefficient (A) describing the HBD ability of solvent was the major coefficient in equation (2) only. For the energies of absorption as well as the Stoke’s shift, the A coefficients had positive values, corroborating the observed hypsochromic shift with respect to increasing solvent acidity, while for emission, the shift was bathochromic in nature and the coefficient (A) had negative sign. The opposite effect was observed as the basicity of solvent was increased. The coefficient (C) reflecting the dipolarity/polarizability of solvent, assumed positive value in absorption and negative in the case of emission, suggesting that the absorption bands shift slightly towards higher energies while the emission bands towards lower energies as the polarity of the solvent was increased. The basicity of solvent (b-scale) and dipolarity (p*-scale) do not evidently affect the absorption while acidity or basicity (a and b-scale) do not much affect the fluorescence minimum since the corresponding adjusted coefficients (B and C in equation (2), A and B in equation (3) and B in equation (4)) were within their standard deviations.
It appear that solvation is mainly controlled here through hydrogen bond donation (a) and dipolar interaction (p*) with the solvent. The ratio of the regression coefficients of a and p* indicates the relative importance of HBD over dipolarity interaction in the ground state. The ratio is ca. 2.75 in respect of E(A), whereas the trend is just reciprocal for E(F), implying that HBD plays a significantly greater role in the absorption while dipolarity does in emission.
3.2. Appearance of CT Bands
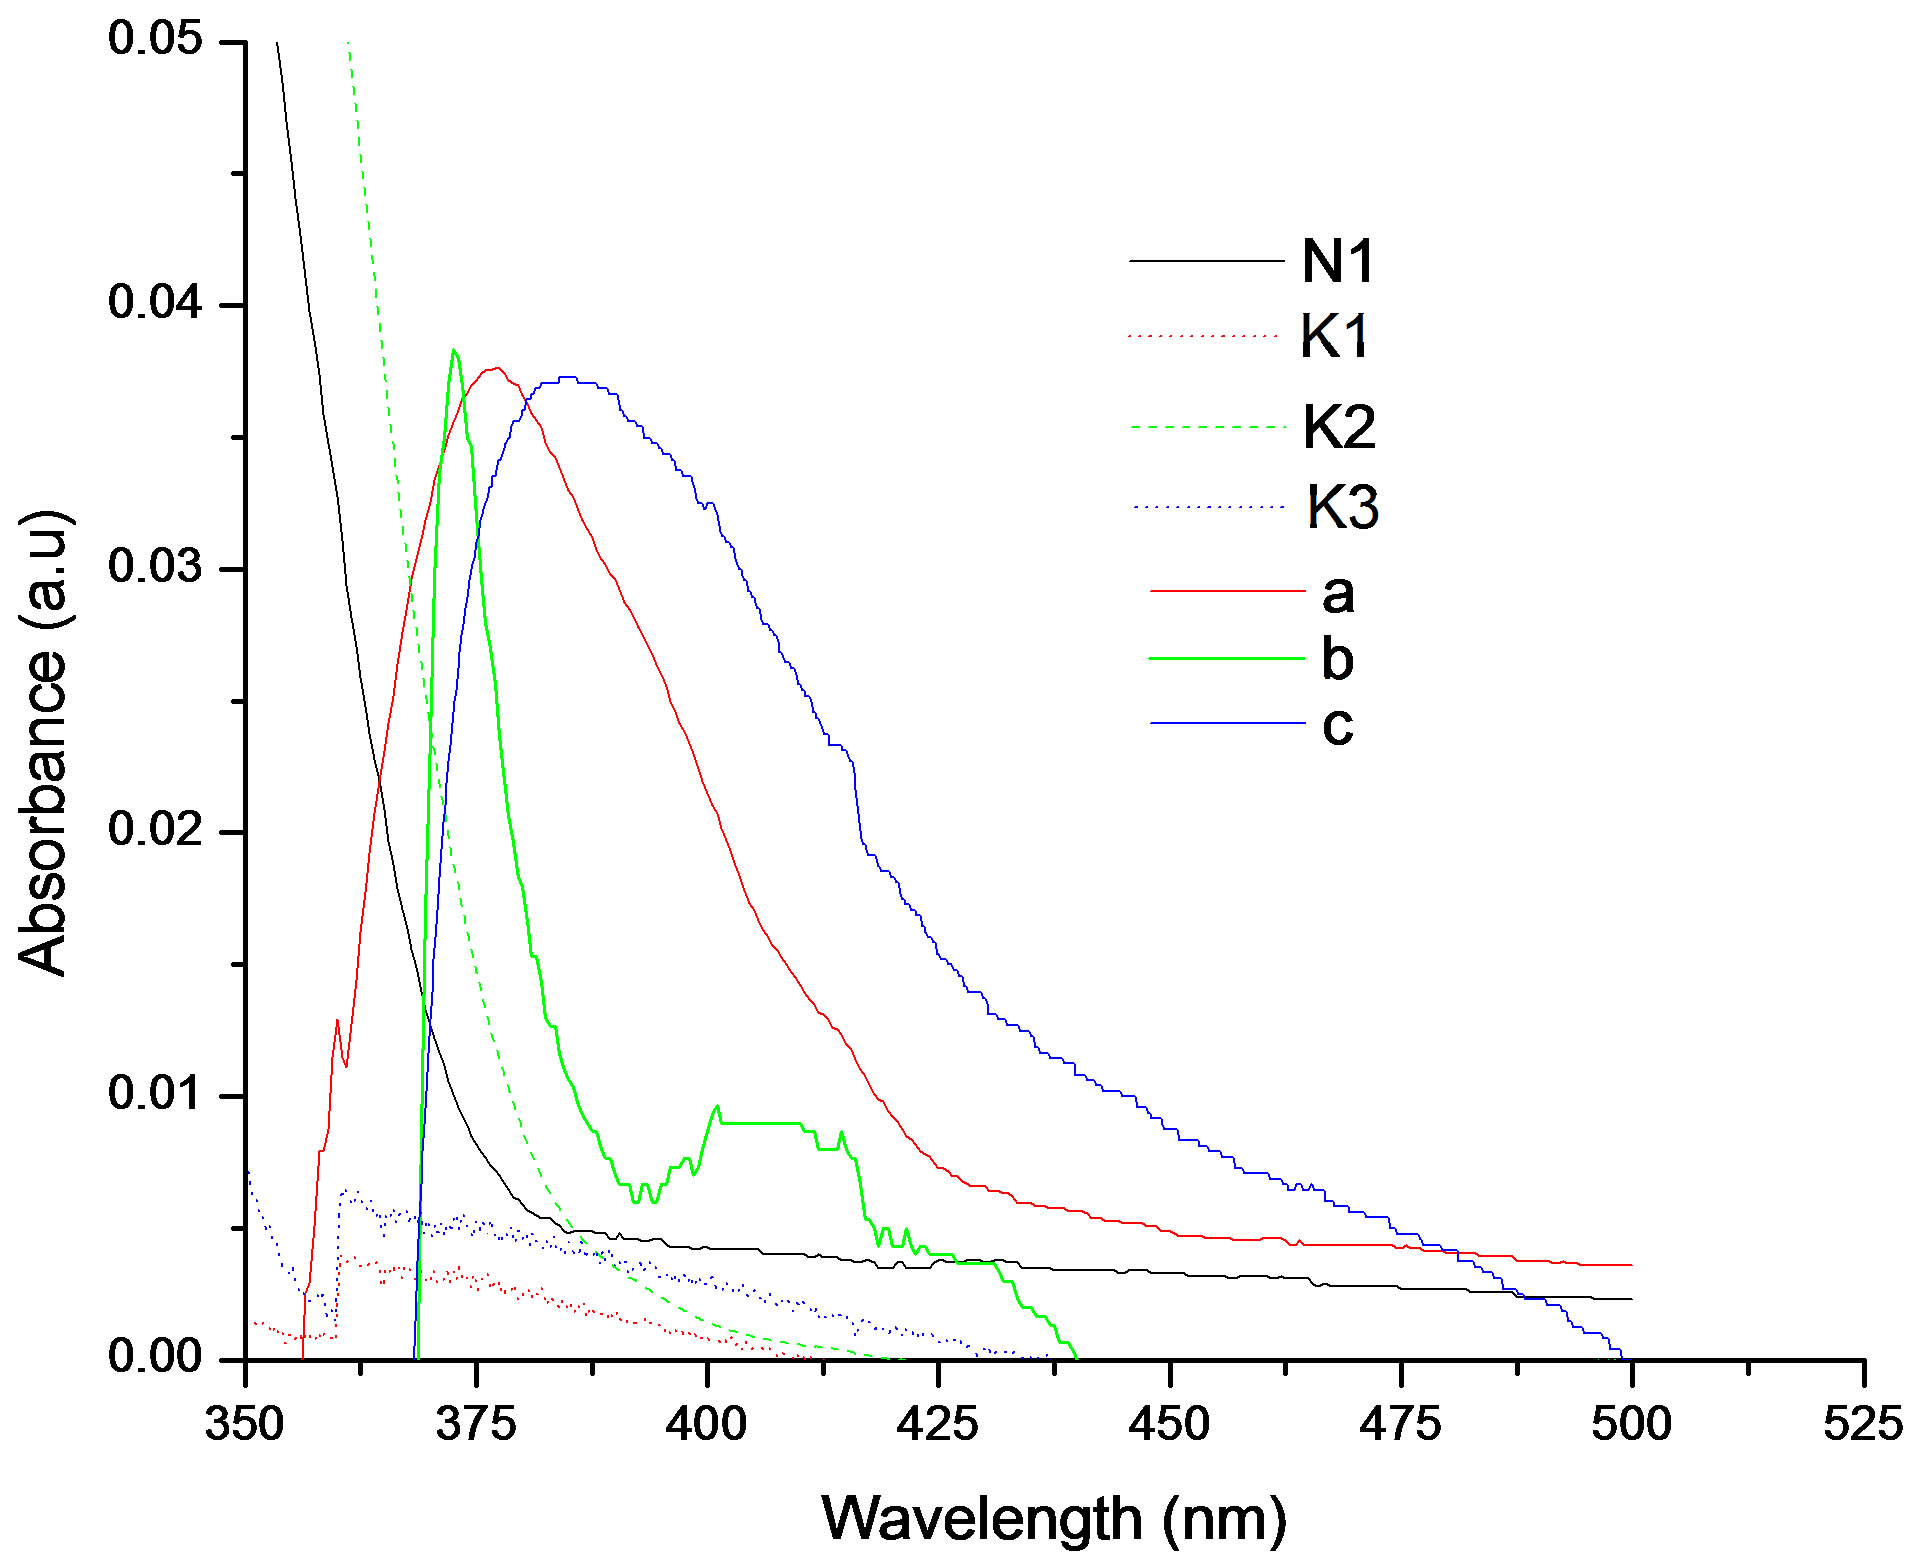
It was observed that absorption band maximum of N1 in the nonpolar toluene solvent shifted towards red as some dipolarophile compound was added to the solution. Figure 5(A) shows the electronic absorption spectra of mixtures containing (N1 and K) in toluene and the shifted band is attributed to CT owing to its characteristic nature. In order to obtain these CT bands, spectra of above solutions were recorded against the pristine nitrone (N1) solution in the respective solvent media as reference to cancel out its own absorbance. It was observed that the new absorption peaks appeared in the visible region. Figure 5(B) shows the complete absorption spectra of N1 in the absence and in the presence of increasing concentrations of the ketone K3. The CT absorption peaks were well characterized by fitting to the gaussian function
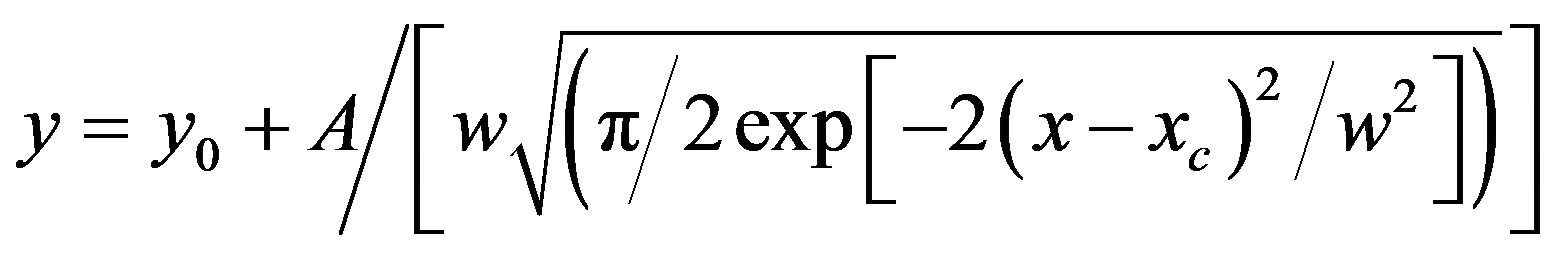
where x and y denote wavenumber and molar extinction coefficient respectively. When such a Gaussian fit (approximated by the above approximation) is applied over a wide range of (x, y) data points, y0 obviously represents the lowest bound of the y-data values in the observation range and the remaining term in the expression represents a positive definite quantity. At the value x = xc, the derivative dy/dx disappears giving
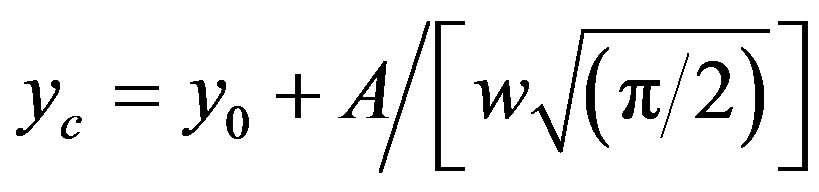 which provides a numerical significance of the band centre concerning the plot. However, as x ® ¥, y ® y0 which implies a significance to the hypothetical absorbance value in the limit of infinite wavelength. One such fitted plot has been shown in Figure 6. The results of the Gaussian fit for all the three N1/K systems were presented in Table 2. The wave-
 (A)
(A) 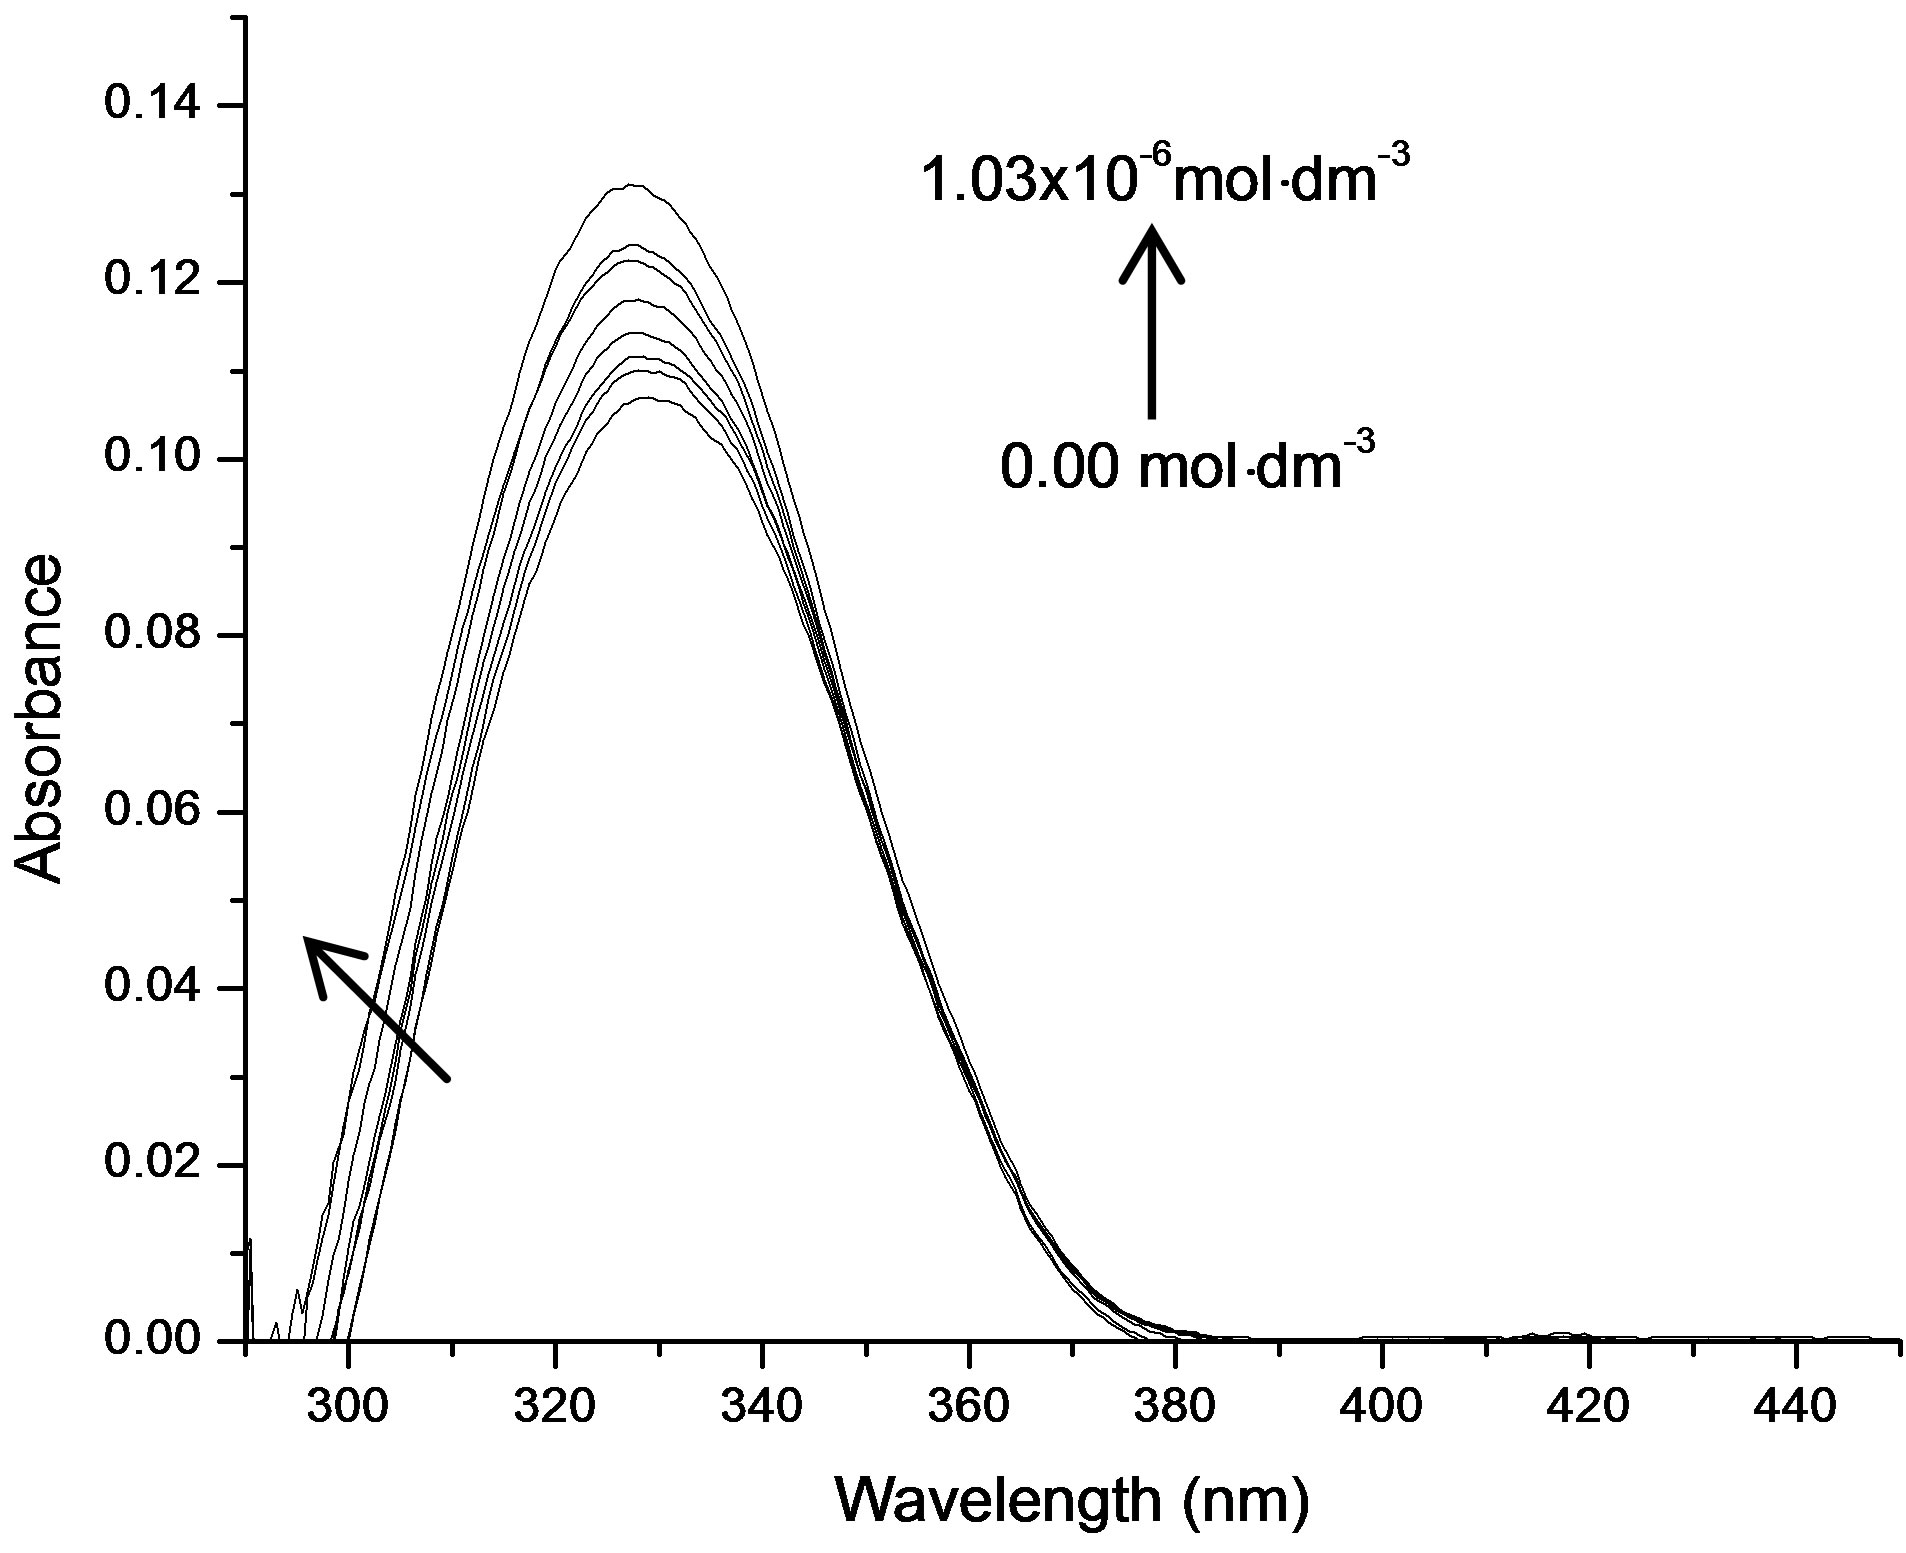 (B)
(B)
Figure 5. (A) Charge transfer absorption bands for all the three interacting systems: Band (a) was of N1/K1, (b) was of N1/K2 and (c) was of N1/K3 interacting systems in toluene medium; (B) The absorption spectra of N1 (5.18 × 10⁻⁶ mol·dm−3) in the absence and in the presence of increasing concentrations of the ketone K3.
lengths at these new absorption maxima (lmax = xc) and the corresponding transition energies (hn) were summarized in Table 3. The gaussian analysis of fitting was done in accordance to the method developed by I. R. Gould et al. [38]. One important point to mention here is that the gaussian analysis of a curve generally provided a meaningful result near the maximum of the curve spread over a very small region.
3.3. Determination of Oscillator Strength (f), Transition Dipole ((EN), Resonance Energy (RN)
From the CT absorption spectra, we could estimate os-
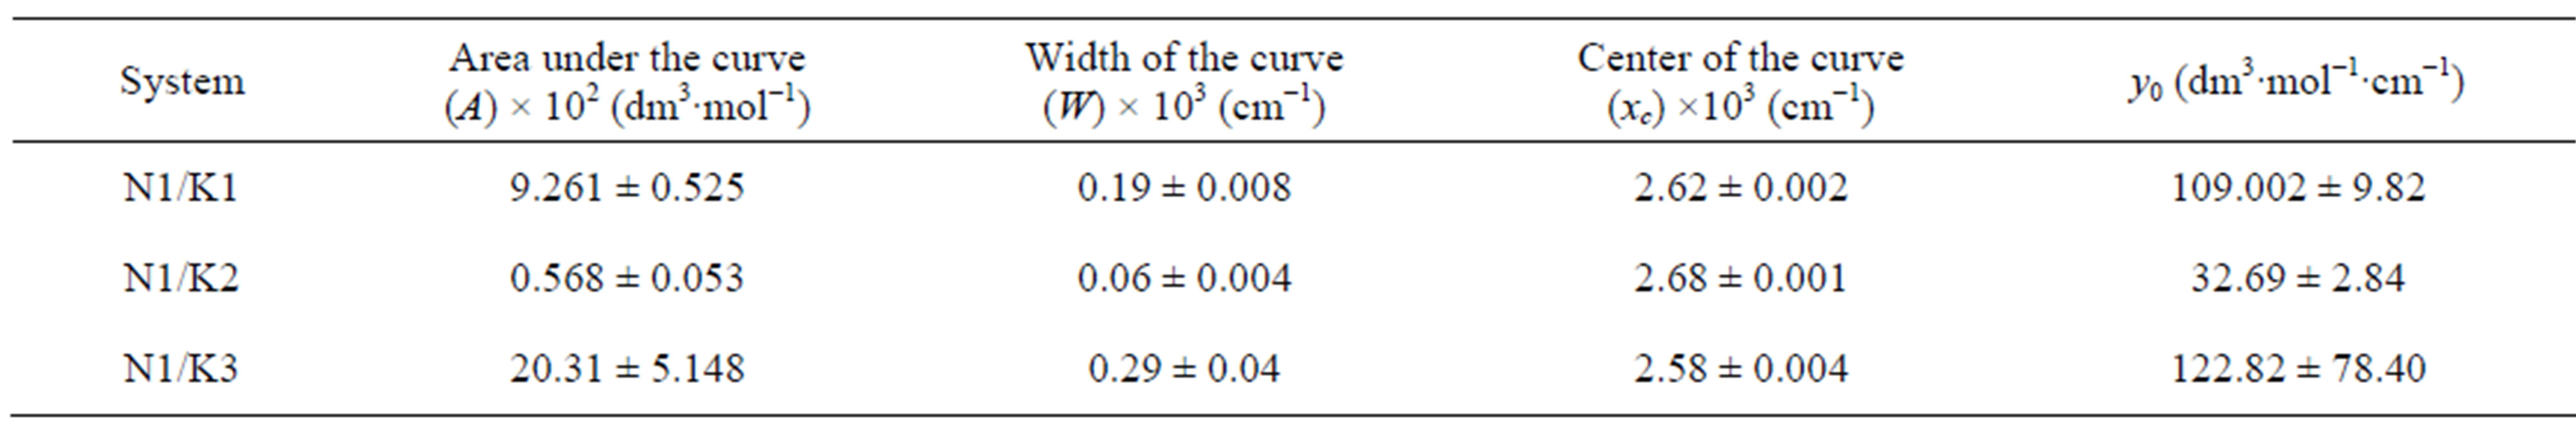
Table 2. Gaussian curves analysis for the CT spectra of all the three complexes of N1.
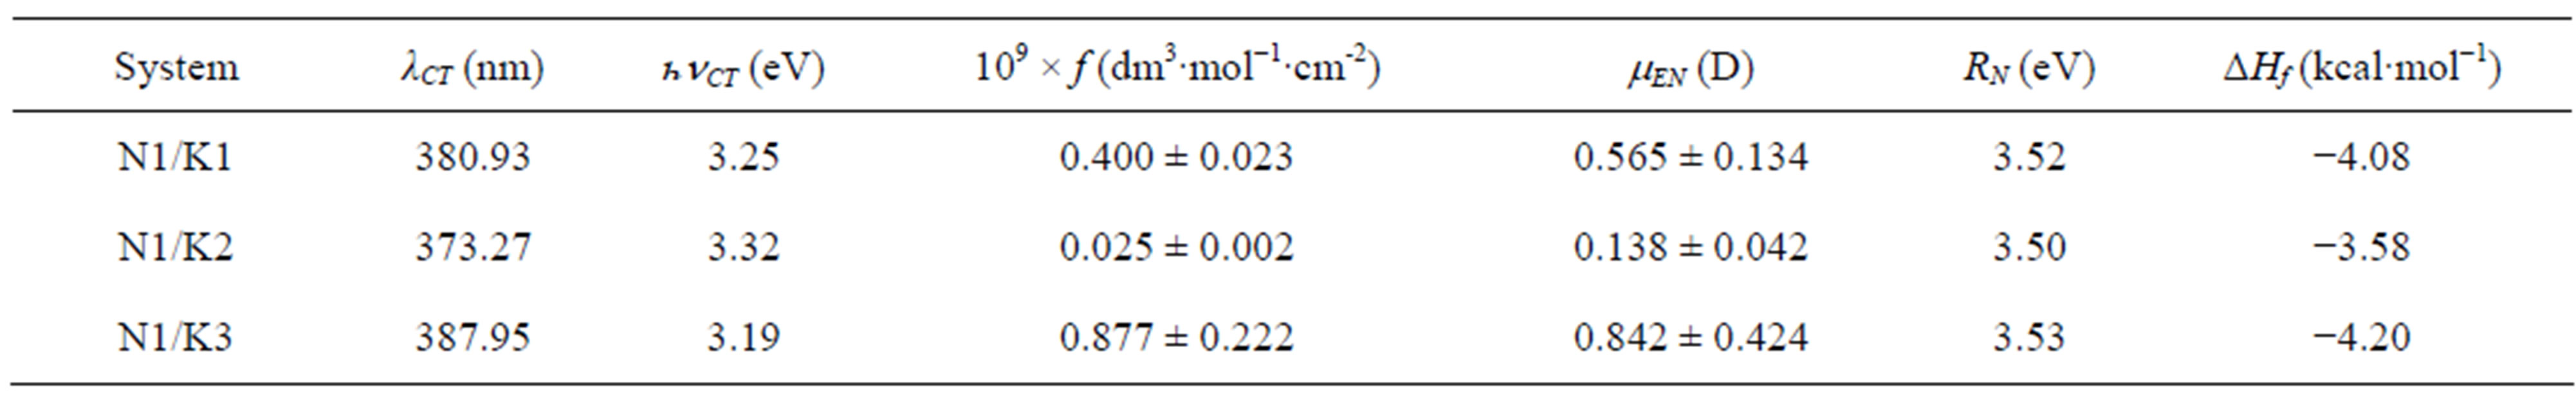
Table 3. CT absorption maxima and transition energies of the complexes, oscillator strengths (f), transition dipole strengths (mEN), resonance energies (RN) and theoretically calculated heat of formation of the three complexes of N1.
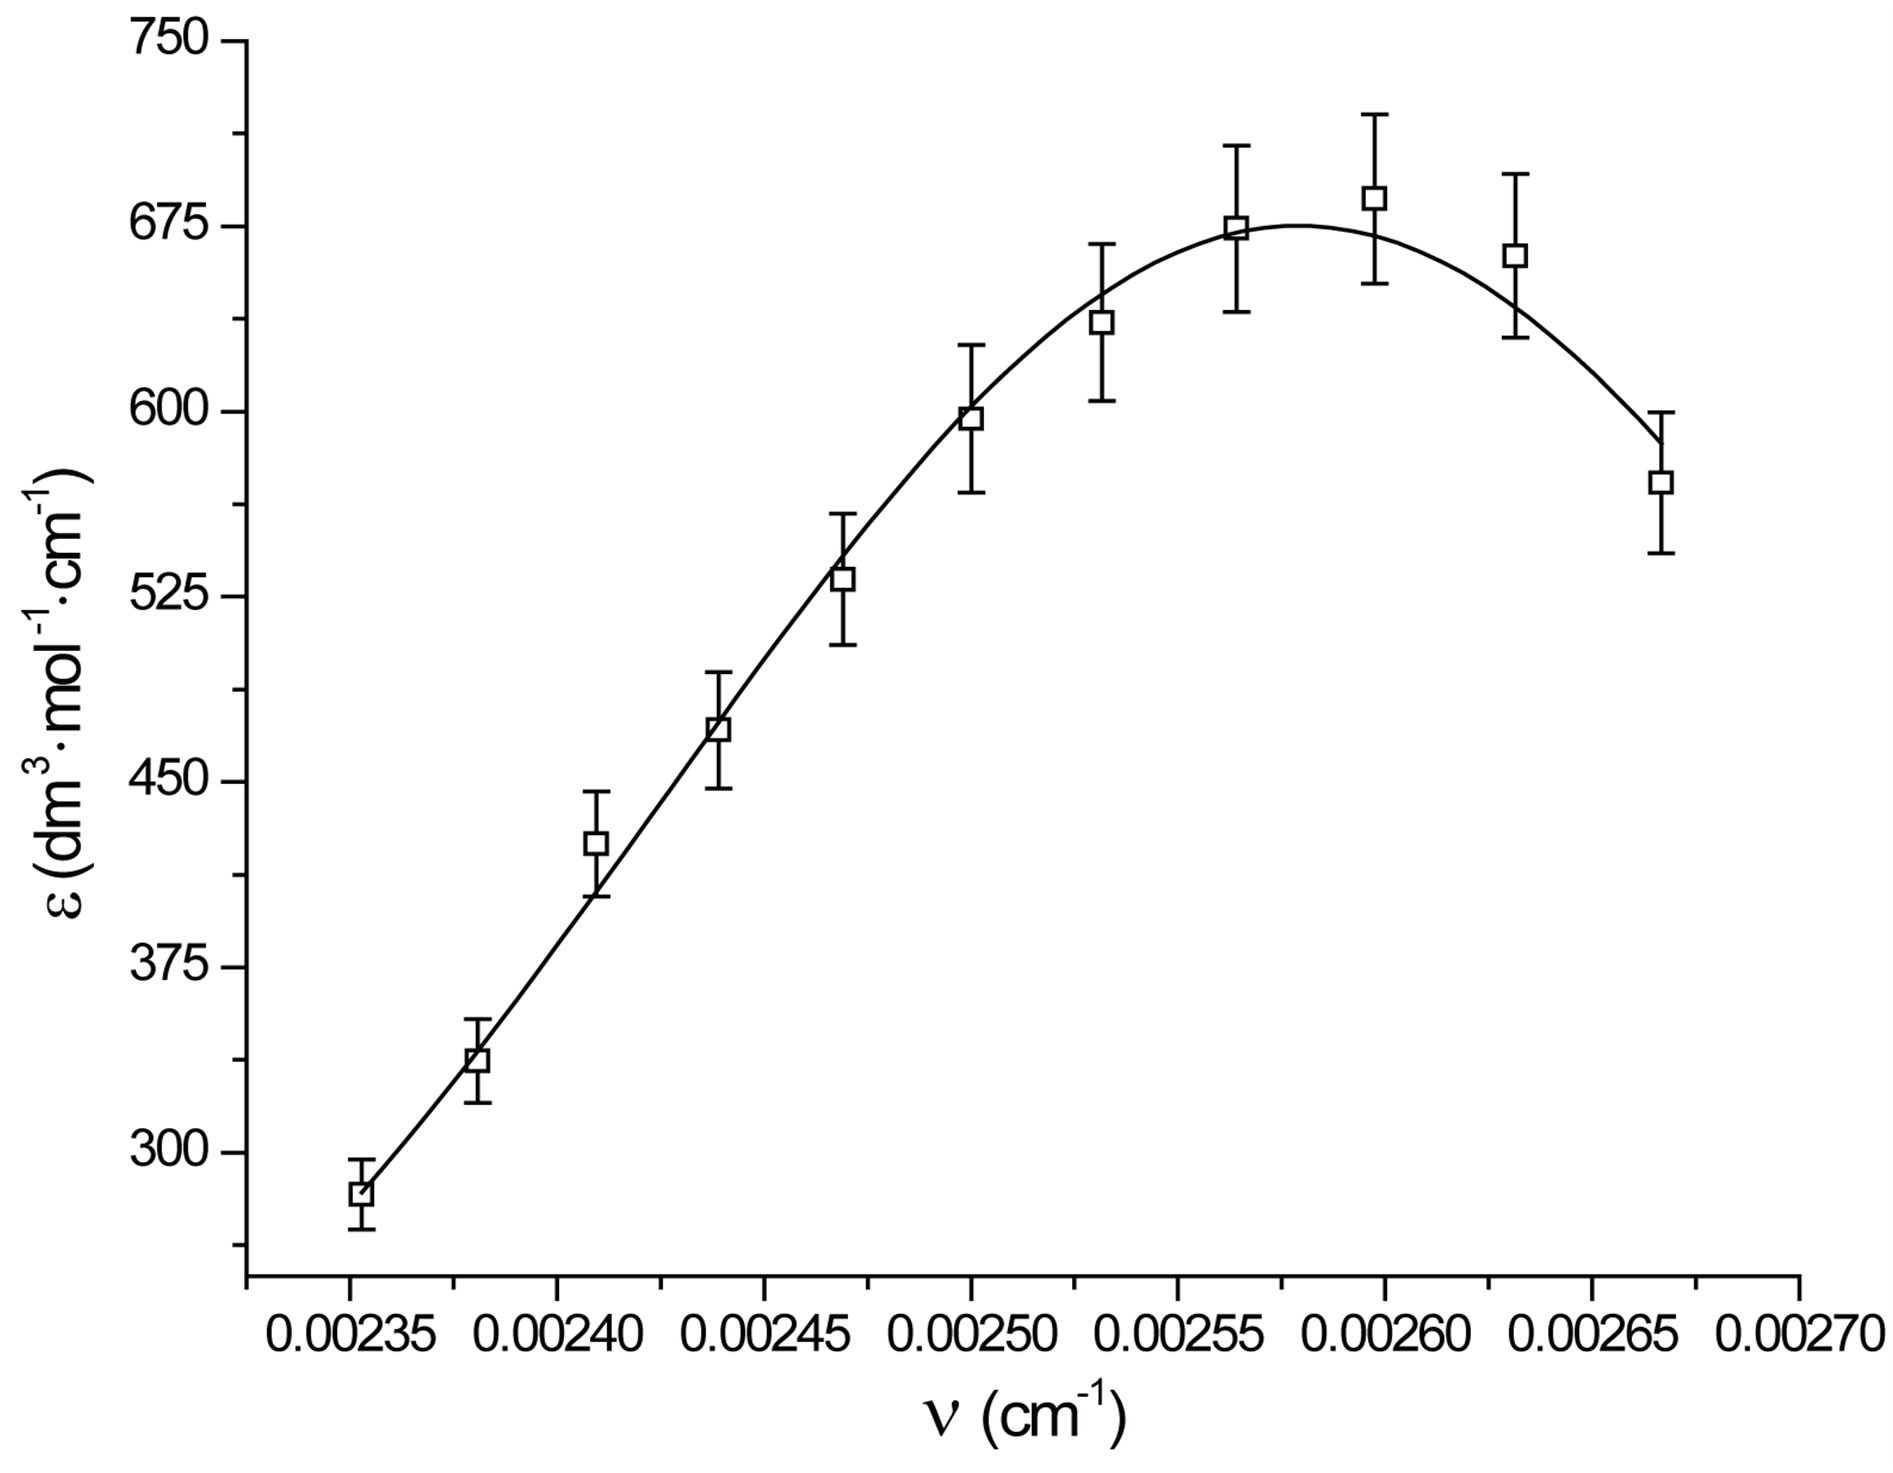
Figure 6. Gaussian analysis of CT spectra of N1/K3 system in toluene.
cillator strength [37] (f) for the transition. The oscillator strength is proportional to the square of transition dipole |µEN|. The observed oscillator strengths of the CT bands are summarized in Table 3.
It has been observed that transition dipole strength (µEN) for the N1/K3 complex was slightly higher than those for the other N1/K complexes.
Again, the resonance energy of the complex in the ground state (RN) [39] is a contributing factor (a ground state property) to the stability of the complex. The values of RN for the complexes under study have been provided in Table 3. It appears from the trend in RN values that N1 forms stronger complexes with K1 and K3 as compared to the N1/K2 complex in the non-polar toluene solvent.
3.4. Determination of Formation Constants (K)
The formation constants of the N1/K complexes were determined using the Benesi-Hildebrand (BH) [25] equation in the form
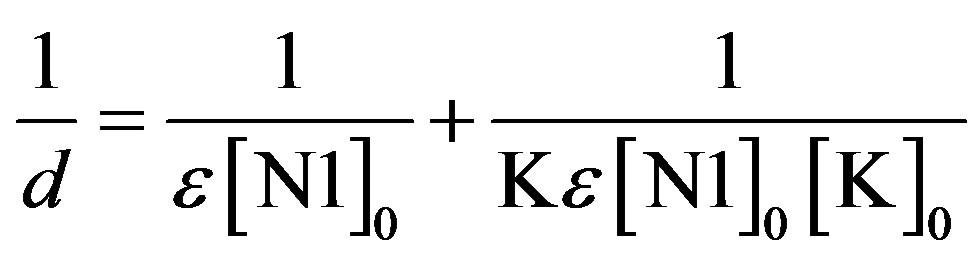 . (5)
. (5)
Here [N1]0 and [K]0 are the initial concentrations of the nitrone and dipolarophile respectively, d is the absorbance of the donor–acceptor complex at lCT measured against solvent as reference. Here d =  where dmix,
  and
and  are the absorbances of the donor-acceptor mixture, pure N1 and K solutions respectively at the same molar concentrations as are present in the mixture and at the same wavelength against the solvent as reference. The molar extinction coefficient e is not quite that of the complex. Equation is valid [25] under the approximation [N1]0
  [K]0 for 1:1 donor-acceptor complexes. The intensity or the corrected absorbance (d) in the visible portion of the absorption band, increases systematically with gradual addition of the dipolarophile solution as shown in Table 4. Thus, it is established in this work that the substantial red shift in the broad 300 - 400 nm absorption band of N1 is due to formation of 1:1 molecular complex between K and N1. The equilibrium constant values were calculated using the Benesi-Hildebrand (BH) model. In all the cases very good linearity were obtained. One such plot has been shown in Figure 7.
The following linear regression equations have been obtained from the procured data in toluene at 303 K. For N1/K1 system:
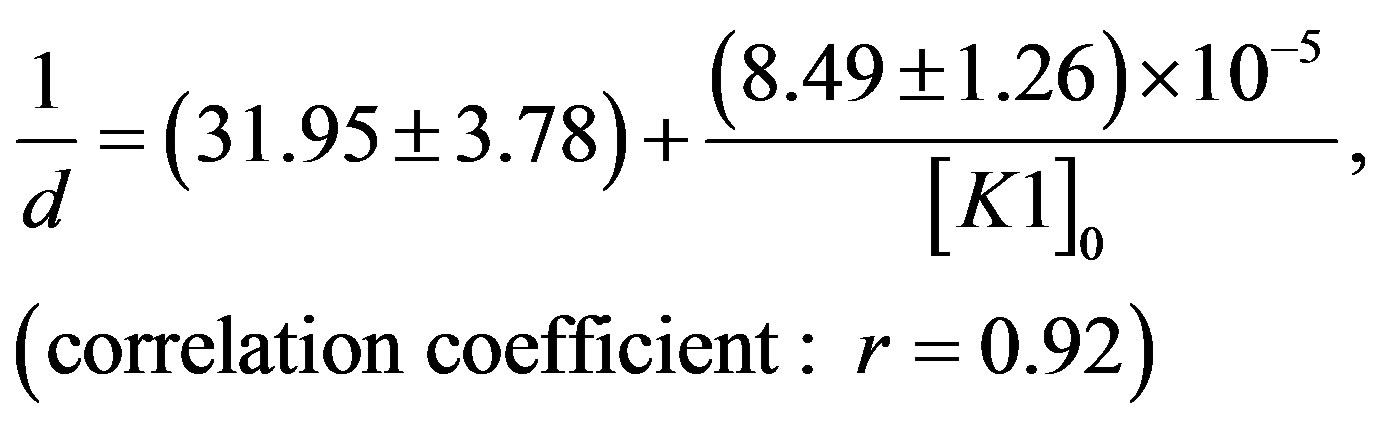 (6)
(6)
It was observed that N1 binds most strongly with K3 ([K3] = 5.31 × 10⁵ dm3×mol−1) than with K1 ([K1] = 3.76
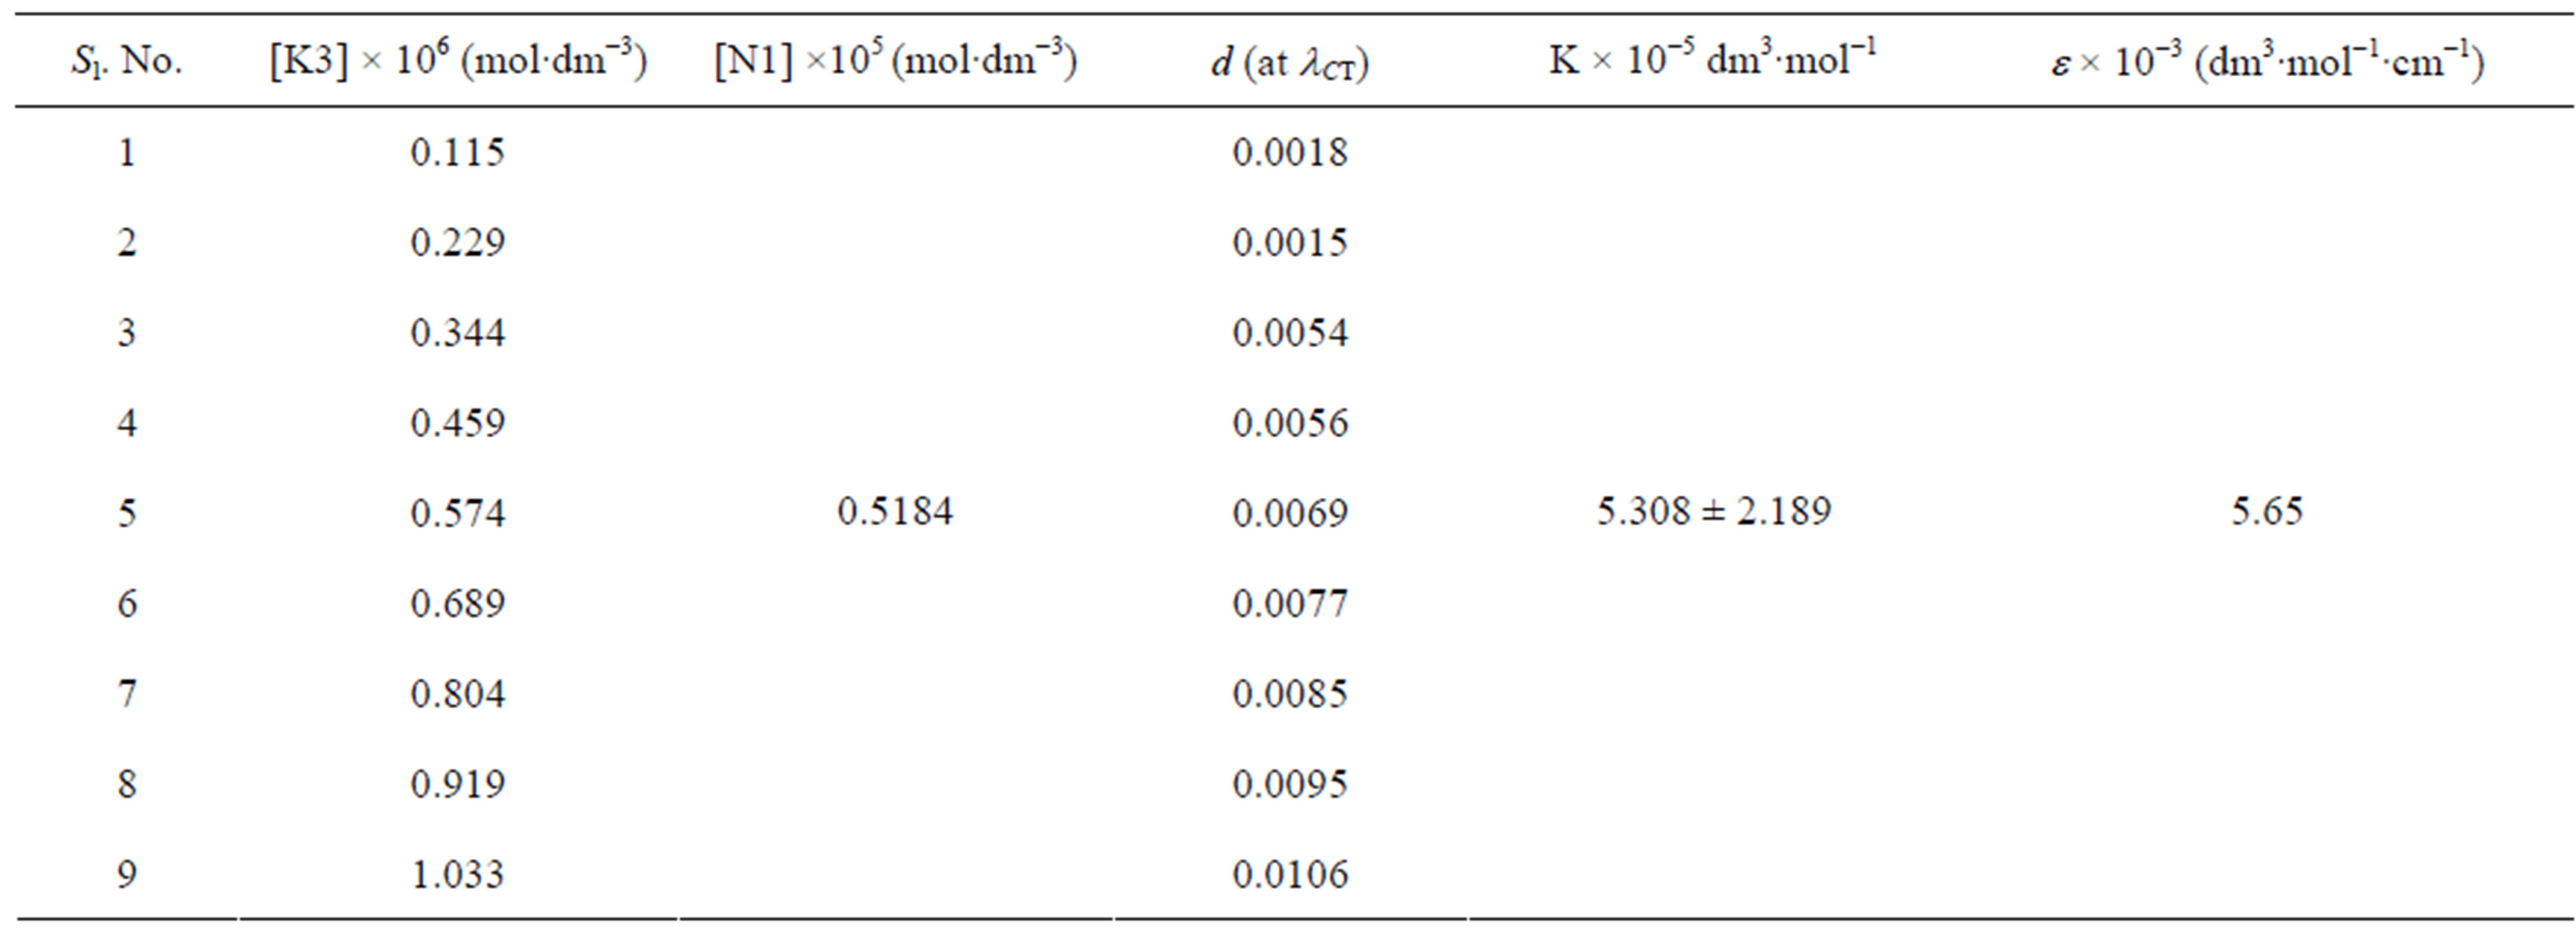
Table 4. Data for spectroscopic determination of stoichiometry, formation constant (K) and molar absorptivity (ε) for the N1/K3 complex in toluene at temperature 298 K.
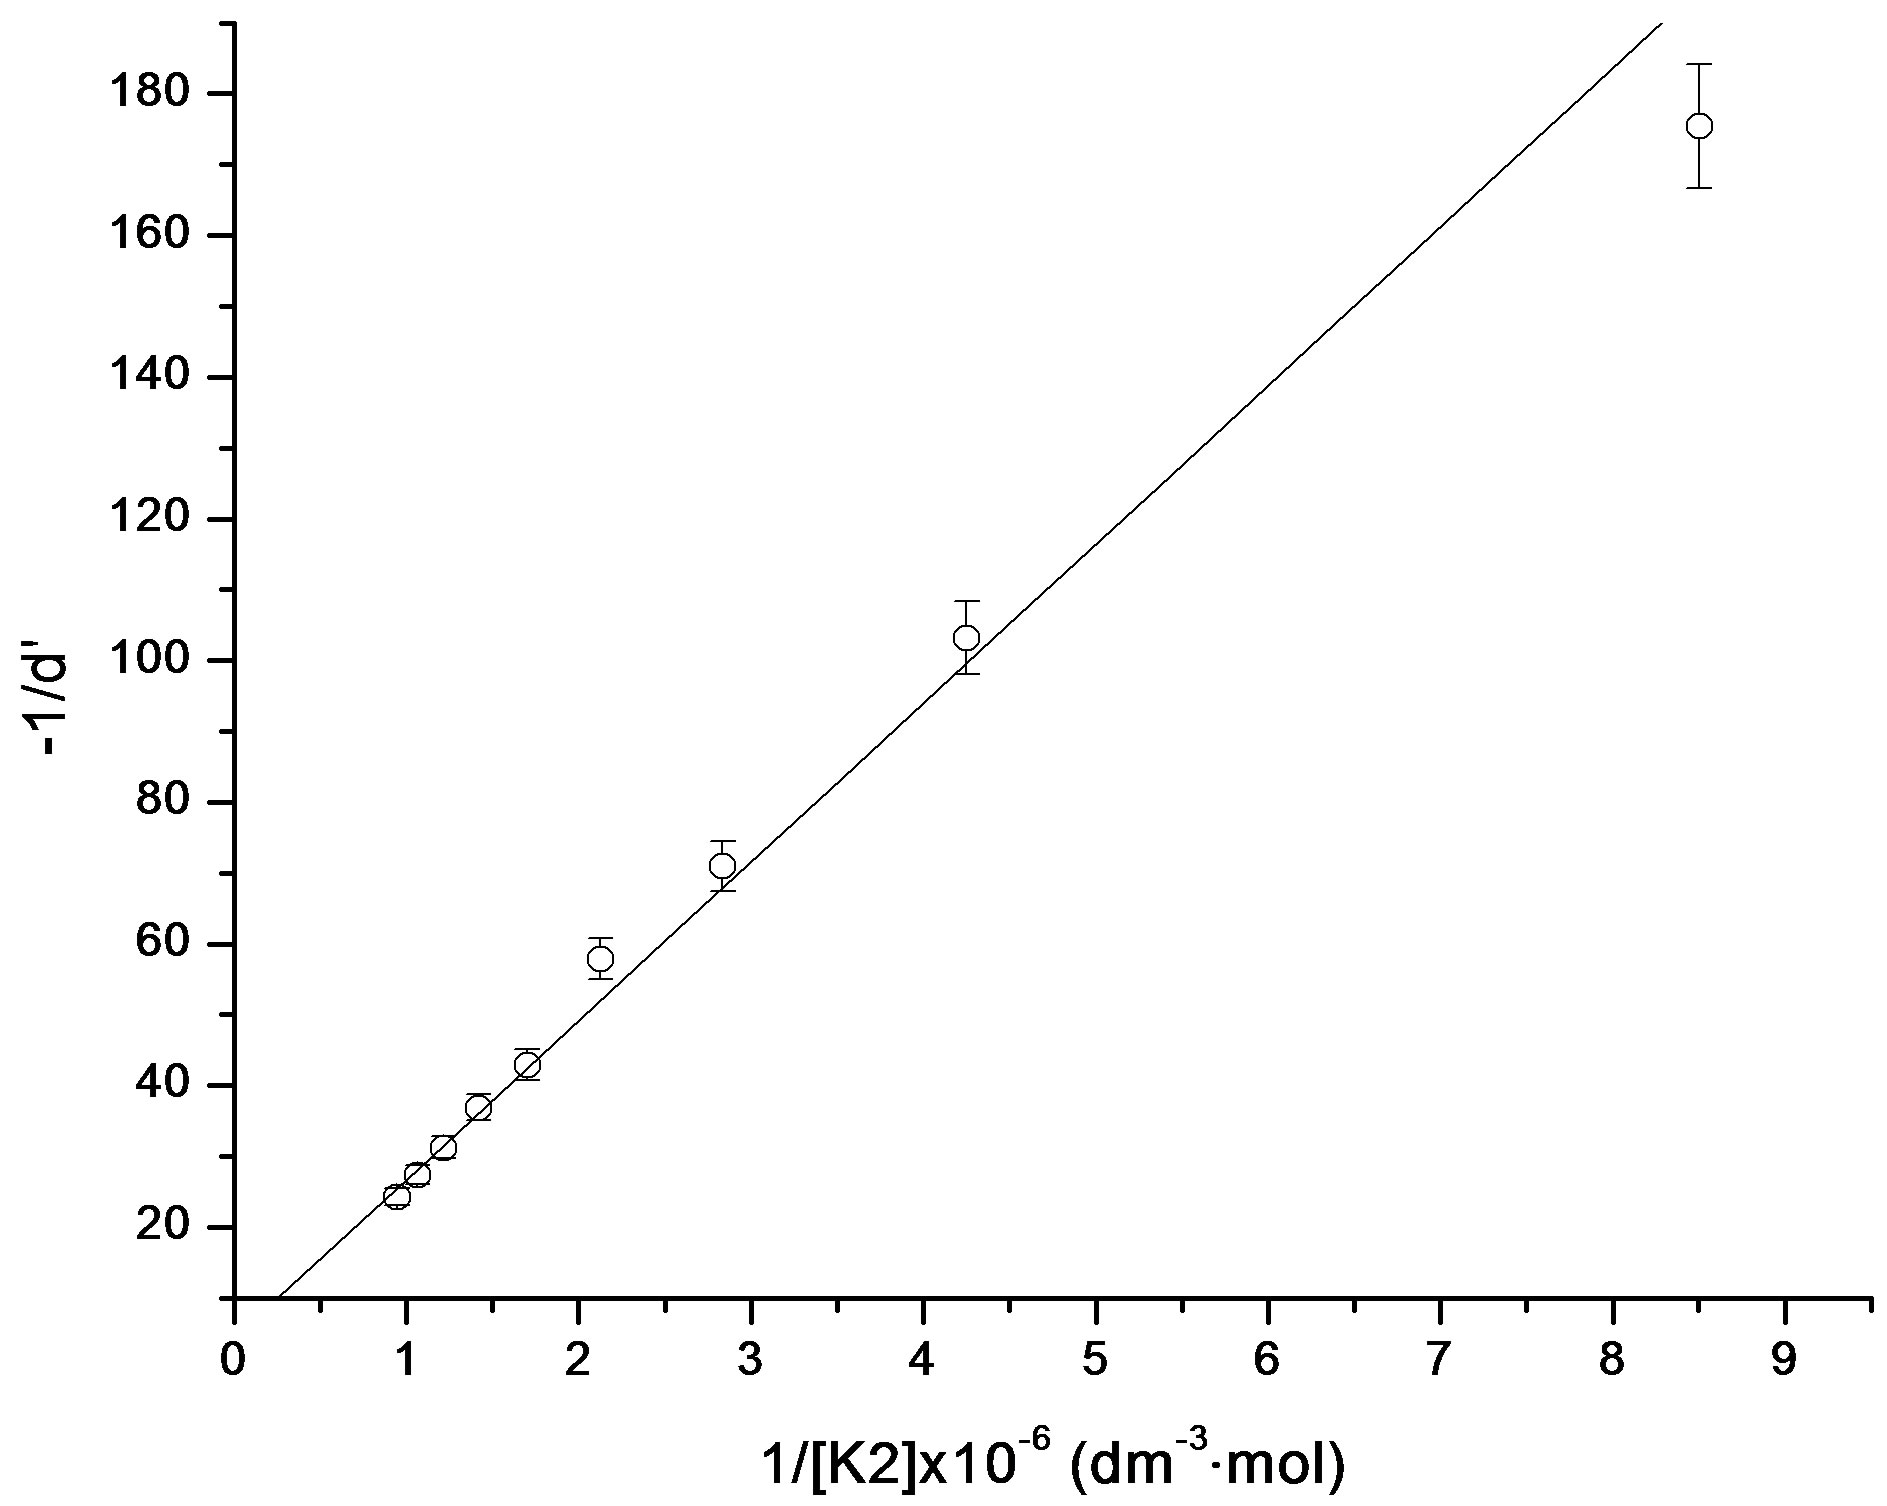
Figure 7. Benesi-Hildebrand plot for N1/K2 system.
× 105 dm3×mol−1) or with K2 ([K2] = 1.89 × 10⁵ dm3×mol−1) in toluene medium. The trend in the formation constants for three complexes follows the order K3 > K1 > K2. The trend in transition dipole (mEN) strengths and resonance energies (RN) as well as theoretically calculated heat of formation values for the three complexes were also in the similar order (Table 3).
3.5. Computed Philicity Indices
The global electrophilicity index [28,29] w measures the stabilization in energy when the molecular system acquires an additional electronic charge DN from the environment. It can be simply expressed in terms of electronic chemical potential (m) and chemical hardness (h). These have been represented [24] by a very simple operational formulation in terms of the one-electron orbital energies of FMO, viz. the HOMO and LUMO given as:
 (7)
(7)
where
 (8)
(8)
and
 (9)
(9)
The global electrophilicity index includes the propensity of the electrophile to acquire an additional electronic charge as well as its resistance to exchange the electronic charge with the environment simultaneously. Thus, a good electrophile can be characterized by a high value of w and a low value of h.
Again the recently introduced [23,30] global nucleophilicity index (N), has been based on the relationship N = −IP, where IP is the gas phase (intrinsic) ionization potential which can be directly extended to describe the local nucleophilicity. Within the simplest approximation to the nucleophilicity, the IP values can be approximated in terms of the HOMO energy in a molecule within a given molecular orbital (MO) scheme. The nucleophilicity index N for a given system, was therefore defined [23,40] as N = εHOMO(Nu) – εHOMO(TCE) (in eV units) where εHOMO(Nu) is the HOMO energy of the nucleophile and εHOMO(TCE) corresponds to the HOMO energy of the tetracyanoethylene (TCE) taken as reference.
In Table 5 we have presented the HOMO and LUMO energies of N1, K1, K2 and K3 along with their electronic chemical potential (m), chemical hardness (h), global electrophilicity (w) and the nucleophilicity index (N). The electronic chemical potential of N1 (−3.81 eV) is higher than that of all K’s (−4.20, −3.82 and −4.19 eV) implying that the CT will take place from the nitrone (N1) to the ketone (K) in all the three cases with predominant HOMON1 - LUMOK interaction for the N1/K3 system presented in Table 5 and Figure 8. According to the absolute scale of electrophilicity [41] based on the w index, N1 and K1 - K3 all belong to the realm of strong electro-
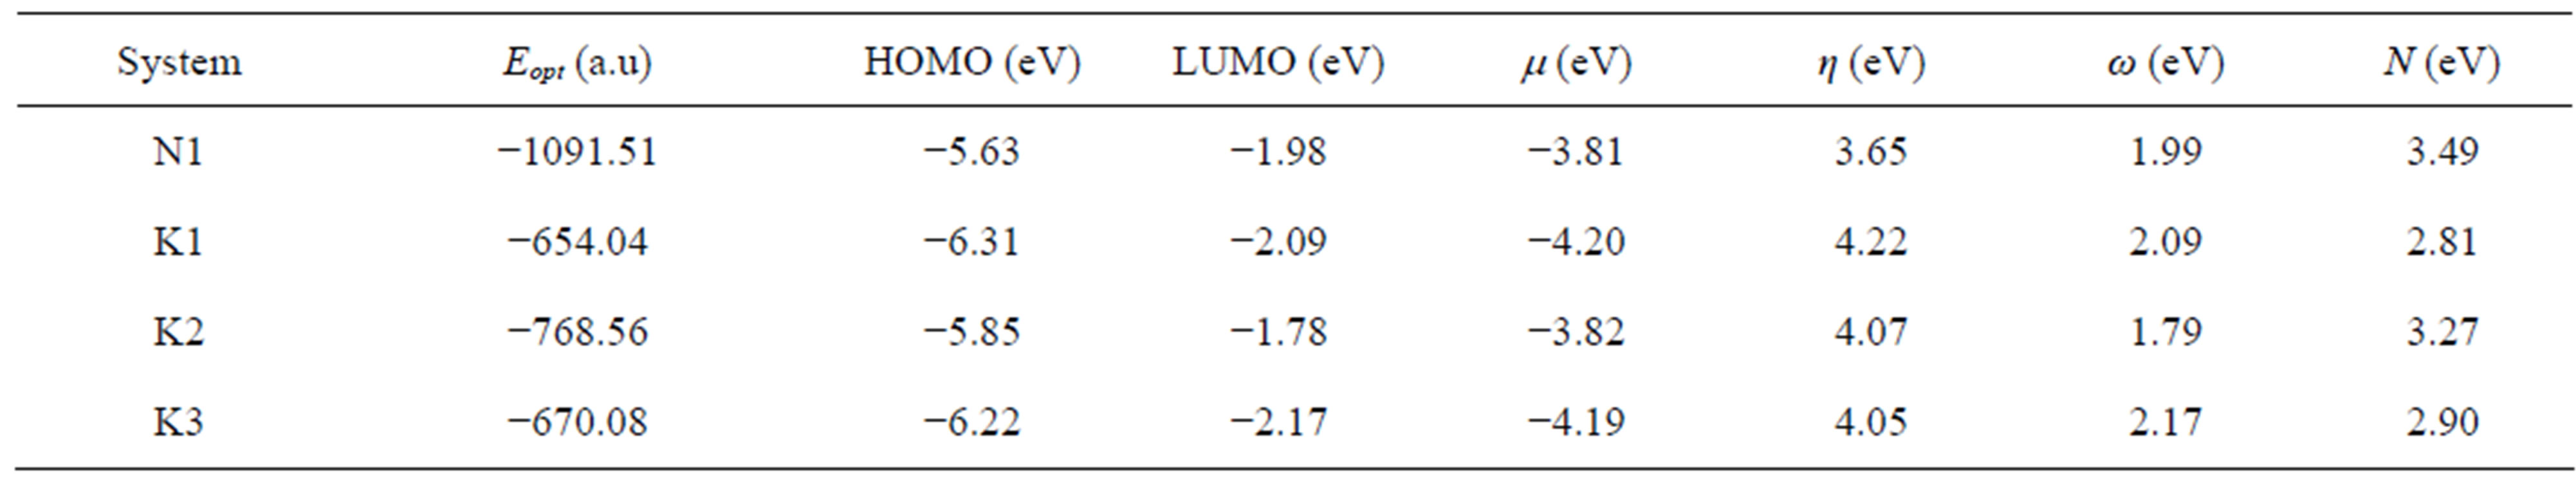
Table 5. HOMO and LUMO energies, and the global reactivity indices for nitrone (N1) and three ketones (K1 - K3).
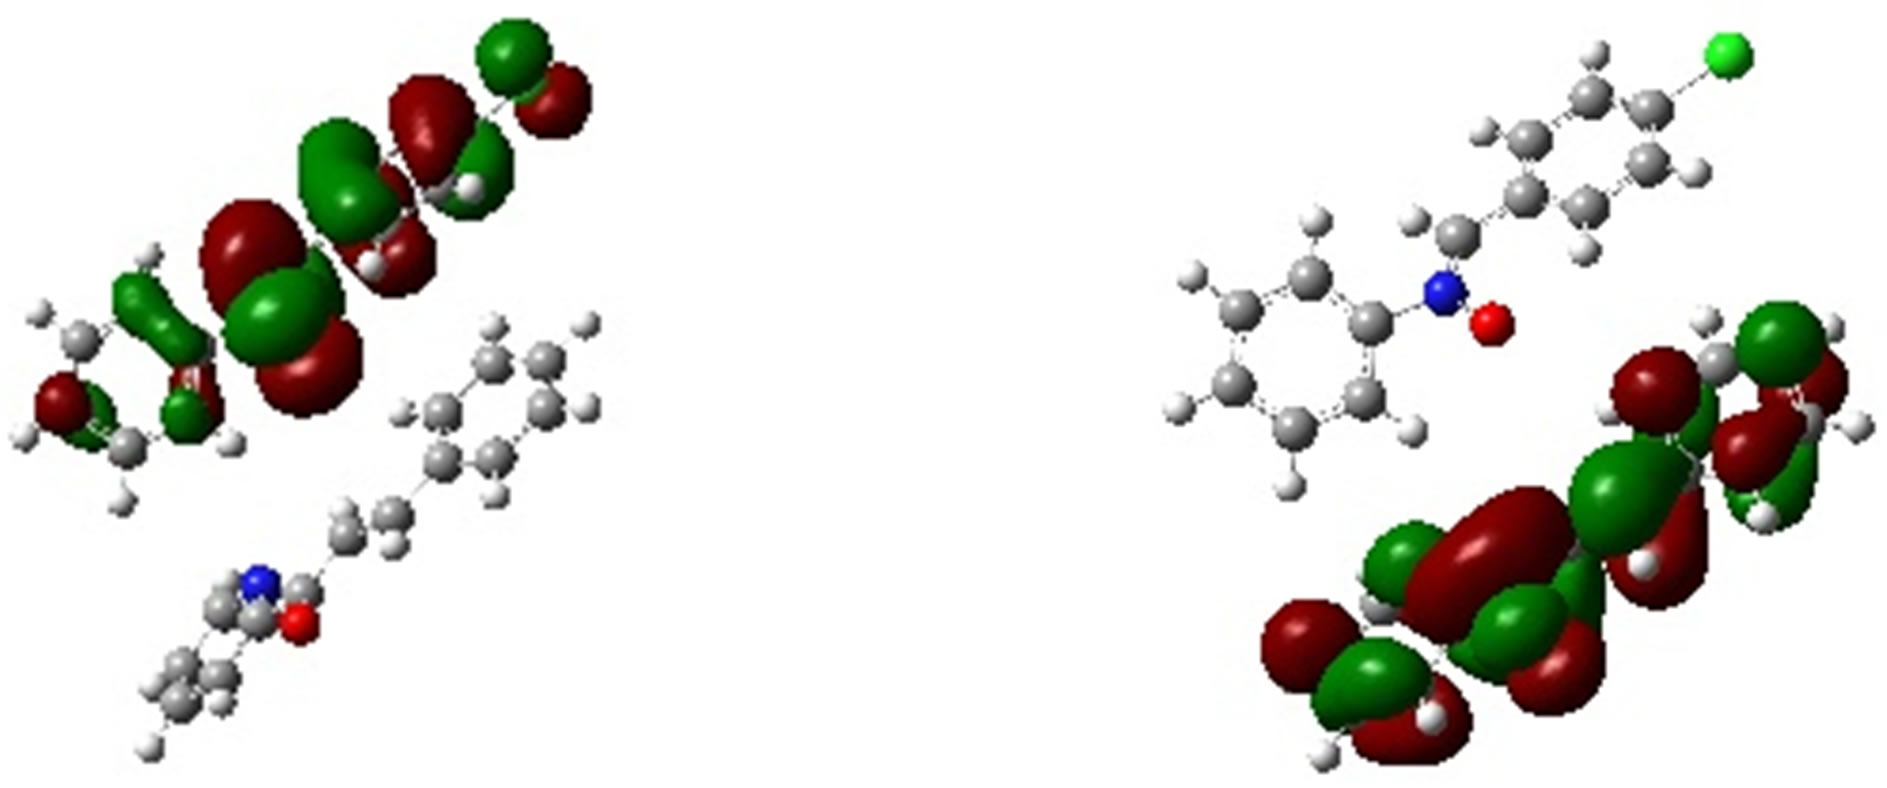 HOMO LUMO
Figure 8. Frontier molecular orbital picture of N1/K3 interacting system.
philes (values greater than 1.50 eV). Both K1 and K3 show greater values of w than N1. These un-saturated ketones follow the electrophilicity order K3 > K1 > K2. Examining their nucleophilicity (N) indexes values, it can be noted that N1 is more nucleophilic (N = 3.49 eV) than the ketones. K1 (N = 2.81 eV) and K3 (N = 2.90 eV) have lower values of nucleophilicity index compared to K2 (N = 3.27 eV). Thus considering electrophilicity, K3 and K1 are both stronger electrophiles and N1 is the best nucleophile. Hence N1/K3 is expected to interact better as compared to the other N1/K, which was also observed experimentally (Table 3, 4th column). Experimentally, similar cycloadditions [42] were carried out using several nitrones which include our N1 and ketones including K1 and K2 of ours, but exactly their choice of reactant pairs do not coincide precisely with those of ours. However, they have reported the product ratios of different stereoisomers and also the total yields of the reactions carried out over a time span of about 20 hr. It is apparent from their work that the reaction gets faster from N1/K1 to N1/K2 producing better yields, thus supporting our conjecture that the sequence of weak binding constants between the corresponding reactant pairs follow: N1/K3 > N1/K1 > N1/K2. The philicity based computational results are in fair agreement with the experimental results in all respect.
4. Conclusions
From above, the following conclusions could be drawn.
• The nitrone favours charge transfer interaction with unsaturated ketones in the order K3 > K1 > K2 in terms of experimental binding constants (K), transi- tion dipole strengths (µEN) and resonance energies (RN) of the complexes and these are also in accordance with the electrophilicity (ω) and nucleophilicity (N) indexes of the ketones calculated at DFT/B3LYP/6- 31G(d) level of theory on the optimized ground state geometries.
• In either case K2 has the least tendency to interact with the nitrone for entering into successful non-covalent charge transfer interaction.
• Overall, considering theory and experiment, K3 has strongest possibility to interact with this particular nitrone N1 in non-polar toluene medium.
5. Acknowledgements
Prof. Avijit Banerji of University College of Science, University of Calcutta (Department of Chemistry) has gifted the nitrone and ketones used in this study. The authors duly acknowledge him.
REFERENCES
- L. J. Prins, D. N. Reinhoudt and P. Timmerman, “Noncovalent Synthesis Using Hydrogen Bonding,” Angewandte Chemie International Edition, Vol. 40, No. 13, 2001, pp. 2382-2426. doi:10.1002/1521-3773(20010702)40:13<2382::AID-ANIE2382>3.0.CO;2-G
- S. Bhattacharya, M. Banerjee and A. K. Mukherjee, “Study of the Formation Equilibria of Electron DonorAcceptor Complexes between -Fullerene and Methylbenzenes by Absorption Spectrometric Method,” Spectrochimica Acta Part A, Vol. 57, No. 7, 2001, pp. 1463- 1470. doi:10.1016/S1386-1425(00)00489-3
- S. Bhattacharya, S. Bhattacharya (Banerjee), K. Ghosh, S. Basu and Manas Banerjee, “Study of Electron DonorAcceptor Complex Formation of o-ChloranilWith a Series of Phosphine Oxides and Tri-n-butyl Phosphate by the Absorption Spectrometric Method,” Journal of Solution Chemistry, Vol. 35, No. 4, 2006, pp. 519-539. doi:10.1007/s10953-005-9013-x
- S. Bhattacharya, S. K. Nayak, S. K. Chattopadhyay, M. Banerjee and A. K. Mukherjee, “Absorption Spectroscopic Study of EDA Complexes of [70]Fullerene with a series of Methyl Benzenes,” Spectrochimica Acta Part A, Vol. 57, No. 2, 2001, pp. 309-313. doi:10.1016/S1386-1425(00)00388-7
- Z. Zou, J. Ye and H. Arakawa, “Role of R in Bi2RNbO7 (R = Y, Rare Earth): Effect on Band Structure and Photocatalytic Properties,” Journal of Physical Chemistry B, Vol. 106, No. 3, 2002, pp. 517-520. doi:10.1021/jp012982f
- A. Eychmuller and A. L. Rogach, “Chemistry and Photophysics of Thiol-Stabilized II-VI Semiconductor Nanocrystals,” Pure and Applied Chemistry, Vol. 72, No. 1-2, 2000, pp. 179-188. doi:10.1351/pac200072010179
- T. H. Ghaddar, J. K. Whitesell and M. A. Fox, “Excimer Formation in a Naphthalene-Labeled Dendrimer,” Journal of Physical Chemistry B, Vol. 105, No. 37, 2001, pp. 8729-8731. doi:10.1021/jp010933x
- A. S. Baranski and W. R. Fawcett, “Solvent Effects in Simple Electron Transfer Reactions,” Winkler, K. Ed., Journal of the Chemical Society, Faraday Transactions, Vol. 92, 1996 pp. 3899-3904.
- M. Ricco, M. Bisbiglia, R. Derenzi and F. Bolzoni, “Observation of Superconductivity in TDAEC60,” Solid State Communications, Vol. 101, No. 6, 1997, pp. 413-416.
- S. M. Andrade, S. M. B. Costa and R. Pansu, “Structural Changes in w/o TritonX-100/Cyclohexane-Hexanol/Water Microemulsions Probed by a Fluorescent Drug Piroxicam,” Journal of Colloid and Interface Science, Vol. 226, No. 2, 2000, pp. 260-268. doi:10.1006/jcis.2000.6821
- A. Polozova and B. J. Litman, “Cholesterol-Dependent Recruitment of di22:6-PC by a G Protein-Coupled Receptor into Lateral domains,” Journal of Biophysics, Vol. 79, No. 5, 2000, pp. 2632-2643. doi:10.1016/S0006-3495(00)76502-7
- C. Reichardt, “Solvatochromic Dyes as Solvent Polarity Indicators,” Chemical Reviews, Vol. 94, No. 4, 1994, pp. 2319-2358. doi:10.1021/cr00032a005
- A. Padwa and W. H. Pearson, “Synthetic Applications of 1,3-Dipolar Cycloaddition Chemistry towards Heterocycles and Natural Products,” John Wiley & Sons, New York, 2002. doi:10.1002/0471221902
- A. Banerji and P. Sengupta, “Recent Studies on 1,3-Dipolar Cycloadditions of Nitrones,” Journal of Indian Institute of Science, Vol. 81, No. 3, 2001, pp. 313-323.
- A. K. Parhi and R.W. Franck, “A Weinreb Nitrile Oxide and Nitrone for Cycloaddition,” Organic Letters, Vol. 6, No. 18, 2004, pp. 3063-3065. doi:10.1021/ol0489752
- Y. Zeng, B. T. Smith, J. Hershberger and J. Aube´, “Rearrangements of Bicyclic Nitrones to Lactams: Comparison of Photochemical and Modified Barton Conditions,” Journal of Organic Chemistry, Vol. 68, No. 21, 2003, pp. 8065-8067. doi:10.1021/jo035004b
- K. B. Jensen, M. Roberson and K. A. Jorgensen, “Catalytic Enantioselective 1,3-Dipolar Cycloaddition Reactions of Cyclic Nitrones: A Simple Approach for the Formation of Optically Active Isoquinoline Derivatives,” Journal of Organic Chemistry, Vol. 65, No. 26, 2000, pp. 9080-9084. doi:10.1021/jo001157c
- K. B. G. Torssell, “Nitrile Oxides, Nitrones and Nitronates in Organic Synthesis,” VCH, Weinheim, 1988.
- E. Breuer, “Nitrones and Nitronic Acid Derivatives: Their Structures and Their Roles in Synthesis,” In: S. Patai, Ed., The Chemistry of Amino, Nitroso and Nitro Compounds and Their Derivatives, John Wiley & Sons, New York, 1982.
- A. Banerji, D. Bandyopadhyay, T. Prangé and A. Neuman, “Unexpected Cycloadducts from 1,3-Dipolar Cycloaddition of 3,4-Dehydromorpholine N-Oxide to N-Cinnamoyl Piperidines—First Report of the Novel Formation of 2:1 Cycloadducts,” Tetrahedron Letters, Vol. 46, No. 15, 2005, pp. 2619-2622. doi:10.1016/j.tetlet.2005.02.083
- R. Huisgen, “1,3-Dipolar Cycloaddition Chemistry,” In: A. Padwa, Ed., Wiley, New York, 1984.
- K. V. Gothlf and K. A. Jorgensen, “Asymmetric 1,3-Dipolar Cycloaddition Reactions,” Chemical Review, Vol. 98, No. 2, 1998, pp. 863-909. doi:10.1021/cr970324e
- L. R. Domingo, E. Chamorro and P. Pérez, “Understanding the Reactivity of Captodative Ethylenes in Polar Cycloaddition Reactions. A Theoretical Study,” Journal of Organic Chemistry, Vol. 73, No. 12, 2008, pp. 4615-4624. doi:10.1021/jo800572a
- T. K. Das, S. Salampuria and M. Banerjee, “Computational DFT Study of the 1,3-Dipolar Cycloadditions of 1- Phenylethyl-trans-2-methyl Nitrone to Styrene and 1-Phenylethyl Nitrone to Allyl Alcohol,” Journal of Molecular Structure: THEOCHEM, Vol. 959, No. 1-3, 2010, pp. 22- 29. doi:10.1016/j.theochem.2010.08.001
- H. A. Benesi and J. H. Hildebrand, “A Spectrophotometric Investigation of the Interaction of Iodine with Aromatic Hydrocarbons,” Journal of American Chemical Society, Vol. 71, No. 8, 1949, pp. 2703-2707. doi:10.1021/ja01176a030
- K. A. Connors, “Binding Constants: The Measurement of Molecular Complex Stabilility,” John Wiley & Sons, New York, 1987.
- T. Chaudhuri, D. Goswami, M. Banerjee, S. Chattopadhyay and S. K. Nayak, “Supramolecular Selectivity of -Fullerene among Equivalently Photoactive Porphyrins,” Journal of Luminescence, Vol. 130, No. 10, 2010, pp. 1750-1755. doi:10.1016/j.jlumin.2010.04.004
- R. G. Parr, L. V. Szentpaly and S. Liu, “Electrophilicity Index,” Journal of American Chemical Society, Vol. 121, No. 9, 1999, pp. 1922-1924. doi:10.1021/ja983494x
- A. Corsaro, V. Pistara, A. Rescifina, A. Piperno, M. Chiacchio and G. Romeo, “A DFT Rationalization for the Observed Regiochemistry in the Nitrile Oxide Cycloaddition with Anthracene and Acridine,” Tetrahedron, Vol. 60, No. 31, 2004, pp. 6443-6451. doi:10.1016/j.tet.2004.06.052
- R. Contreras, J. Andres, V. S. Safont, P. Campodonico and J. G. Santos, “A Theoretical Study on the Relationship between Nucleophilicity and Ionization Potentials in Solution Phase,” Journal of Physical Chemistry A, Vol. 107, No. 29, 2003, pp. 5588-5593. doi:10.1021/jp0302865
- J. P. Freeman, “Organic Synthesis, Collective Volume 1,” R. L. Danheiser, (Ed.), 1941, p. 78. Volume 2, 1922, p. 1.
- A. Frisch, M. J. Frisch, F. R. Clemente and G. W. Trucks, “Gaussian 09 Cluster/LAN Parallel Version with Linda,” Gaussian Inc., Wallingford, 2009.
- V. Gutmann, “The Donor-Aceeptor Approach to Molecular Interactions,” Plenum Press, New York, 1978. doi:10.1007/978-1-4615-8825-2
- F. L. Riddle Jr. and F. M. Fowkes, “Spectral Shifts in Acid-Base Chemistry. 1. Van der Waals Contributions to Acceptor Numbers,” Journal of American Chemical Society, Vol. 112, No. 9, 1990, pp. 3259-3264. doi:10.1021/ja00165a001
- M. J. Kamlet and R. W. Taft, “The Solvatochromic Comparison Method. I. The Beta-Scale of Solvent HydrogenBond Acceptor (HBA) Basicities,” Journal of American Chemical Society, Vol. 98, No. 2, 1976 pp. 377-383. doi:10.1021/ja00418a009
- T. Chaudhuri, S. Mula, S. Chattopadhyay and M. Banerjee, “Photophysical Properties of the 8-Phenyl Analogue of PM567: A Theoretical Rationalization,” Spectrochimica Acta Part A, Vol. 75, No. 2, 2010, pp. 739-744. doi:10.1016/j.saa.2009.11.048
- T. Chaudhuri, P. Shukla, S. K. Nayak, S. Chattopadhyay and M. Banerjee, “Solvent Effect on Photophysical Properties and Mg2+ Binding of 1,3-Diphenyl-propane-1,3- dione,” Journal of Photochemistry and Photobiology A: Chemistry, Vol. 215, No. 1, 2010, pp. 31-37. doi:10.1016/j.jphotochem.2010.07.017
- I. R. Gould, D. Noukakis, L. Gomez-Jahn, R. H. Young, J. Goodman and S. Farid, “Radiative and Nonradiative Electron Transfer in Contact Radical-Ion Pairs,” Chemical Physics, Vol. 176, No. 2-3, 1993, pp. 439-456. doi:10.1016/0301-0104(93)80253-6
- G. Briegleb and J. Czekalla, “Intensity of Electron Transition Bands in Electron Donator-Acceptor Complexes,” Zeitschrift für physikalische Chemie (Frankfurt), Vol. 24, 1960, pp. 37-54.
- P. Jaramillo, L. R. Domingo, E. Chamorro and P. Pérez, “A Further Exploration of a Nucleophilicity Index Based on the Gas-Phase Ionization Potentials,” Journal of Molecular Structure: THEOCHEM, Vol. 865, No. 1-3, 2008, pp. 68-72. doi:10.1016/j.theochem.2008.06.022
- L. R. Domingo, M. J. Aurell, P. Pe´rez and R. Contreras, “Quantitative Characterization of the Global Electrophilicity Power of Common Diene/Dienophile Pairs in DielsAlder Reactions,” Tetrahedron, Vol. 58, No. 22, 2002, pp. 4417-4423. doi:10.1016/S0040-4020(02)00410-6
- N. Acharjee, A. Banerji and T. Prange, “DFT Study of 1,3-Dipolar Cycloadditions of C,N-Disubstituted Aldonitrones to Chalcones Evidenced by NMR and X-Ray Analysis,” Monatshefte für Chemie, Vol. 141, No. 11, 2010, pp. 1213-1221. doi:10.1007/s00706-010-0393-2
NOTES
*Corresponding authors.