Journal of Surface Engineered Materials and Advanced Technology
Vol.4 No.5(2014), Article
ID:48969,13
pages
DOI:10.4236/jsemat.2014.45032
Instantly Investigating the Adsorption of Polymeric Corrosion Inhibitors on Magnesium Alloys by Surface Analysis under Ambient Conditions
Lívia M. Garcia Gonçalves1,2,3, Larissa C. Sanchez1,2,3, Stephani Stamboroski1,2,4, Yendry R. Corrales Urena1,5, Welchy Leite Cavalcanti1*, Jörg Ihde1, Michael Noeske1, Marko Soltau6, Kai Brune1
1Fraunhofer Institute for Manufacturing Technology and Advanced Materials IFAM, Bremen, Germany
2CAPES Foundation, Ministry of Education of Brazil, Brasília, Brazil
3Department of Materials Engineering, UFSCar, Federal University of São Carlos, São Carlos, Brazil
4Department of Chemistry, UFSC, Federal University of Santa Catarina, Florianópolis, Brazil
5UNESP São Paulo State University, São Paulo, Brazil
6Straetmans High TAC GmbH, Hamburg, Germany
Email: *welchy.leite.cavalcanti@ifam.fraunhofer.de
Copyright © 2014 by authors and Scientific Research Publishing Inc.
This work is licensed under the Creative Commons Attribution International License (CC BY).
http://creativecommons.org/licenses/by/4.0/


Received 20 June 2014; revised 22 July 2014; accepted 14 August 2014
ABSTRACT
Surface engineering of magnesium alloys requires adequate strategies, processes and materials permitting corrosion protection. Liquid formulations containing corrosion inhibitors often are to be optimized according to the demands of the respective substrate and following the service conditions during its application. As an interdisciplinary approach, a combination of several techniques for instantly monitoring or elaborately analyzing the surface state of magnesium was accomplished in order to characterize the performance of new adsorbing sustainable amphiphilic polymers which recently were developed to facilitate a multi-metal corrosion protection approach. The application of established techniques like Contact Angle measurements and X-ray Photoelectron Spectroscopy investigations was supplemented by introducing related and yet faster online-capable and larger-scale techniques like Aerosol Wetting Test and Optically Stimulated Electron Emission. Moreover, an inexpensive setup was configured for scaling the inset and the extent of degradation processes which occur at local electrochemical circuits and lead to hydrogen bubble formation. Using these analytical tools, changes of the surface state of emeried AM50 samples were investigated. Even in contact with water, being a moderate corrosive medium, the online techniques facilitated detecting surface degradation of the unprotected magnesium alloy within some seconds. In contrast, following contact with a 1 weight% formulation of a polymeric corrosion inhibitor, surface monitoring indicated a delay of the onset of degradation processes by approximately two orders of magnitude in time. Mainly based on the spectroscopic investigations, the corrosion inhibiting effects of the investigated polymer are attributed to the adsorption of a primary polymer layer with a thickness of a few nanometers which occurs within some seconds. Immersion of magnesium for several hours brings up a protective film with around ten nanometers thickness.
Keywords:Online Surface Monitoring, Magnesium Alloys, Polymeric Corrosion Inhibitors, Fast Screening of Effective Formulations, Optimization of Application Process

1. Introduction
Magnesium alloys have been used in transport and especially automotive industries due to their mechanical properties combining light weight and high specific strength. Magnesium is also an excellent functional material. Its alloys are attractive battery electrodes, sacrifice anodes, and hydrogen storage materials. However, when exposed to ambient atmosphere and wet environments, unprotected magnesium is too reactive and susceptible to corrosion [1] . Evidently, applications and devices profiting from the structural properties of magnesium alloys must be reliable [2] . In this way, corrosion protection is a relevant aspect to be considered.
A large amount of approaches based on material engineering have been used to improve the corrosion resistance of Magnesium alloys, for example decreasing the impurity level, increasing the amount of Aluminum and producing a more homogeneous microstructure by rapid solidification [3] [4] . Furthermore, nanostructured superhydrophobic films [5] , self-assembled monolayers [6] , and polymeric corrosion inhibitors have been shown to provide corrosion protection for different types of metals. Inhibitors are often easy to apply and offer the advantage of in-situ application without causing any significant disruption to the manufacturing process [3] .
Different analytical techniques have been used to investigate the corrosion behavior of Magnesium alloys. X-ray Photoelectron Spectroscopy (XPS) is a vacuum-based technique for surface analysis providing insight in the elemental and chemical composition of an approximately ten nanometer thin surface layer, and XPS is established for evaluating the performance of corrosion protection systems for magnesium alloys [5] [6] .
Aiming at instant online analysis under ambient conditions, secondary electron emission or the interaction between magnesium (alloy) surfaces and water may be assessed.
Optically Stimulated Electron Emission (OSEE) may be considered a non-destructive technique to detect contaminants on adherent surfaces due to the change of electron emission characteristics, e.g. the work function [7] . Modifications of the surface state of metals [8] or metals covered with self-assembled monolayers (SAM) [9] , of ceramics [10] , of polymers and also of CFRP [11] may result in a change of the detected electron flow [12] [13] . In case of metals, the presence of electrically nonconductive substances or films on the surface would interfere with the surface photoemission, resulting in a lower value read in the scale of arbitrary units [14] . This OSEE ability of giving evidence about layers on surfaces may be useful, for instance, to determine the optimal duration of surface treatments for various substrates, as degreasing or etching. However, the technique alone will not facilitate to clearly discriminate effects of different surface treatments, since identical values may be obtained from different chemical states of the surface under investigation [9] . In this way, the technique is supposed to work in its best condition when it only differentiates an initial and a final surface state by the presence or absence of a surface contaminant [14] . On the other hand, the device also facilitates to follow the effects of a surface treatment as a function of time, as for example to determine the growth law of an oxide film on the surface of freshly emeried copper [9] .
Upon interaction between water and magnesium (alloy) surfaces, hydrogen is formed resulting from the corrosion of magnesium. The overall reaction for the degradation of magnesium with a thin layer of water can be expressed as Equation (1) [1] .
 (1)
(1)
The thin layer of a protic electrolyte which is in contact with the surface of an aluminum [15] or magnesium alloy may locally become supersaturated due to the fast formation of hydrogen upon metal degradation. In this way, around local galvanic cells hydrogen bubbles may be formed [15] .
Based on this principle, a procedure called Hydrogen Bubble Formation Test (H2BT) was set up and used to observe and follow inset and extent of hydrogen bubble formation on a magnesium alloy. Using a digital light microscope, videos were recorded and images of several appearing, growing and finally ascending hydrogen bubbles were evaluated.
Moreover, wetting properties of magnesium surfaces can be investigated. Theoretically, on an ideal, flat, rigid and homogeneous surface the contact angle (Θ) is used to determine the surface energy and the surface tension to describe solid-liquid interactions [16] . The contact angle (Θ) of a liquid drop on a solid surface is defined by the mechanical equilibrium of the drop under the action of three interfacial tensions (γ): solid-vapor γsv, solid-liquid γsl and liquid-vapor γlv. This equilibrium relation described in Equation (2) is known as Young’s equation [17] .
 (2)
(2)
In general, the surface energy of a material depends on the chemical composition and surface charge [18] . Under ideal conditions, the contact angles values do not only depend on the surface energy between the interfaces [19] as they are also influenced by the surface geometry of the solid which changes depending on roughness [19] and type of porosity [20] . A non-spectral method like a contact angle measurement is a simple, rapid and inexpensive technique used extensively to characterize changes in the surface wetting behavior [21] due to processes for surface modification [22] or surface contamination [16] . The water contact angle indicates the surface wettability based on the spreading behavior of one droplet of water on a surface [21] .
The Aerosol Wetting Test (AWT) is a method to rapidly characterize the wetting properties of large-scale surfaces [23] . This technique was developed to overcome some limitations of contact angle measurements with respect to their speed and, as well, to overcome the limitations of the fast water break test with respect to obtaining continuous data for quantitatively describing wetting properties. With the AWT, two sides of a sample can be measured separately, curved surfaces can be investigated, large samples can be measured, and a quick access to surface wettability maps is facilitated. Moreover, the AWT adds high material throughput because it can be applied to measure areas of approximately ten square centimeters in less than five seconds.
The expedient applicability of the AWT for identifying regions covered with release agent or hydraulic fluid and, in as another scenario, thermally degraded surfaces was reported for Carbon-Fiber Reinforced Plastic (CFRP) substrates in the frame of an Extended Non-Destructive Testing (ENDT) approach [24] -[26] . However, investigations concerning the potential of the AWT to detect the presence of corrosion inhibiting layers or to investigate early stages of corrosion starting from a material interface were not yet reported.
In this work, for the first time a combination of several techniques for monitoring or analyzing the state of metal surfaces was used to investigate magnesium corrosion protection, reporting the potential of new adsorbing sustainable amphiphilic polymers which recently were developed to facilitate a multi-metal corrosion protection approach. The Hydrogen Bubble Formation Test (H2BT), Contact Angle (CA), Aerosol Wetting Test (AWT), Optically Stimulated Electron Emission (OSEE) and X-Ray Photoelectron Spectroscopy (XPS) were applied to investigate the surface state of emeried AM50 samples covered with a polymeric corrosion inhibitor.
2. Experimental Procedure
Samples of magnesium alloy AM50 (Rocholl GmbH, Aglasterhausen, Germany) were cut and manually emeried using dry and flat SiC sand paper with a grit size of 800 mesh, in order to create a fresh surface under ambient conditions. After grinding, two sets of samples were investigated. The first set comprises samples which were immersed in demineralized water, and the samples of the second set were immersed in an aqueous liquid formulation containing 1 weight% of a polymeric corrosion inhibitor (p.c.i.). The investigated times of immersion were five, ten, 30 and 90 seconds, three, ten and 30 minutes (180, 600 and 1800 seconds, respectively), one, three and six hours (3600, 10800 and 21600 seconds, respectively). After the pre-defined times of immersion, samples were withdrawn from the formulation, and the liquid film was blown away from surface using air pressurized with a hand bellow. In case of the second set of samples, which were immersed in the formulation to be investigated with respect to its corrosion inhibiting effects, sample specimens were submitted to water rinsing for 25 seconds immediately after finished the immersion. This procedure was applied in order to remove possibly remaining polymer physisorbates on the surface before the drying with a bellow. Sketches of both procedures are shown in Figure 1.
One portion of each set of samples was next scanned with the OSEE technique and imaged with the AWT technique, and then a cut sample piece was taken to XPS measurements. Another portion of samples was characterized with measurements of contact angle (CA) or the Hydrogen Bubble Formation Test (H2BT).
For the CA and AWT measurements, Silicon (110) wafer and Glassy Carbon samples were used as reference samples to verify the reproducibility of the water deposition in both tests. Both samples were used after approximately twenty AWT spraying cycles, with no cleaning process done before the measurements.
2.1. Description of the Polymeric Corrosion Inhibitor (p.c.i.) Solution
A water-based formulation G50 wb of Additive G50 (Straetmans High TAC GmbH, Hamburg, Germany) was used. Based on a 50 wt% containing parent formulation, a 1 wt% formulation was prepared by diluting the parent solution with demineralized water. Attached to a polymeric polyoxyalkylene backbone, the metalophilic anchors comprised in polymers of the G50 type are the conjugate base of acidic groups [27] . The polar groups of the amphiphilic polymers may interact with various cations in oxide, hydroxide or carbonate-based reaction layers on distinct metals and alloys. The development of such multi-metal protection capacity of the amphiphilic polymers which are contained in G50 wb was governed by computer-based simulation [28] .
2.2. Contact Angle (CA)
The apparent contact angles were measured using a goniometer (OCA15 Plus, Data Physics Instruments, Germany) by a sessile drop technique, and HPLC grade water (Across Organics) was used as probe liquid; the volume of the drops was kept constant (20 µl) for each measurement. The contact angle values reported are an average value of at least nine separate drops on different substrate areas. The recorded images were analyzed using SCAN 20 Data Physics software.
2.3. Aerosol Wetting Technique (AWT)
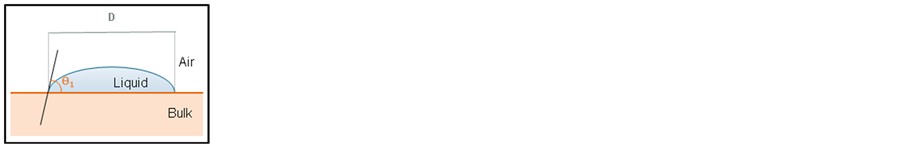
When applied to surfaces, droplets of an aerosol can form wide or narrow drops, according to the surface state and surface energy. The Aerosol Wetting Test can be related to the principles of contact angle measurements: for a defined volume of a liquid, the droplet size in contact with a solid surface depends directly on the contact angle [26] . In this case, the droplet diameter is measured instead of the contact angle itself. In Figure 2, the rela-
 (a)
(a) (b)
(b)
Figure 1. (a) Sketch of procedure for immersing the surface of a magnesium sample in water; (b) Sketch of procedure for immersing a magnesium sample in a liquid formulation of polymeric corrosion inhibitor.
 (a)
(a)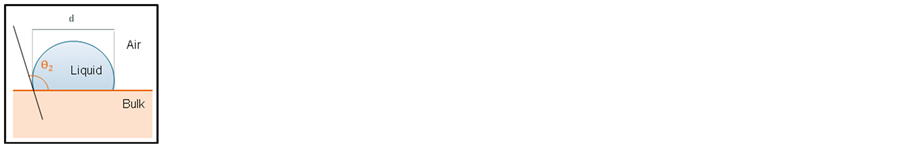 (b)
(b)
Figure 2. Sketch displaying the relation between the contact angle and the drop diameter; D and d are drop diameters (with d < D), and θ1 and θ2 are contact angles (θ1 < θ2). (a) Higher contact angles and poor wetting, resulting in smaller drop sizes d; (b) smaller contact angles and higher wetting, resulting bigger drop sizes D.
tion between the contact angle and the drop diameter is illustrated. This means that the wetting properties of a surface can be characterized by the droplet size distribution.
As a quick résumé, higher contact angles imply poor wetting and smaller drop diameters (Figure 2(a)); and smaller contact angles imply higher wetting and bigger drop sizes (Figure 2(b)). If the surface energy of a sample (locally) is low, e.g. due to contaminations like release agents (silicones, fluoropolymers), small drops will be formed on the surface. If the surface energy of a sample is high, wide drops will form [26] . The Aerosol Wetting Test evaluates the mean drop size of droplets after application of an aerosol.
The Aerosol Wetting Test system consists of a spray-mist ultrasonic atomizer, a linear motion table, an illumination unit composed by parallel lights, an image detection system and a computer with software for image analysis. Small primary water drops with a narrow drop size distribution, forming a fog, were created using an ultrasonic atomizer nozzle (Sonotek, Impact, 120 kHz). This nozzle was fed by a syringe pump (Sonotek 997) ensuring a constant water flow of 5.0 ml/min. With a constant airflow, these drops were sprayed towards the sample surface, which was exposed to the spray for one cycle with two applications. Depending on the surface energy of the sample, these drops form a particular pattern, with wide or narrow secondary drops (formed by confluence of primary drops) on the surface. A camera (Olympus, Color View III, 2576 × 1932 pixles2, field of view: 13 × 10 mm²), positioned perpendicularly to the surface, was used to acquire images of these drop patterns in a pre-selected region of the tested surface. The pictures were processed (background subtraction and quality refining) using an image analysis software (Soft Imaging System, analy SIS 5.0). This step is necessary to remove structures or scratches on the sample. Afterwards, the perimeters of the drops were identified, and the areas of the drops were measured and classified. Using a two parameter fit, the results were fitted to match a Rosin-Rammler drop-size distribution [24] . The mean distribution width was used to rate the fitting results. The results obtained for each condition were compared among themselves and statements about the wetting properties were done [23] .
2.4. Hydrogen Bubble Formation Test (H2BT)
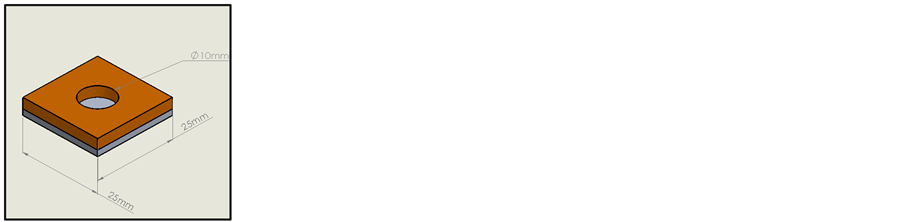
Using a light microscope Keyence VHX500 under ambient conditions, samples with a size of 25 mm × 25 mm were submitted to the H2BT. A sample was placed on the table of the microscope, and a silicon mold with an opening with a diameter of 10mm was pressed against the sample surface as depicted in Figure 3. Images were taken before and during the contact of the AM50 surface with ca. 0.27 mL of water or the aqueous G50 wb formulation. Videos with a duration of ten minutes were recorded. Light microscopic images of the initial and the final state of the sample surface were taken. Before each measurement the mold was cleaned with pure water and isopropanol in order to guarantee that no silicone material, which might influence the corrosion behavior of the sample, becomes released from the mold. Additionally, the wetting behavior of samples having passed the H2BT was inspected with the AWT.
2.5. Optically Stimulated Electron Emission (OSEE)
OSEE experiments were performed under ambient conditions with a Surface Quality Monitor SQM200 (Photo Emission Tech., Inc. (PET), USA). During an OSEE measurement, the sample surface is exposed to ultra-violet
 (a)
(a)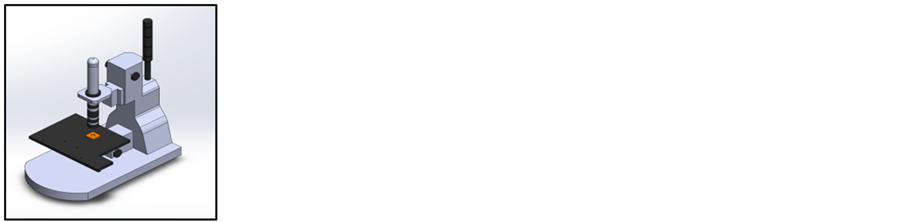 (b)
(b)
Figure 3. Sketches displaying the experimental procedure of the Hydrogen Bubble Formation Test (H2BT); (a) Set-up with sample on microscope table; (b) metal sample with silicone mould on top.
light of a mercury vapor lamp with intensity maxima at wavelengths of 254 and 185 nm, corresponding to 4.9 and 6.7 eV, respectively. The emitted photoelectrons exhibit a maximum kinetic energy of less than approximately 2 eV which effects a sub-micrometer information depth for the surface of a solid and an interaction with the atmosphere as low as to permit sensor-surface distances in the millimeter range. An electric potential of 40 V causes the attraction of the emitted photoelectrons to the collector, generating a current which is measured by a solid state electrometer. The measured photocurrent values are converted to a scale of arbitrary units, denoted as OSEE intensity, and may be interpreted in terms of integral band intensities of the underlying contributing electronic spectra [29] , appending the respective photoionization cross sections. The device is operated with a moving table being electrically conductive and earthed, in which samples are placed during the procedures. Due to sample dimensions in the range of 25 mm × 25 mm, an aperture of 1.6 mm diameter was used in front of the UV lamp standing about 5.5 mm from the surface. The samples were scanned with a step size of 1.016 mm in orthogonal directions, covering the whole sample area. For purposes of evaluation, a mean OSEE signal value was calculated by averaging the OSEE intensities obtained within an area of 10 mm × 10 mm around the central portion of the sample. For each time of immersion of magnesium samples, measurements in different samples were repeated at least three times and an average of all measurements realized were plotted along with the thus obtained standard deviation.
2.6. X-Ray Photoelectron Spectroscopy (XPS)
The XPS spectra were taken using a Kratos Ultra system applying the following acquisition parameters: base pressure: 4 × 10⁻⁸ Pa, sample neutralization applying low energy electrons (<5 eV), hybrid mode (electrostatic and magnetic lenses are used), take off angle of electrons 0˚, pass energy 20 eV (or, respectively, 40 eV in case of some less concentrated constituents) in high resolution spectra and 160 eV in survey spectra, excitation of photoelectrons was done by monochromatic AlKα radiation. The analysis area is elliptically shaped with main axes of 0.3 mm × 0.7 mm. The binding energy calibration was performed by referring the C1s component of aliphatic carbon species to 285.0 eV. Elemental ratios were calculated based on the area of the peaks and considering the percentage of the elements provided by XPS.
3. Results and Discussions
In this chapter, the results obtained when investigating the changes of AM50 surfaces in contact with water or with an aqueous G50 wb formulation containing a polymeric corrosion inhibitor (p.c.i.) will be reported. Special focus will be put to experimental and analytical procedures revealing changes within a few minutes. Based on details about the adsorption behavior of p.c.i. molecules, the chronology and the effects resulting from the interaction of p.c.i. with AM50 surfaces will be elaborated.
3.1. Simulations of the Dynamical Behavior of a Polymeric Corrosion Inhibitor
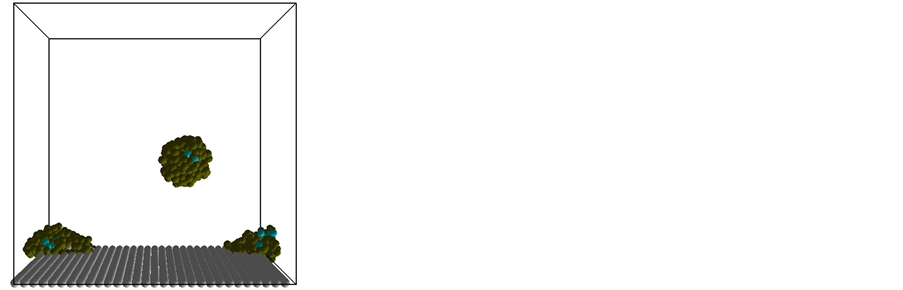
Investigations based on Dissipative Particle Dynamics (DPD) simulations indicate that the attachment of the first layer of G50 type p.c.i. polymers to hydrophilic surfaces formed by reaction layers on metal samples occurs via the polar groups of the p.c.i. and the surface. As indicated by the sketch depicted in Figure 4, the wettability of the polymer-covered metal surfaces is dominated by rather hydrophobic molecular moieties. In detail, Figure 4 shows two time-steps of the concomitantly occurring association processes of the p.c.i. molecules in water and at the presence of a hydrophilic surface like, for instance, a hydroxylated magnesium oxide surface. The rounded moieties in the sketches represent the superatoms or beads used for the mesoscale DPD simulation. It is worthwhile mentioning that each one of the DPD beads representing water comprises three water molecules and that water beads are not shown for clarity. Moreover, p.c.i. aggregates on the hydrophilic surface may incidentally result to be positioned close to the walls of the simulation cell; then they will be depicted in two seemingly separated parts due to the periodic boundary conditions applied during the simulation. In total, the simulation cell contains ten p.c.i. molecules. The DPD calculations reveal the chronology of the adsorption of amphiphilic polymers: following an association of several molecules in the liquid medium, the associates become adsorbed. That is in contrast to the behavior for anionic low-molecular surfactants like sodium dodecyl sulfonate (SDS) [30] at metal oxide surfaces, which is effected by the adsorption of single anions followed by a subsequent association and formation of hemimicelles. However, the simulations do not yet reveal the minimum time needed for
 (a)
(a)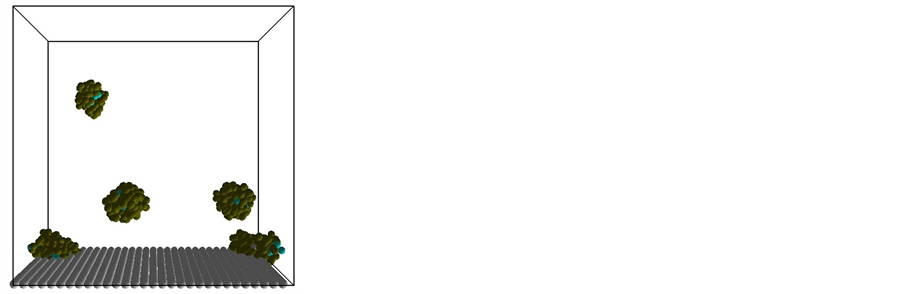 (b)
(b)
Figure 4. Two snapshots obtained during modelling the association of polymeric corrosion inhibitor (p.c.i.) molecules in water and in presence of a hydrophilic surface as revealed by Dissipative Particle Dynamics (DPD) simulations. The water solvent beads are not shown for clarity. In total, the simulations cell contains ten p.c.i. molecules. In the simulation cell depicted on the left side (Image (a)), each aggregate in the aqueous formulation contains two p.c.i. molecules and the aggregate adsorbed on the hydrophilic surface contains four p.c.i. molecules. A later time-step of the simulation (Image (b)) reveals p.c.i. agglomeration in the water phase.
polymer adsorption in a closed layer or, technologically even more relevant, the time required until an effective protection of the metal surface is secured. In the subsequent sections, an experimental approach to locate such time scale for the p.c.i. adsorption on magnesium will be presented.
3.2. Contact Angle
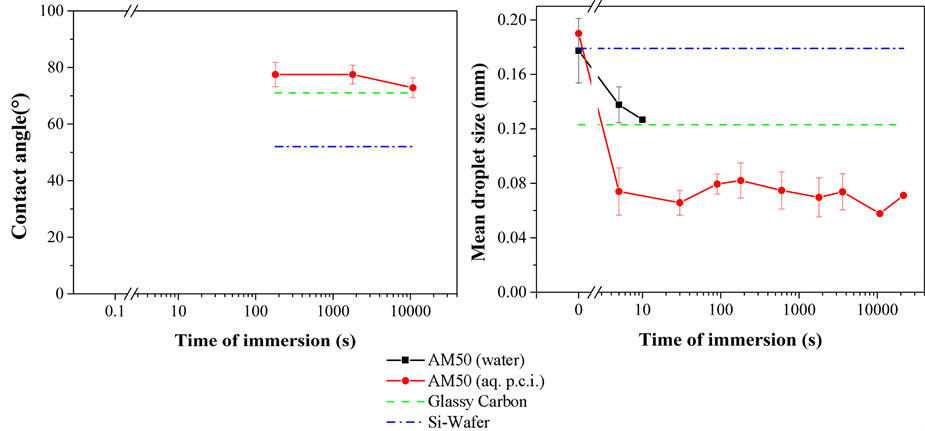
The static contact angle was measured by establishing the tangent (angle) θ of the water drop with a solid surface at the base as shown in Figure 2. The AM50 substrate was freshly emeried, then immersed in the p.c.i. formulation during 3 min, 30 min and 3 h, and finally rinsed. After this treatment the contact angle was measured. The freshly emeried substrate shows high wettability (θ < 25˚); contact-angle average values from different immersion times in the p.c.i. formulation are depicted in Figure 5(a).
The drops were observed not to be round but more or less elongated, and this finding is attributed to the influence of the roughness of the emeried substrate which is lower along the grooves than perpendicular to the grooves. For the sample obtained after an immersion of 3 min, a clearly higher contact angle than observed for the freshly emeried surface was found. This indicates a change from a highly hydrophilic to a more hydrophobic surface with a lower surface energy as a consequence of the immersion in the p.c.i. formulation.
As references for a substrate wettability, a Silicon wafer and a glassy carbon substrate were used, and the contact angle of 52˚ measured for the silicon wafer indicated that it has got a more hydrophilic surface than the glassy carbon featuring a contact angle of 71˚.
Contact angle measurements performed with AM50 samples immersed in the p.c.i. formulation for 3 min up to 3 h did not reveal significant changes of the surface wettability depending on the immersion time.
3.3. Aerosol Wetting Test
Like the contact angle (CA) measurements, the Aerosol Wetting Test (AWT) measurements are based on the contact between water droplets and substrate surfaces. While the CA measurements are done considering the side view according to different viewing directions on elongated drops, the measurements in the AWT are done performing a top view imaging of the drops and evaluating the area of these drops. The droplet areas are considered to calculate the drop sizes, and finally a Rosin-Rammler drop-size distribution fit is used.
The results obtained with the AWT for samples immersed in water and in the liquid corrosion inhibitor formulation are evidenced by the plot shown in Figure 5(b). It may be perceived that for samples immersed just in clean water the drop size obtained after ten seconds of immersion is smaller than the drop size obtained after
 (a) (b)
Figure 5. (a) Contact Angle variation and (b) mean droplet sizes obtained from Aerosol Wetting Test measurements after different immersion times in clean water and in an aqueous p.c.i. formulation, respectively.
five seconds of immersion, which is smaller than the drop size for the freshly emeried samples.
For samples immersed in the p.c.i. formulation, there is a distinct difference of the observed drop sizes as compared to the ones obtained for the freshly emeried sample. This holds true already for the AM50 samples which had been immersed for five seconds. Considering the error bar of the AWT results, there is not a significant difference between the surface wettability obtained after 5 s or after longer immersion times of up to six hours.
Subsequently, the wettabilty of the p.c.i. covered AM50 samples will be referenced to the wettability of the Silicon wafer and the glassy carbon (GC) sample used as references. The drop size for the freshly emeried AM50 samples, in both cases, were almost the same as obtained for the Silicon wafer sample, considered as the hydrophilic reference sample. The drop size obtained for the Glassy Carbon (GC) sample, the hydrophobic reference, was close to the drop size of the AM50 sample immersed for ten seconds in water. The AM50 samples immersed in the p.c.i. formulation showed clearly lower droplet sizes in the AWT. Neither the average droplet size nor the width of the droplet size distribution was observed to significantly depend on the time of immersion. The categorization of the wettability based on these results is consistent with the one based on the results obtained in the Contact Angle measurements.
Remarkably, the immersion in a p.c.i. formulation changed the mean droplet size after an immersion as short as five seconds. That indicates that the p.c.i. in the aqueous formulation rapidly changes the wettability of the AM50 surface.
The observations done may indicate a change of the wettability of AM50 surfaces upon immersion of only five seconds. Such surface modification may be related to a layer formation on the surface of the AM50 samples. On freshly emeried AM50 samples exposed to air, probably an oxide layer is formed, as the magnesium is highly reactive with oxygen, and upon immersion in water a hydroxylated surface layer may be formed as magnesium is highly reactive with water. For samples immersed in the aqueous p.c.i. formulation, the change of the wetting behavior can be explained by the formation of a polymer layer in less than five seconds of immersion. As indicated by the results of the DPD simulation, in contact with the aqueous p.c.i. formulation an adsorption of the amphiphilic molecules on the surface may occur.
As the AWT results refer to the topmost layer of the surface, it is possible to affirm that modifications on the surface happened within five seconds of immersion. After this time, there is not any huge difference of wettability between the samples immersed in the p.c.i. suspension, even though longer times of immersion might imply more polymer adsorption. Therefore, subsequently investigations referring to the possible corrosion protection properties of such layer will be reported. Moreover, OSEE and XPS analyses were done to investigate the surface with methods providing a higher information depth, to verify an oxide layer formation and the polymer layer deposition, and also to evaluate changes in the polymer layer that could have happened with longer immersion times.
3.4. Hydrogen Bubble Formation Test (H2BT)
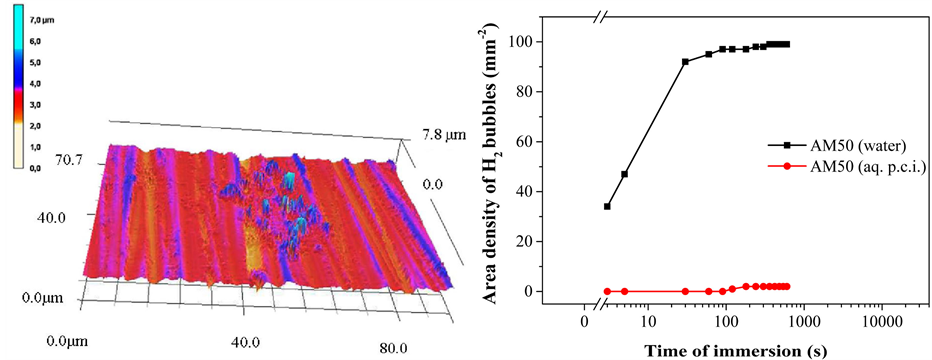
The hydrogen bubble formation due to the reaction of liquid water and the surface of magnesium alloy AM50 at especially active sites was monitored. After emerying, the AM50 substrate surface reveals grooves resulting from the emerying treatment which were imaged with Laser Scanning Confocal Microscopy (LSCM) as shown in Figure 6(a). Moreover, elevated and some micrometer wide particulate structures are evidenced. They are interpreted to be harder and, thus, more wear-resistant during the emerying treatment than the surrounding matrix. They are attributed to intermetallic phases like, for instance, the β-phase (Mg17Al12), of AM50. Such intermetallic phases may be more noble than the surrounding matrix material and form local galvanic cells at which the corrosion is promoted locally. The results obtained in the Hydrogen Bubble Formation Test (H2BT) are shown in Figure 6(b). It is possible to observe that, on an unprotected AM50 surface immersed in water, hydrogen bubbles appear after approximately three seconds, and the area density of bubbles generated on the surface of the AM50 is around 100 per mm2. Such hydrogen bubble area density fairly accords with the interpretation of the LSCM image displayed in Figure 6(a) which was tentatively explained to show one area of intermetallic phases within 0.01 mm2. When the aqueous p.c.i. formulation is applied over the sample instead of clean water, the hydrogen bubble formation decreases significantly only in presence of the p.c.i. molecules. This holds true as well for the onset of bubble formation which is delayed to 120 seconds as for the area density of hydrogen bubbles, which is approximately two orders of magnitude lower when compared to the immersion in clean water. These observed differences indicate that the adsorbing p.c.i. postpones the time after which the first hydrogen bubbles appear by a factor of 40.
Assuming that the incidence of the hydrogen bubbles is related to the galvanic corrosion at noble intermetallic phases exposed at the surface of magnesium alloys, in clean water an electrochemical contact between the two metal phases and the aqueous electrolyte occurs. The observation based on the AWT indicates that with the application of the p.c.i. on the surface of the AM50 a polymer deposit is formed within less than five seconds. On the other hand, the results obtained in the H2BT suggest that this deposit effectively acts against galvanic corrosion after latest three seconds. The respective deposit covers the surface of the alloy in a way that the contact between the metal phases and the electrolyte is diminished. Concluding, the adsorption of the polymer avoids the hydrogen formation and consequently induces corrosion protection.
3.5. Optically Stimulated Electron Emission (OSEE)
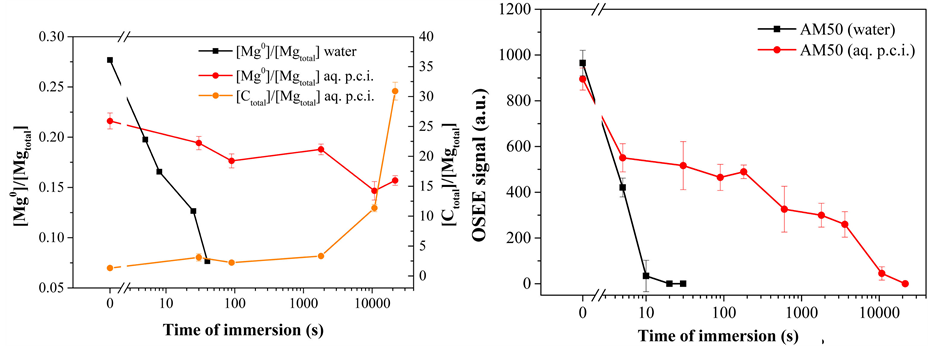
Effects of the formation of layers and films on the surface of AM50 samples as a consequence of the immersion in water or in aqueous polymeric corrosion inhibitor (p.c.i.) formulations were investigated using Optically Stimulated Electron Emission (OSEE). The plot displayed in Figure 7(b) represents the results obtained with the OSEE technique.
The immersion in water causes a very steep and fast loss of OSEE signal within some seconds of immersion. After five seconds of immersion, the OSEE intensity decays by a half, and after 20 seconds of immersion no emission is found. This is interpreted as an indication of the formation of a hydroxylated reaction layer on AM50. On the other hand, when samples are treated with the aqueous p.c.i. formulation, significant OSEE signals are detected until reaching an immersion time of three hours. After six hours of immersion in the polymer formulation, no emission is found. Observing the course of the OSEE signal with an increasing time of immersion, it is also noticeable that upon prolongated immersion in the p.c.i. formulation the OSEE signal decreases. This is interpreted to be due to layers on the AM50 surface which effectively grow in thickness with time. If a less photo-emitting layer system is formed, its effect on the OSEE signal will be the higher the thicker the layer system is and the more electrons emitted from the metallic substrate sample are scattered and attenuated.
These OSEE results show, for all situations, a decrease of intensity when immersed samples are compared to the freshly emeried surface of the AM50 alloy. Both upon immersion in clean water and upon immersion in the aqueous p.c.i. formulation, a layer is formed on the metal surface. Considering the differences of wettability identified using the AWT, different layers are formed in contact with clean water and, respectively, in contact with the p.c.i. formulation. By means of OSEE, a slower layer growth is indicated for the immersion in the p.c.i.
 (a) (b)
Figure 6. (a) Laser Scanning Confocal Microscopy (LSCM) image of a freshly emeried AM50 surface, and (b) incidence of hydrogen bubbles on AM50 samples immersed in clean water and, respectively, an aqueous polymeric corrosion inhibitor (p.c.i.) formulation as a function of immersion time.
 (a) (b)
Figure 7. Effects of immersing AM50 in clean water and, respectively, a formulation of polymeric corrosion inhibitor (p.c.i.): (a) Concentration ratios of [Mg0]/[Mgtotal] and [Ctotal]/[Mgtotal] as function of immersion time, obtained by XPS; (b) OSEE signal as a function of immersion time.
formulation as compared to the immersion in clean water. However, a differentiation cannot be performed concerning the chemical composition of a formed layer system, since both thinkable layers, namely magnesium hydroxide and polymer layers, are less photo-emitting than the metallic surface of the alloy, a finding also reported in the studies of aluminum surfaces by Romand et al. [9] .
From the OSEE investigations a kind of efficiency concerning the corrosion protection properties of the adsorbing p.c.i. can be obtained. Based on the time duration until the OSEE signal of an AM50 surface having been immersed vanishes, the alloy protection is around three orders of magnitude more effective in the presence of the p.c.i. formulation as compared to clean water. The OSEE technique can also follow, with quick and simple procedures, the formation and growth of layers on the alloy surface. For a clear characterization of this layer system, a spectroscopic surface analytical technique will be used.
3.6. X-Ray Photoelectron Spectroscopy (XPS)
Finally, X-ray Photoelectron Spectroscopy (XPS) investigations of AM50 surfaces obtained after immersion were performed with the samples selected based on the inexpensive and fast characterizations achieved with online-capable techniques. The most relevant results obtained are depicted in the Figure 7(a). A set of two plots refer to the concentration ratio between metallic magnesium species and the total of magnesium species: the first plot was found for samples immersed in water and the second plot was obtained for samples immersed in the aqueous p.c.i. formulation. Moreover, the concentration ratio between carbon and magnesium species for the samples immersed in the p.c.i. formulation is displayed.
For the immersion in water, a clear decrease of more than 70% of the metallic magnesium content is observed upon less than one minute of immersion. This decrease is due to the formation of a hydroxylated reaction layer resulting from the formation of undissolved magnesium species in contact with water.
However, when samples are immersed in the aqueous formulation of p.c.i., two concurrent effects may happen: the oxidation of the alloy and the chemisorption of the polymeric layer. Therefore, the respective signals are discussed. First, the decrease of the ratio between metallic magnesium species and the total of magnesium species is less than 50% even after six hours of immersion. That indicates that the increase of the hydroxide layer thickness on magnesium is drastically diminished in the presence of the p.c.i. as compared to the immersion in pure water. The reaction layer formed is thin, in the range of a few nanometers. Second, the content of carbon species increases with time, and it is most pronounced after times of immersion longer than 30 minutes. Even after only 30 seconds of immersion in the p.c.i. formulation, a thin organic film can be detected. As for longer times, the relative content of carbon species increases while the relative content of magnesium within the topmost surface region decreases. It is noticeable that a layer of carbon-containing species becomes deposited on top of the AM50 surface.
The time-dependent behavior dominated by the increase of organic species on the AM50 surface seems to be somewhat inversely related to the behavior of OSEE signal which decays. Within shorter times of immersion, the OSEE intensity decay is less steep, as well as the growth of carbon content observed by XPS. For times higher than three hours, however, the OSEE signal falls quickly as the polymeric layer becomes thicker and more close-packed as concluded from the XPS investigations.
4. Conclusions and Outlook
A combination of several techniques for instantly monitoring or elaborately analyzing the surface state of magnesium was applied in order to characterize the performance of new polymeric corrosion inhibitors. Fast online-capable and large-scale techniques like Aerosol Wetting Test and Optically Stimulated Electron Emission and, additionally, an inexpensive microscopic hydrogen bubble formation test for following effects of galvanic corrosion processes occurring at active sites were employed to investigate characteristic properties of polymeric corrosion inhibitors on a time-scale between some seconds and a few hours. Targeted samples selected based on the thus obtained results were characterized using an established technique like X-ray Photoelectron Spectroscopy.
The surface-sensitive techniques allow early detecting occurring degradation and, respectively, corrosion inhibition effects. Following the combined investigations, molecules of the investigated polymeric corrosion inhibitor become adsorbed on a freshly emeried AM50 surfaces within less than three seconds, forming a few nanometers thin layer inhibiting galvanic corrosion processes of the AM50 in contact with the aqueous inhibitor formulation. Moreover, a long-term corrosion inhibition effect for at least several hours is obtained in presence of the aqueous formulation of a polymeric corrosion inhibitor. This effect is related to a growing organic layer which becomes closely packed and reaches a thickness of around ten nanometers within some hours.
Ongoing investigations focus on the corrosion protection properties of distinctly thick films with the polymeric corrosion inhibitor when applying accelerated ageing tests like salt spray tests.
Acknowledgements
The authors are grateful to Science without Borders (Ciência sem Fronteiras, proc. L.M.G. Gonçalves 88888.021780/2013-00, L.C. Sanchez 88888.021800/2013-00 and S. Stamboroski 88888.020610/2013-00), Coordination of Improvement of Higher Education Personnel (CAPES - Brazil) and Consejo Nacional para Investigaciones Científicas y Tecnológicas de Costa Rica. (CONICIT) for the funding; the German Federal Ministry of Economics and Technology (BMWi) under the ZIM programme (Zentrales Innovationsprogramm Mittelstand-ZIM) and the “KABA” project (funding reference KF2139502 HA9) carried out with Straetmans High TAC GmbH; Enio B. Adolfato for performing the sketches in figure 3; Alexander I. Petzhold for the text review; Dr. Hauke Brüning for the LSCM measurements; and Prof. Dr. Horst-Erich Rikeit and Prof. Dr. Bernd Mayer for steady support and interesting discussions.
References
- Song, G. (2005) Recent Progress in Corrosion and Protection of Magnesium Alloys. Advanced Engineering Materials, 7, 563-586. http://dx.doi.org/10.1002/adem.200500013
- Song, G. and Atrens, A. (2003) Understanding Magnesium Corrosion: A Framework for Improved Alloy Performance. Advanced Engineering Materials, 5, 837-858. http://dx.doi.org/10.1002/adem.200310405
- Raja, P.B. and Sethuraman, M.G. (2008) Natural Products as Corrosion Inhibitor for Metals in Corrosive Media: A Review. Materials Letters, 62, 113-116. http://dx.doi.org/10.1016/j.matlet.2007.04.079
- Hu, R.-G., Zhang, S., Bu, J.-F., Lin, C.-J. and Song, G.-L. (2012) Recent Progress in Corrosion Protection of Magnesium Alloys by Organic Coatings. Progress in Organic Coatings, 73, 129-141. http://dx.doi.org/10.1016/j.porgcoat.2011.10.011
- Ishizaki, T., Masuda, Y. and Sa-kamoto, M. (2011) Corrosion Resistance and Durability of Superhydrophobic Surface Formed on Magnesium Alloy Coated with Nanostructured Cerium Oxide Film and Fluoroalkylsilane Molecules in Corrosive NaCl Aqueous Solution. Langmuir, 27, 4780-4788. http://dx.doi.org/10.1021/la2002783
- Liu, Y., Yu, Z., Zhou, S. and Wu, L. (2006) Self-Assembled Monolayers on Magnesium Alloy Surfaces from Carboxylate Ions. Applied Surface Science, 252, 3818-3827. http://dx.doi.org/10.1016/j.apsusc.2005.05.072
- Smith, T. (1983) Surface Quality Unit for Inspection by Nondestructive Testing (SQUINT). 15th National SAMPE Technical Conference, Cincinnati, 04-06 October 1983.
- Lee, T.-H. (1990) Selection of Lubricants for Metal Evaporated Tape. IEEE Transactions on Magnetics, 26, 171-173. http://dx.doi.org/10.1109/20.50525
- Romand, M., Gaillard, F., Charbonnier, M., Prakash, N.S., Deshayes, L. and Linossier, I. (1995) Adhesion Science and Surface Analysis. Typical Examples. The Journal of Ad-hesion, 55, 1-16. http://dx.doi.org/10.1080/00218469509342403
- Zatsepin, A.F., Fitting, H.-J., Kortov, V.S., Pustovarov, V.A., Schmidt, B. and Buntov, E.A. (2009) Photosensitive Defects in Silica Layers Implanted with Germanium Ions. Journal of Non-Crystalline Solids, 355, 61-67. http://dx.doi.org/10.1016/j.jnoncrysol.2008.08.025
- Parker, B.M. and Waghorne, R.M. (1991) Testing Epoxy Composite Surfaces for Bondability. Surface and Interface Analysis, 17, 471-476. http://dx.doi.org/10.1002/sia.740170710
- Rider, A.N. (2006) Prebond Inspection Techniques to Improve the Quality of Adhesive Bonding Surface Treatments.
- Schlanger, S. and Epstein, G. (1991) Optically Stimulated Electron Emission (OSEE): A Non-Invasive Technique for Contamination Detection. In: Thompson, D.O. and Chimenti, D.E., Eds., Review of Progress in Quantitative Nondestructive Evaluation, 589-595.
- Hindin, B. and Ventresca, C. (1994) Metal-Detergent/Cleaner Compatibility.
- Davis, J.R. (2000) Understanding the Corrosion Behavior of Aluminum. In: Davis, J.R., Ed., Corrosion of Aluminum and Aluminum Alloys, ASM International, Materials Park, 26-44.
- Kohli, R. and Mittal, K.L. (2013) Developments in Surface Contamination and Cleaning: Fundamentals and Applied Aspects. Elsevier, Amsterdam.
- Kwok, D.Y. and Neumann, A.W. (1999) Contact Angle Measurement and Contact Angle Interpretation. Advances in Colloid and Interface Science, 81, 167-249. http://dx.doi.org/10.1016/S0001-8686(98)00087-6
- Islam, M.S., Tong, L. and Falzon, P.J. (2014) Influence of Metal Surface Preparation on Its Surface Profile, Contact Angle, Surface Energy and Adhesion with Glass Fibre Prepreg. International Journal of Adhesion and Adhesives, 51, 32-41. http://dx.doi.org/10.1016/j.ijadhadh.2014.02.006
- Ruiz-Cabello, F.J., Rodríguez, M.A. and Cabrerizo-Vílchez, M.A. (2014) Equilibrium Contact Angle or the Most-Stable Contact Angle? Advances in Colloid and Interface Science, 206, 320-327. http://dx.doi.org/10.1016/j.cis.2013.09.003
- Zografi, G. and Johnson, B.A. (1984) Effects of Surface Roughness on Advancing and Receding Contact Angles. International Journal of Pharmaceutics, 22, 159-176. http://dx.doi.org/10.1016/0378-5173(84)90019-X
- Goddard, J.M. and Hotchkiss, J.H. (2007) Polymer Surface Modification for the Attachment of Bioactive Compounds. Progress in Polymer Science, 32, 698-725. http://dx.doi.org/10.1016/j.progpolymsci.2007.04.002
- Rahimi, M., Fojan, P., Gurevich, L. and Afshari, A. (2014) Effects of Aluminium Surface Morphology and Chemical Modification on Wettability. Applied Surface Science, 296, 124-132. http://dx.doi.org/10.1016/j.apsusc.2014.01.059
- Wilken, R., Markus, S., Amkreutz, M., Tornow, C., Seiler, A., Dieckhoff, S. and Meyer, U. (2008) Method and Device for Testing a Surface Quality. EP1893974 B1.
- Extended Non-Destructive Testing of Composite Bonds (ENCOMB) (2012) 1st Periodic Report (Grant Agreement No. 266226). Saarbrücken, 4-46.
- Hoffmann, M., Stübing, D., Brune, K., Dieckhoff, S. and Markus, S. (2013) Quality Assurance Concepts for Adhesive Bonding of Aircraft Composite Structures by Extended NDT. 3rd International Conference of Engineering against Failure (ICEAF III), Kos, 26-28 June 2013.
- Tornow, C., Brune, K., Schlag, M., Hoffmann, M., Stübing, D. and Dieckhoff, S. (2014) Quality Assurance Concepts for Adhesive Bonding of Composite Aircraft Structures: Characterisation of Adherend Surfaces by Extended NDT. 10th European Adhesion Conference (EURADH 2014), Alicante, 22-25 April 2014.
- Straetmans High TAC GmbH Additive G50. http://hightac.de/g50/InfoAdditiveG50.pdf
- Cavalcanti, W.L., Brinkmann, A., Noeske, M., Buchbach, S., Straetmans, F. and Soltau, M. (2012) Dual-Purpose Defenders: Organic Polymers Protect Metals in both Thin Layers and Coatings. Anticorrosive Systems. European Coatings Journal, 10, 30-33.
- Brune, K., Lima, L., Noeske, M., Thiel, K., Tornow, C., Dieckhoff, S., Hoffmann, M. and Stübing, D. (2013) Pre-Bond Quality Assurance of CFRP Surfaces Using Optically Stimulated Electron Emission. 3rd International Conference of Engineering against Failure (ICEAF III), Kos, 26-28 June 2013.
- Somasundaran, P. and Fuerstenau, D.W. (1966) Mechanisms of Alkyl Sulfonate Adsorption at the Alumina-Water Interface. The Journal of Physical Chemistry, 70, 90-96. http://dx.doi.org/10.1021/j100873a014
NOTES

*Corresponding author.