Current Urban Studies
Vol.07 No.01(2019), Article ID:91552,67 pages
10.4236/cus.2019.71005
Managing the Urban Environment of Santo Domingo, the Dominican Republic
David J. Edelman
School of Planning, College of Design, Architecture, Art and Planning, University of Cincinnati, Cincinnati, OH, USA

Copyright © 2019 by author(s) and Scientific Research Publishing Inc.
This work is licensed under the Creative Commons Attribution International License (CC BY 4.0).
http://creativecommons.org/licenses/by/4.0/


Received: February 28, 2019; Accepted: March 26, 2019; Published: March 29, 2019
ABSTRACT
This article brings the contemporary thinking and practice of Urban Environmental Management (UEM) to the solution of real problems in a major city of a developing country in Latin America and the Caribbean (LAC). Such cities face more immediate problems than the developed world and have fewer resources to deal with them. The study first considers the context of the Dominican Republic and then reviews issues of poverty alleviation, industry, sewage and sanitation, water, energy, transportation and finance in Santo Domingo, the Dominican Republic. Finally, it proposes a 5-year plan to help solve the urban environmental problems of Metropolitan Santo Domingo, the largest city in the Caribbean, utilizing a real-world database and a limited budget.
Keywords:
Urban Environmental Management, Regional Planning, Developing Countries, Latin America and the Caribbean, Metropolitan Santo Domingo

1. Introduction
Urban Environmental Management has been receiving increasing attention since 1970 in both developed countries, where it has emerged as a subject of academic research and professional interest, and in developing countries where it has become increasingly an area of donor concern as well. As a field, it is more like planning or engineering rather than geography, economics or sociology; and it represents an integrated view of environmental problems at city, and increasingly, regional level. Such problems are multi-sectoral (e.g., manufacturing, services, household, etc.), multi-system (e.g., water supply, sanitation, transport, etc.), multi-level (central, regional, local and community) and multi-actor (e.g., government, NGO, CBO and private). They require solutions of enormous complexity, and those professionals who coordinate the planning, implementation and management of the process must be able to communicate with specialists from many disciplines and professions (e.g., biology, chemistry, engineering, city planning, public administration, social sciences and law) (Edelman, Schuster, & Said, 2017).
This article focuses on the practice of Urban Environmental Management (UEM) in developing countries, which face more immediate problems than the developed world and have fewer resources to cope with them. It summarizes the findings of a graduate level workshop that took place at the School of Planning, College of Design, Architecture, Art and Planning, University of Cincinnati, USA from August through December 2018. The objective of the workshop was to prepare students to work overseas in data-poor environments as professional consulting planners. Several lectures were given to set the framework of the mixed class of eleven domestic and international students to operate in seven collaborative sector-level working groups or teams (poverty alleviation, industry, sanitation, water, energy, transportation and finance) preparing a 5-year environmental plan for the Santo Domingo Metropolitan Area. Santo Domingo is the largest urban agglomeration in the Dominican Republic with 3.172 million inhabitants representing 29.6% of the country’s population of 10.734 million (CIA, 2018). The students utilized a real-world database and a limited, realistic budget.
Data were gathered on-site by the Sustainable Architecture class (Analisis del Medio Ambiente Urbano Santo Domingo) of Prof. Ico Abreu at the Pontificia Universidad Católica Madre y Maestra (PUCMM) during June and July 2018 (Abreu, 2018). Thirty students acquired data on energy, economy, formal settlements, gender, industry, informal settlements, poverty, solid waste, transport, water and working-class neighborhoods. This effort provided the initial database for the project that formed the majority of classwork culminating in the completion of a professional quality document.
2. The Dominican Republic
The Dominican Republic is located on the island of Hispaniola in the Caribbean. It occupies the eastern five-eighths of the island, which it shares with Haiti (Josh, 2016). It is the second-largest Caribbean nation by area (after Cuba) at 18,705 sq. mi., and third by population (CIA, op. cit.). The metropolitan area of Santo Domingo, the capital city, is the largest in the Caribbean (World Bank, 2019).
The Dominican Republic has the ninth-largest economy in Latin America and is the largest economy in the Caribbean and Central American region (CIA, op. cit.). Over the last two decades, the Dominican Republic has had one of the fastest-growing economies in the Americas with an average real GDP growth rate of 5.4% between 1992 and 2014 (World Bank, op. cit.). GDP growth in 2014 and 2015 reached 7.3% and 7.0%, respectively, the highest in the Western Hemisphere (Ibid.). In the first half of 2016, the Dominican economy grew 7.4% continuing its trend of rapid economic growth (Ibid.). Recent growth has been driven by construction, manufacturing, tourism, and mining (the country is the site of the second largest gold mine in the world). Private consumption has been strong due to low inflation (under 1% on average in 2015) and job creation, as well as a high level of remittances (UNESA, 2017).
The country is the most visited destination in the Caribbean with year-round golf courses, geographic diversity, warm temperatures and historic significance. Music and sport are of great importance in the Dominican culture, with Merengue and Bachata as the national dance and music, and baseball as the favorite sport. The large number of Dominican players in Major League Baseball is a point of national pride.
3. Santo Domingo
Santo Domingo is the capital of the country. Located on the southeast coast of the island of Hispaniola, at the mouth of the Ozama River, it is the oldest permanent city established by Europeans in the Western Hemisphere. The city is also the seat of the oldest Roman Catholic archbishopric in the Americas. The city was founded in 1496 by Bartholomew Columbus, brother of Christopher Columbus, as the capital of the first Spanish colony in the New World. The colony prospered as the seat of government of the Spanish possessions in the Americas until the conquest of Mexico and Peru, after which its importance declined. In 1586, Sir Francis Drake, the English buccaneer, sacked the city, but in 1655, its inhabitants defeated a British force that had been sent to seize it. From 1795 to 1809, Santo Domingo was under French domination, and, after another brief Spanish period, as noted above, it was conquered by Haiti. After independence in 1844, Santo Domingo became the capital of the new Dominican Republic until the republic’s annexation to Spain in 1861, and it has been the Dominican capital since the restoration of independence in 1865 (Britannica, 2019).
Santo Domingo is the industrial, commercial, and financial center of the country. Its industrial development has been greatly influenced by the construction of hydroelectric dams, which furnish its industries with inexpensive electrical power. The country’s most important industries―such as metallurgy; the manufacture of refrigerators, petrochemicals and plastics, cement, and textiles; and food processing―are located in Santo Domingo. The importance of services, including tourism, to the city’s economy has grown since the late 20th century (CIA, op. cit.). The city is also the chief seaport of the Dominican Republic.
Santo Domingo claims the oldest university in the Western Hemisphere: the Autonomous University of Santo Domingo (founded 1538). Among the noted cultural institutions is the Museum of Dominican Man―important for its pre-Columbian collection, and the two most prominent colonial monuments in Santo Domingo are the cathedral and the palace of Diego Columbus. The cathedral, in Spanish Renaissance style, was built between 1514 and 1542. The restored and expanded Plaza de España was the first European commercial center in the Americas, and it is still a hub of activity today. The Zona Colonial, the historic district of the city, was designated a UNESCO World Heritage site in 1990 (Brittanica, op. cit.) (Figure 1).
Santo Domingo, then, is one of the most important cities in the Western Hemisphere, historically, culturally and economically, and it provides a case study of how to manage the urban environment in the major urban centers of Latin America and the Caribbean. The discussion begins with poverty alleviation.
4. Poverty Alleviation Sector
4.1. Problem Statement
Poverty alleviation is the first of the sectors specified in the introduction to this paper to be discussed in turn. According to the World Bank, while the Dominican Republic has had one of the fastest growing economies in the region, it continually spends less on public services and programs compared to other Latin American and Caribbean (LAC) countries (World Bank LAC, 2016). The outcome has been one of increasing economic inequality. As Santo Domingo’s population density has increased, poorer inhabitants have created housing in hazardous areas, often near rivers and tributaries, sometimes residing directly within a floodplain. Given the country’s unique vulnerability to climate change as an island nation, serious precautionary measures need to be implemented in order to strengthen resilience to extreme weather events such as hurricanes.

Figure 1. Cathedral of Santa Maria la Menor 1514. Age Fotostock, 2019, Cathedral of Santa Maria la Menor 1514, UNESCO World Heritage Site.
In the past, the government has not adequately funded social programs and domestic infrastructure, resulting in the city of Santo Domingo having social and economic deficits among its citizenry. While the entire city experiences problems with the reliability and accessibility to potable water and electricity, those living in poverty suffer further because of geographic isolation. Santo Domingo must alleviate poverty by improving informal settlements through increasing their connectivity with neighboring communities, expanding access to public amenities like waste and sanitation, water and electricity, along with rehabilitating and/or rebuilding structures that lie within environmentally hazardous areas, or structurally create a hazard to the urban landscape. If the Dominican Republic does not take preparatory measures to avoid damage caused by climate change via immediate poverty alleviation initiatives, the city will continue to risk the well-being of the city’s citizenry and urban environment.
4.2. Low-Income Housing Projects
4.2.1. ELEMENTAL Model
For the implementation of upgraded housing, it is proposed to use the ideas of the 2016 Pritzker Prize winning architect Alejandro Aravena. His practice, ELEMENTAL, designed and constructed low income housing that encourages social development while fighting the cycle of poverty in places such as Iquique, Chile and Monterrey, Mexico (Quinta Monroy/ELEMENTAL, 2008). The former is the example that will be replicated in the impoverished neighborhoods in Santo Domingo. With a cost per unit of around $7500 USD, the compact housing would be built of concrete and cement bricks. They would be “half-finished” in that the units would be constructed with open space between each so the eventual owners would have the opportunity to add to their homes as needed. This provides the potential for the occupants to make their living space larger or create space to rent out. It is further proposed that the existing National Housing Institute (INVI) be employed to create, administer and track affordable housing loans for the ELEMENTAL Housing Program in Santo Domingo.
4.2.2. ELEMENTAL Housing Program
The ELEMENTAL Housing Program would build 1922 ELEMENTAL units throughout Santo Domingo over a 5-year period. As noted above, the architectural concept behind the ELEMENTAL models is incremental growth. The structures’ ability to absorb growth would provide the program with a built-in financial safety net. Past INVI low-income mortgage loans have experienced greater rates of default than middle-income loans (Angel, 2001). However, ELEMENTAL’s design would allow for borrowers to rent out the available space and turn a profit from their investment. This would increase the likelihood that borrowers would repay their loans, decreasing INVI’s overall risk. ELEMENTAL homes should replace homes that either lie within an environmental hazard area, are structurally unsound and, therefore, unsafe, or address a housing shortage. When replacing homes located in environmentally hazardous areas, the new ELEMENTAL homes should never be constructed in the same place. While the goal of the program is to keep communities intact through minimal disruptions of the social landscape, there are likely to be unfortunate instances when occupants are forced to relocate. The priority would be to relocate them within the same community. After five years, the ELEMENTAL Housing Program would have constructed all 1922 new homes. The ideal occupant for the program would have an income of at least the general poverty level of $90 USD per month, and an INVI subsidy would ensure that ELEMENTAL home mortgages are affordable for Santo Domingo’s underprivileged (Figure 2).
4.2.3. UN-Habitat Participatory Slum Upgrading Program
In addition to providing new residences through the ELEMENTAL program, it is further proposed that Santo Domingo collaborate with the United Nations Habitat Participatory Slum Upgrading Program (PSUP). UN PSUP approaches slum upgrading with the goal of integrating residents into the “broader urban fabric” (UN-Habitat, 2013) . The UN PSUP focuses on destigmatizing informal settlements by using city and community planning methods to engage the residents and bring them into the planning process. The UN PSUP’s emphasis on using local government as a partner is a contributing factor for recommending that the Dominican Government become a participant in the program.
4.2.4. UN-Habitat Santo Domingo Proposal
There are many similar challenges facing informal settlements within Santo Domingo. Most are located on water, increasing the risk of flooding and disease. They lack access to public amenities and services like ambulances, police,

Figure 2. ELEMENTAL Models. Source: https://www.archdaily.com/10775/quinta-monroy-elemental.
electricity and water, making their lives and the toll they take on the urban environment worse. Despite the plight of urban poverty, they have resilient residents who have found resolve and strength in community. Ultimately, improving the living conditions of an entire community is the most effective method for lifting individuals out of poverty. The proposed UN PSUP Santo Domingo Program would affect 50,000 slum dwellers in the 5-year length of the environmental plan for Santo Domingo (Figure 3).
The UN PSUP would emphasize increased access to public services and amenities, along with improving neighborhood accessibility through widening narrow streets and building access roads when necessary. The UN PSUP would work in collaboration with the ELEMENTAL Housing Program. It is recommended that both programs work together in future informal settlements in order to provide communities with greater options for improvement. When homes need to be demolished, the UN PSUP can assist, and the ELEMENTAL Housing Program can build the new home. More importantly, the two programs both prioritize connecting residents to public amenities like electricity, water and sewage. Therefore, new ELEMENTAL homes should always be connected to pre-existing infrastructure.
Finally, the first four years of the program in Santo Domingo should be funded by the current development aid agreement between the Dominican Republic and the United Nations. This Framework of Assistance from the United Nations for Development is for $188 Million USD between 2018 and 2022 (MANUD, 2017). However, the funding is only through 2022, meaning the final year would not be covered by the UN. Therefore, the final, fifth year budget decreases drastically.
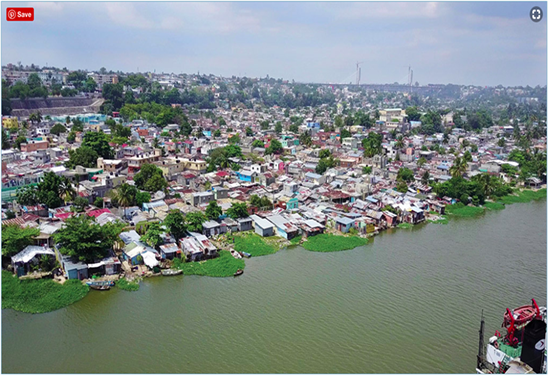
Figure 3. Informal Settlements in the La Cienaga Neighborhood of Domingo Savio. Source: https://arquitexto.com/2018/05/nuevo-domingo-savio/.
4.3. Summary
Poverty in Santo Domingo persistently wears on the city’s urban environment. Geographic isolation from the city’s public services compounds the detriment that sanitary issues like sewage and waste cause the city. Santo Domingo’s expansive river system quickly carries trash, pollution and germs from one end of the city to another, while building structures close to rivers damages the natural ecosystem, and places residents in danger of environmental hazards like flooding.
Santo Domingo faces complex housing issues that are at the heart of poverty in the city. Informal settlements are often comprised of unsound structures that provide immense risk to the urban environment, especially in the wake of increased extreme weather. As a Small Island Developing State (SIDS), the Dominican Republic is especially prone to be affected negatively by climate change. Given the city’s old and failing infrastructure, immediate action is required to address the city’s unique vulnerability to future catastrophes. Fortunately, the Dominican Republic’s economy is one of the strongest in the Latin American and Caribbean region, and, therefore, it can afford to allocate funds to begin the process. The Dominican Republic must administer the ELEMENTAL Housing Program alongside the United Nations Habitation Participatory Slum Upgrading Program Santo Domingo as part of the city’s 5-year Poverty Alleviation Program in order to increase its resilience and improve its urban environment.
5. Water Sector
5.1. Background
Water is relatively abundant in the Dominican Republic due to the country’s tropical climate. Hot temperatures along with trade winds lead to high humidity and frequent rainfall. Despite plenty of precipitation, the nation and city of Santo Domingo struggle to manage water as a resource once it reaches the ground. Municipal water is sourced from two rivers, the Nizao and Haina, located northwest of the city. Water from these sources is processed at two water treatment facilities, which are operated by Santo Domingo’s public water corporation: Corporación del Acueducto y Alcantarillado de Santo Domingo (CAASD). As a result of sedimentation from agricultural run-off, these water sources are losing capacity at a steady pace each year. Sedimentation is also placing added pressure on the water treatment plants, which may lead to costly maintenance in future years.
Despite this capacity issue, both treatment plants consistently generate clean drinking water, which is distributed to residents by an extensive and accessible infrastructure network. In fact, roughly 83% of households are connected to a private tap, either inside the house or in the backyard (Abreu et al., op. cit.). The main problem is that the water is contaminated regularly while traveling through the distribution system. Many pipes are compromised due to age, and there are numerous leaks, which are difficult to locate throughout the network. When there are disruptions in the flow of water, contaminates from the surrounding groundwater can leach into the pipes, making the water unsafe to drink. For this reason, nearly all residents do not drink the tap water at any time in order to avoid sickness.
Groundwater pollution in Santo Domingo results from the lack of wastewater treatment and improper disposal of solid waste. Since the city does not currently have a wastewater treatment plant, raw sewage, along with solid waste, flows directly into the rivers that run through the city, namely the Ozama and Isabela. In addition, leaks in the sewer infrastructure system also lead to further contamination of groundwater.
While it is common for residents to bathe and cook with tap water, most people buy bottled water in large multi-gallon plastic jugs for household drinking. These jugs are refillable and commonly reused. However, residents consume large qualities of small portable plastic water bottles that are not recycled and add to solid waste. In the long-run, it will be more sustainable for city residents to drink directly from the tap, in turn depending less on plastic bottled water. In order to ensure safe and drinkable tap water, the city must investigate and mend contamination sources within the infrastructure system.
5.2. Problem Statement
Despite Santo Domingo having abundant water resources and capable treatment plants, the city cannot provide clean water to its residents through its distribution network. Agriculture outside the city and poor waste treatment within the city threaten the sources of water. After analyzing these and other issues, the water team, who are the authors of this chapter, identified two main issues regarding Santo Domingo’s water supply: reservoir capacity loss and water contamination.
5.2.1. Capacity Loss
Santo Domingo draws over 60% of its water from two major rivers in the country: the Haina River (20%) and the Nizao River (40%) (Santo Domingo Water Fund, 2017) . The city averages 1000 mm of rain each year, feeding the rivers and providing an abundant water source (World Weather and Climate Information, 2018). As a result of deforestation and agriculture expansion along the banks of the Haina and Nizao, the rivers are suffering from sedimentation and eutrophication. Therefore, the reservoirs they supply are quickly losing capacity. Without riparian vegetation to prevent erosion, sediments are entering the water, flowing downstream and into the Valdesia Reservoir (of the Nizao River) and Haina treatment plants. After the water is treated and piped out of the Valdesia Reservoir, the sediment remains, and its accumulation leads to large-scale capacity loss. From 1981 to 1991, Valdesia Reservoir capacity was reduced by 26.1% due to sedimentation (USAID, 2001) . Agricultural runoff along the banks also leads to eutrophication of the rivers and further capacity loss. The reduction of reservoir capacity is a long-term problem for Santo Domingo, and the Dominican Republic, that could threaten the water supply for the millions of residents depending on it.
5.2.2. Contamination of Water
Over 32% of Santo Domingo’s water comes from groundwater sources (Nature Conservancy, 2018) . Unfortunately, 70% of wastewater in the city is discharged into those aquifers without any treatment, leading to contamination on a massive scale. While the water that is pumped out of the aquifers is processed by treatment plants, groundwater contamination remains a significant problem for the quality of water leaving the plants.
Santo Domingo’s water treatment plants, the Haina-Manoguayabo and Valdesia, are more than capable of treating the drinking water. When the water leaves the treatment plants, it is consistently safe for human consumption (CAASD, 2018). However, by the time it reaches a household, it is often too contaminated to be consumed. As a result, the population of Santo Domingo must rely on bottled water for drinking and some cooking, in turn only using tap water for non-consumption activities. The reason that the water is unclean by the time that it reaches a residence is that there are leaks in the pipe infrastructure along the way. When water pressure is high in the pipes, the water quality is not compromised because water is forced out through the leaks and the contaminants cannot enter. Unfortunately, when the water flow is low, the water pressure drops, allowing contaminants to seep in through the breaks (University of Sheffield, 2015). Santo Domingo’s energy grid is thought to be a major contributor to this problem. When power is lost, pressure drops, contaminants from the groundwater enter the pipes, and the contaminated water flows on through the rest of the distribution network (Figure 4).

Figure 4. Haina water treatment plant. Source: Abreu, Ico et al. “Analisis del Medio Ambiente Urbana Santo Domingo”, PUCMM, 2018.
Lead pipes are also a potential cause of contamination. Older buildings are likely to have lead piping, and, therefore, water can become contaminated after it leaves the municipal network and enters into those systems. The unanswered question surrounding this issue is: when and where in the system is water becoming contaminated? If that question were to be answered, infrastructure could be strategically repaired, and Santo Domingo’s residents would have consistent access to clean, safe drinking water.
5.3. Priorities
Based on the water contamination challenges facing Santo Domingo, the water team has developed a goal that it believes is both appropriate and realistic for the city at this time. The goal is to ensure that tap water is clean and drinkable for all residents of Santo Domingo, leading to less dependence on plastic bottled water. In order to achieve this goal, the team has outlined the following three priorities: equitable access, altered perception and sustainable practice.
5.3.1. Equitable Access
To the team’s knowledge, there is currently no inequity in the delivery of tap water, as households of all income levels avoid drinking the water due to real or perceived health risks. Impoverished households consistently choose to buy bottled water, even during times of financial burden. In other words, poor residents generally cut other expenses before they stop consuming bottled water. As the city takes steps to ensure safe drinking water, it is important that residents of all income levels receive the same quality of service. The water team believes that the city should prioritize infrastructure repairs in low-income neighborhoods for two reasons. One, less dependence on bottled water would lighten the cost burden for low-income households. Two, some poor residents receive their water from common pubic taps. By ensuring quality at one tap, dozens of families can have access to clean drinking water.
5.3.2. Altered Perception
Even if Santo Domingo succeeds in providing safe tap water, perception of the water must be changed in order to truly alter behavior. In the United States where municipal tap water is clean and safe to drink, there often still exists a perception that tap water is unsafe and therefore bottled water is consumed instead. It is vital for the city of Santo Domingo to address perception issues directly. This would likely include a public outreach campaign that educates residents on the true quality of their tap water. Beyond deconstructing the perception of dirty tap water, people may still prefer bottled water due to convenience and relatively low cost. Changing consumer behavior away from dependence on bottled water would first require education about plastic waste. Due to problems with solid waste collection, much plastic waste flows directly into the city’s rivers and ocean coast, which harms and degrades local ecosystems. The impact of plastic waste is discussed further in a later section on solid waste.
5.4. Proposed Project and Justification
In order to achieve the goal of providing clean tap water to all residents of Santo Domingo, the team proposes the following two-pronged project. First, household level water testing would engage and educate residents about water quality. Second, testing results would inform strategic infrastructure repairs, which are needed to solve Santo Domingo's water contamination challenges.
5.4.1. Household Water Testing and Community Engagement
To determine where and when water is being contaminated within the distribution network, the water team proposes a household level testing program in conjunction with a public community engagement campaign to educate residents on why their water is unsafe and the advantages of using municipal water.
The water is known to be safe when it is discharged from the treatment plants, which means that it is being contaminated en route to homes. However, there has never been water quality testing done at the household tap level, so it is unclear which areas experience high levels of contamination, when these incidents occur, and exactly what type of contaminants exists. This project would provide the city with large amounts of data regarding water quality throughout the Santo Domingo region. This data could then be analyzed to determine where pipe compromises and leaks exist. CAASD can then make informed decisions on which sections of infrastructure should have priority when it comes to repairs. Because water in Santo Domingo has been unsafe for so long, there is a concern that even if the water were to be clean, the public would still not drink it due to misperceptions. This project seeks to alter those perceptions by allowing residents to take part in the testing process. After infrastructure repairs have been made, residents could then be confident in quality of tap water.
It is proposed to partner with a non-governmental organization (NGO) that has the capability to manage a project of this size, such as Mujeresen Desarrollo Dominicana (Women for Dominican Development), an NGO based in Santo Domingo. The water team selected this NGO as a potential partner due to its base in the city and its programming focused on local infrastructure, water, hygiene and environmental sanitation. The selected NGO would be responsible for managing the testing kit distribution and data collection as well as the public outreach campaign.
The process of the household testing program would unfold in a series of three phases, each lasting approximately two months. The first phase would take place in low-income neighborhoods, the second phase in middle-income neighborhoods, and the third in high-income neighborhoods. The classification of these categories would be left to the discretion of the NGO. It is proposed to begin with low-income neighborhoods because they would benefit most from infrastructure repairs. In the low-income neighborhoods of Santo Domingo, a greater proportion of households do not have private, indoor water access. Many rely on common, public taps in the neighborhood. By prioritizing infrastructure repairs in neighborhoods in which many rely on a public tap, repairs could impact more people. This population also comprises those who would benefit most from safe municipal drinking water, as the cost of bottled water would be removed.
To ensure consistent, reliable testing of the water, the water team proposes distributing the testing kits through primary schools, grades 7 and 8 (children ages 12 to 14) and having the water testing be part of the science curriculum for that year. In this way, testing would be conducted regularly while also engaging youth in the investigation of the city’s water issues.
For household testing, the water team recommends the WaterSafe Bacteria Test Kit, which tests for coliform bacteria (https://thirstforwater.com/, 2019). Each kit includes simple vials, which are filled with tap water, and then left to sit for 48 hours. If the water turns yellow, it is contaminated and unsafe to consume. If the water turns purple, it is free of bacteria and safe to drink. Because the testing kits take 48 hours to return results, it is proposed to collect samples 3 days per week. Students, residents and business owners participating in the testing program would report the results through an easy-to-use website/app developed by the NGO. The participant would enter the following information after each test: the date the sample was taken, the address where the sample was taken, and the result of the test (safe or unsafe). The NGO would manage the back-end collection of the results data, and, once the testing program is completed, it would pass on the data to CAASD for analysis.
5.4.2. Municipal Infrastructure Improvements
1) Data Analysis
The results of the household water testing would help to inform infrastructure improvements completed by the municipal water authority, Corporación del Acueducto y Alcantarillado de Santo Domingo (CAASD). The testing results would help CAASD understand where tap water is clean and unclean, and if any trends exist among neighborhoods. For example, if one neighborhood indicates clean results and another reveals all unclean results, then it is likely that there exists a compromise in the pipe infrastructure leading to the latter neighborhood. On the other hand, it is important to note that unclean results may be due to degraded internal pipes within the home. In order to distinguish between the cause of contamination (municipal pipes vs. internal home plumbing), the water team recommends that CAASD conduct comprehensive scientific testing at check valves along the municipal infrastructure system. By comparing testing data between households and the infrastructure system, it would be easier to pinpoint the exact sites where contamination occurs. CAASD can then plan to complete infrastructure repairs at points where unclean testing results were reported. It is also understood that household test results may not be reliable, due to potential user error. Therefore, it is even more important for CAASD to complete supplementary scientific testing.
2) Public Reporting
After CAASD has finished its analysis, it is vital for information to be shared openly with the public. The final report should include a presentation of testing results in addition to plans for the location of proposed municipal infrastructure improvements. It is also recommended that the report be completed in partnership by both CAASD and the NGO. The water authority would provide the technical results and explanation, while the NGO would specialize in sharing information with the public in a friendly, accessible manner. Transparency with the public would be an important first step in building trust between Santo Domingo’s residents and CAASD. Residents who trust the public water provider are more likely to alter their perception and behavior regarding drinking water.
3) Infrastructure Improvements―Pilot Projects
In order to prioritize equity, initial infrastructure improvements would be targeted at three neighborhoods, Villa Francisca (low income), Domingo Savio (low income) and Gazcue (middle income). As mentioned previously, low-income residents face the greatest cost burden when comparing the price of tap and bottled water. If infrastructure improvements lead to tap water that is consistently safe, then these residents can shift to drinking low-cost and sustainable tap water.
The water team selected the neighborhoods of Villa Francisca and Domingo Savio because a large portion of municipal water is delivered through public taps, either at street tubs or public keys. In Villa Francisca, 31% of residents get their water from public taps, while in Domingo Savio, 16% of residents use public taps (Abreu, op. cit.). The plan is to target repairs at municipal water mains that deliver water to these public access taps. By ensuring water quality at these public sources, a large portion of low-income residents can gain access to clean water. In some respects, this process is much easier than ensuring clean water for homes with interior taps, because interior pipes may be the source of contamination.
For the middle-class neighborhood of Gazcue, most homes (94%) have interior water taps (Ibid.). The location of infrastructure repairs would be determined by the data analysis from testing. Infrastructure repairs in Gazcue would be completed in conjunction with sidewalk and power line projects. In order to bury the power lines, the street and sidewalk networks would already be under construction. This would allow CAASD to inspect conveniently and repair the water infrastructure network. Both projects are discussed further in the transportation and energy sections, respectively, later in this paper. It is important to note that even after the city has ensured clean water, water might still be contaminated by interior pipes. It would then be on the property owner to investigate the repairs needed.
5.4.3. Capital Costs
1) Household Water Testing and Community Engagement
The costs of the household water testing and community engagement program are summarized in Table 1 below.
2) Infrastructure Repairs
The 5-year plan outlined by the water team includes infrastructure repairs in three Santo Domingo neighborhoods. It is assumed that as faulty mains are identified and funds are available, infrastructure repairs would continue throughout the city. These costs are already covered through CAASD’s annual maintenance budget, and it is assumed they would continue to be covered in subsequent years. The proposed project would aid CAASD in identifying areas in which to prioritize pipe repairs. The proposed schedule for the repairs is summarized in Table 2.
5.4.4. Summary
Santo Domingo faces many problems regarding water contamination, both at the source and throughout the infrastructure system. Agricultural sedimentation

Table 1. Capital cost breakdown of household water testing and community engagement program (in USD).
Source: Prepared by Christian Umbach and Casey White, 2019.
Table 2. Project implementation schedule.
Source: Prepared by Christian Umbach and Casey White, 2019.
is causing capacity loss at the upstream river sources. In addition, compromises throughout the infrastructure system lead to inconsistent water quality at household taps. Due to these inconsistencies, the tap water is perceived to be unsafe, and most residents do not drink the water. Since there has never been testing conducted at the household level, the true quality of tap water is still unknown. The project that has been proposed here seeks to demystify the quality of tap water by engaging the community in conducting household water quality testing. The results of these tests would inform public infrastructure projects aimed at limiting contamination sites. Infrastructure repair projects would be directed to serve low-income communities, which would benefit the most from more affordable water. Once water quality is consistently safe, the public outreach campaign would work to alter public perception regarding tap water and transition away from unsustainable bottled water consumption. As residents consume more municipal water, CAASD would be able to deliver more consistent water quality. Public reliance on tap water would inevitability lead to increased awareness and concern for the city’s sources of water. Public understanding and investment would be crucial in addressing the long-term issue of water source capacity. This positive feedback loop would ensure that sustainable water practices are adopted throughout Santo Domingo into the distant future.
6. Solid Waste Sector
6.1. Background and Current Situation
Despite the scenic beauty and rich urban fabric present in Santo Domingo, the city faces an alarming array of environmental issues due to improper disposal of solid waste or garbage. One may say the tidal wave of garbage on the beach of Santo Domingo in Figure 8 was a result of the cyclic return of nature; the inevitable cost for dumping all waste directly into the sea. Due in large part to the garbage that was dumped in the Ozama River by informal settlements, this situation highlights the waste disposal problem faced by the city (Karasz, 2018). It is also noteworthy that as the capital of Dominican Republic, Santo Domingo houses about 30% of the country’s population and has one of the major commercial and tourism industries in the Latin American region, so this problem affects a huge portion of the population.
In a city with population of 3 million, waste generation is a continuous process, and its disposal is one of the key concerns of the city. Along with its resident population, the city also hosts a tourist population of 2.5 million every year. On average, each person produces about 1.26 kg of waste per day. One of the key insights from this number is that the waste generated is nearly twice that of many other developing countries, like India, which in its urban areas produces about 0.6 kg of waste per person per day. Due to this massive generation of waste per capita, on average, the city produces a volume of 3797 metric tons of garbage per day (Hoy Digital, 2017) (Figure 5).

Figure 5. Solid waste on the beach. Source: Karasz. “Wave After Wave of Garbage Hits the Dominican Republic,” New York Times, 2018.
In addition, the composition of the generated waste is also highly inorganic (see Figure 6), which complicates disposal as this waste cannot be decomposed, and other methods must be used for disposal. In 2006, about 50% of the total waste generated was inorganic and the other 50% was organic in nature. This was about 10% higher than other developing countries like India where about 60% of the waste produced is organic (Kokusai Kogyo, op. cit.). Currently, however, as noted above, this situation has worsened, and the composition of waste is even more inorganic.
The high percentage of non-biodegradable waste is due to high consumer dependency on supermarkets. Supermarkets, as opposed to local wet markets, utilize an abundance of plastic in items such as packaging and plastic bags, which are not biodegradable. With further scrutiny of the waste profile of Santo Domingo, it is glaringly apparent that with proper segregation, only about 18% of the total waste collected would not be recyclable or biodegradable. The lack of garbage separation can also be a result of a lack of awareness of consumers and poor initiative on the part of the government.
The collection of garbage from the city is currently a process, which is carried out by a collaboration of government entities and private entrepreneurs, where private companies are chosen by the government to collect the waste on a district basis by means of a tendered auction (Páez, 2018).
The generated waste from households is put in plastic bags and is left in front of houses on the road where the garbage collection trucks come and take the garbage to the landfill. Collected by the trucks, which have designated routes, a specific schedule is to be followed. Due to inconsistencies in the collection of garbage, the bags are prone to be torn apart by street dogs, particularly when they are sitting out for a long time. The garbage is collected from the different

Figure 6. Average Waste generation profile in Santo Domingo. Source: Prepared by Jyutika Bhise and Melat Musie, 2019.
districts without any specific collection rules. The garbage scattered on the roads is collected by the garbage men manually without wearing any specific safety gear for handling of waste. This is a major issue as the people involved in garbage collection are unknowingly exposed to a lot of harmful chemicals and diseases. Furthermore, there is no clear demarcation for the collection of waste spatially, and, thus, many areas are not properly serviced.
Servicing of informal settlements is even more difficult due to several geographical factors. Most of them are located on steep slopes and have no serviceable roads. The informal settlements of La Yuca are an example of insufficient service due to the lack of accessibility, which causes massive pileups in the areas (Mejía, 2016). This leads to the disposal of garbage in the Ozama River causing a continuing and toxic presence of large amounts of plastics and other kinds of hazardous waste in the ocean. This improper and inefficient handling was one of the major causes for the waste tidal wave on the beach of Santo Domingo mentioned earlier (Karasz, op. cit.). Most of the servicing of the informal settlements is through private entities, the majority of which are nonprofits, which have employees who navigate the settlements by foot and collect the garbage by hand.
The garbage collection for commercial and industrial properties is through entry to the property. Large stockpiles of waste are collected using manual lifting rather than mechanical lifting. The hospitals in the region also do not follow any specific method of disposing of their biomedical waste, and, thus, the collectors and disposers are placed at severe risk of contracting infections and being exposed to dangerous biohazards. Although the operators have signed contracts with the government, they do not specify the standards of cleanliness nor denote a clear delineation of their jurisdiction.
The waste thus collected from the community is then transported to the Duquesa Landfill, north of the city. At the landfill, the office records the vehicle number and the number of times the vehicle has entered the landfill along with the in and out time. This information is further used for the payment of the contractors. About 102 compactor trucks serve about 74% of the area. According to statistics, the number of people served by vehicles is approximately 33%, one of the critical assumptions being that 100% of the people are served in the area (Kokusai Kogyo, op. cit.).
The landfill at Duquesa is the only one serving the region and is about 123 hectares (Dominican Today, 2015). One of the major issues of the landfill is that it has reached about 70% of its capacity and can service Santo Domingo for only four more years beyond 2018. This is one of the main reasons that management of solid waste is a key concern of the project that is proposed in this section.
Once the garbage collected reaches the landfill, a miniscule proportion of it goes through recycling by manual processes. This is one of the most serious problems regarding solid waste as a maximum amount of each load dump is disposed of directly, and the manual recycling process does not follow any safety procedures for the recyclers. Furthermore, the landfill is not sanitized and thus causes a lot of air, water and soil pollution as it discharges directly into the environment. The landfill is also highly prone to methane fires. This overall condition makes the landfill highly unsustainable and hazardous for the environment (Díaz, 2017).
6.2. Projects
6.2.1. Landfill
At the heart of the solid waste management issue, lies Santo Domingo’s mismanagement of its landfill. The city is serviced primarily by the notorious Duquesa Landfill, which is the endpoint for 79% of the waste generated by Greater Santo Domingo. According to Diario Libre (2014), the Dominican news agency, the facility is plagued by frequent fires, lack of regulations and employee safety due to hazardous exposure.
The landfill is currently managed by the local government; however, it contracts with numerous private businesses. Due to the nature of the private-public arrangement for garbage collection, individual waste management companies come to drop their loads at the landfill, and there is little oversight mitigating the trash that ends up entering; i.e., it is unclear if any load is toxic or not. Over the years, friction within the partnership has caused regulatory policies to fall by the wayside (Figure 7).
One indication that solid waste management is not seen as a major priority for the leadership of Santo Domingo is evident from the very low tax that is implemented per ton. It is a common practice elsewhere to charge citizens in the area by the amount of actual solid waste that is being received, and these taxes go to maintenance and other functions of the landfill. Higher prices can also have the
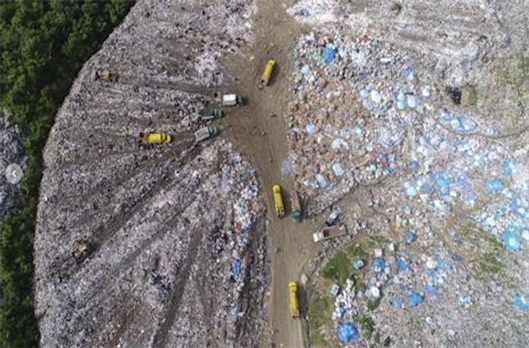
Figure 7. The Duquesa landfill. Source: Cunidad, n.d.
benefit of dissuading residents and businesses from mindlessly tossing things away; many items sent to landfills can often be recycled, reused or composted. The average tax per ton in other counties, such as the US, is about $16 USD per ton while Santo Domingo’s average cost per ton is a meager $1.95 USD, which happens to be the lowest in the entire Dominican Republic. This tax is basically fixed across Santo Domingo, but it has slight variations between municipalities. The municipalities tax the residents for the tons of waste incurred; this tax goes to the local government and, from there, the government pays the local contractors. Because it is so low, contractors in recent years have become frustrated for lack of income. The total cost it takes to process each individual ton of waste in the Dominican Republic is between $17 USD and $24 USD (Hoy Digital, op. cit.). Even the garbage collection businesses have been pressuring Santo Domingo to raise the tax; having efficiently running facilities makes the solid waste management process easier for all parties involved (Rosa, 2018).
In addition, inadequate regulations are not limited to environmental conditions, but include the social and physical level as well. Employees who assist with receiving the waste at the landfill facility are not provided with adequate equipment to protect them from potential toxic hazards that might pass through them. Additionally, as a result of the waste not being sorted, the build-up of organic materials within the landfill increases the production of flammable gases such as methane and carbon dioxide. This creates a work environment in which fires become a very possible threat, despite being preventable. Lastly, overall, the initial construction of the landfill had no environmental mitigation components, such as an underground leachate liner or gas-capturing infrastructure, essentially making this high traffic landfill nothing more than an open-air dump (Hoy Digital, op. cit.). Chemicals leach out from the landfill and end up as pollutants in the soil and the Isabela River. It should be pointed out, moreover, that the lack of proper sanitary landfills is uncharacteristic of countries as developed as the Dominican Republic.
Raising the tax per ton would be the first and most important step, for investing in the facility now and down the road. An increase to at least $3.50 USD per ton within the 5-year span of this environmental plan for Santo Domingo would double the tax funds available from roughly $7500 USD a day to $1400 USD a day, assuming an average in flow of 3797 tons of solid waste per day. Eventually, in the future, this number would need to continue to grow, especially as the population of Santo Domingo grows. For example, an increase to $12 USD per ton would generate about $45,000 USD per day, and this is a realistic goal. These funds could go to investing in modifications to the Duquesa Landfill, as well as creating a safe working environment, and eventually to funding a future landfill when Duquesa becomes full.
One of the costliest aspects of fixing the Duquesa Landfill is the construction of and incorporation of the components of a sanitary landfill, such as a leachate system and a clay liner. While data are limited on the current physical state of the landfill, these measures would act as intermediary steps until either the initial waste inflow is reduced by the development of productive recycling/compost programs, or another site for a new landfill is developed. The predicted cost cumulatively for a leachate pipe system and clay liner would be $98,000 USD, although this number might fluctuate depending on the geophysical traits of the Duquesa site. Additionally, the incorporation of an environmental monitoring system is estimated to cost about $50,000 USD (EPA, 2014).
An efficient landfill system is the keystone to any solid waste management scheme, particularly in an urban environment, not only for practicality, but also for public health and for environmental and beautification purposes. Additional measures, such as recycling and incineration, take the reduction of solid waste a step further.
6.2.2. Recycling
The Dominican Republic actually did not start recycling on a large scale until the early 2000’s. The country overall has seen substantial profits from the export of their recyclable waste. In 2014, the country exported over $100 million USD of plastic waste, and some say that is only a fraction of the $600 million USD potential (DiarioLibre, op. cit.). Despite this, the city of Santo Domingo has no formal recycling program. Residents can be found searching the landfill waste and selling recyclable materials that were left in the landfill. Materials range from glass bottles that sell for $.50 USD per bag of 30 to 40, to computer monitors that sell for $1 USD each (ADN, 2018). This can be a source of profit for those of lower socioeconomic status. A formalization of this process to incentivize residents to sort and collect their recyclables in exchange for money, which is a fairly common practice in places like India, could be implemented as an intermediary step to the construction of formal recycling facilities.
Santo Domingo needs a comprehensive recycling program, and this requires the construction of processing machine facilities, as well as administrative offices, the total cost of this being around $50,000 USD (General Kinematics, 2014). It is important to consider as well that it is important to publicize these efforts and make recycling education and information available and accessible to the public. This step is also essential to cultivating a culture of environmental awareness in the area, on all levels of socioeconomic status. Just as the landfill needs to generate and maintain a set of specific and targeted guidelines for waste acceptance criteria and human safety, the recycling program would need to be diligent about waste sorting. The successful implementation of a formal recycling program would also provide economic benefits in the form of jobs, both skilled and unskilled, as well as revenue from exporting recyclable waste to other countries. A benefit in the form of a greener reputation for the Dominican Republic is another great aspect of this project; and it may help in maintaining the area as a tourism destination.
6.2.3. Waste to Energy Plant
One way in which Santo Domingo could greatly reduce the solid waste inflow is through the utilization of a Waste-to-Energy (WTE) plant. A plant of this type has three primary benefits: 1) a reduction in waste, 2) the generation of electricity to power the plant itself and for the area, as well as 3) providing an alternative endpoint for waste that is less environmentally taxing than even a conventional sanitary landfill.
This component is entirely dependent on the successful segregation of waste at both the landfill and recycling center levels. Waste-to-Energy plants as a solid waste management strategy are very common internationally. Sweden, a highly developed country, incinerates the majority of its waste, and, while there are often associated concerns, such as a reduction in air quality due to the introduction of particulates from the burning, the impact is often negligible. That is, it does not outweigh the benefits of limiting the amount of waste that sits in landfills and taints the landfill site, as well as those who live nearby, for a long period. It can be a quick and economically viable method, if managed and maintained correctly.
WTE facilities are capable of incinerating both biomass materials as well as plastics. They utilize the heat generated to produce steam that spins turbines to produce electricity. It takes only 110 tons of waste on average to generate 1 MW of electricity (Times of India, 2015). Given that 3797 tons of waste are generated per day in Greater Santo Domingo, this amount is attainable. In the US, 1 MW is enough to provide electricity for almost 800 homes for a day (California Energy Commission, 2018); in the Dominican Republic this number would be even higher, due to lower energy usage and high population density.
As a relatively expensive item, the 5-year plan period considered in this paper would be the optimal time to conduct a pilot project through the construction of a 1 MW plant. Based on cost estimates from the construction of a plant in Chennai, India, the proposed project would cost about $1.5 million USD (Times of India, op. cit.), accounting for construction of the plant, as well as operating costs. Later, with funding from the energy sector and the success of the pilot project, about $4 million USD would be available for the expansion of the plant into a fully operational facility. As a city located on an island with limited space, depending solely on landfills is not practical long term, especially as the country’s population grows. This plan would also help as a space-saving measure, since not much land is needed beyond that for the incinerator facility. Again, it is important to consider the public perception of a facility like this and build it in a location that minimizes public exposure from the undesirable sight and smells of such a facility. This could be achieved by building it close to the Duquesa Landfill. It is in a sparsely populated area north of Santo Domingo. Nevertheless, it is important to consider that the population closest to that location lives within informal settlements comprised of those struggling financially. It is important to do research to ensure that the site location does not endanger the public health or lower the aesthetic quality of the area for residents already living there.
7. Industry Sector
7.1. Existing Economic Conditions
The Dominican Republic has shifted from relying on exports of agriculture goods over the last several decades to focusing on manufacturing and service sector expansion (CIA, 2018). The growth in these two sectors has contributed to a mostly steadily increasing GDP from 1970 onward (GDP (Current US$), 2018). However, the economic advances of the country have not been spread evenly throughout its population. There are still large numbers of people unemployed, or who live in poverty (Navarez, 2015).
At present, the largest contributor to GDP is the service sector at 62%, followed by the industrial sector at 33%, and, lastly, the agricultural sector at 6% (CIA, op. cit.). Comparing these values to 2010 data from the World Bank shows that the service sector has increased in GDP by roughly 0.5%, manufacturing has fallen by roughly 1%, and agriculture has remained steady at roughly 6% (World Development Indicators, 2017). The transition from a developing to a fully developed country continues, but it is probably nearing its completion.
Employment as a percent of the workforce matches that of GDP. The service economy makes up the largest employer at 70.2%, followed by industry at 17.38%, and agriculture at 12.42%. For the service and industrial sectors, growth rates of GDP and employment have matched respectively, with service employment and GDP percentages increasing in step and industry employment and GDP percentages decreasing. The agricultural sector did not see this shared trajectory of GDP and employment. While agriculture has remained at 6% of GDP from 2010 to 2017, the number of individuals employed in this sector has seen a 2% decrease. GDP input has remained steady, while the workforce has decreased (Distribution of Employment by Economic Sector, 2017). This is most likely due to the shift to a more mechanized and automated agricultural system.
Adverse weather, such as hurricanes, may also have had an impact in reducing employment in the agricultural sector. A severe storm can damage agricultural products and agricultural land significantly. For those involved in this industry, this can pose a major issue. The chance of a storm destroying a crop is not insignificant, and the impact such an event would have on individual finances and income can be quite consequential. The effect large storms can have on the agricultural sector has been known for some time. More than a decade ago, Storm Noel damaged or destroyed crops in over seventy communities in the Dominican Republic. The more recent Tropical Storm Erika destroyed 40% of the Dominican Republic’s banana crop. In 2017, Hurricane Maria hit the Dominican Republic and caused 5400 hectares of bananas to be flooded (Watson, 2017). The possible destruction of agricultural products by storm, along with many other social and economic factors, is pushing lower income individuals of rural Dominican Republic to urban areas. This migration to cities is aiding in the increase of the service economy, as many urban jobs fall into this category.
There are several main products, which make up a large part of the Dominican Republic’s total exports. These include gold, which makes up 17% of exports, medical instruments, which make up 13%, textiles, which make up 13%, and rolled tobacco products, which make up 6.9%. Several other products contribute less to exports, but are still significant to the country’s economy, such as low-voltage protection equipment, bananas, cocoa beans and footwear. The total value of all exports is $10.1 billion USD (OEC, 2018). Nearly half of all Dominican exports are destined for the United States. Canada, Haiti and India make up the next top export destinations at 8.7%, 7.9% and 6.4% respectively (Ibid.).
Imports to the Dominican Republic are more diversified than exports, indicating heavy reliance on other countries for a variety of products. The largest percentage of imported products into the country is machines, making up 19% of all imports. This includes such products as electrical communication equipment, computers, turbines, other complex machines and air conditioners. 12.3% of imports are oil products, such as refined and crude petroleum. Other important imports include transportation equipment such as cars, chemical products, metals, textiles, plastics and rubbers, and foodstuffs. The total value of all imports is $17.5 billion USD. More than 50% of all imports come from two countries, the US and China, providing 42% and 13% of imports respectively. Other key countries include Mexico, Spain and Brazil (Ibid.).
A large section of the country’s service industry is the tourist industry. In 2017, more than six million tourists came to the Dominican Republic to enjoy the beautiful landscapes, beaches and cities. This is a 3.9% increase compared to the year before (Holschuh, 2018).
The inflation rate of the Dominican peso is currently 3.52%. This is relatively low and perceived by many economists as healthy (Dominican Republic Inflation Rate, 2018). A low rate of inflation, such as that seen in the Dominican Republic, is theorized to help stimulate the economy and maintain growth. This low inflation rate also means that foreign interests invest more easily in the country as a low interest rate means a quicker return on investment and less risk of developing projects having skyrocketing costs.
Santo Domingo as the capital of the Dominican Republic serves as the country’s main financial, industrial and governmental center. Free trade zones, located in and around the city, also help concentrate industrial and manufacturing activities around Santo Domingo. The consolidation of the manufacturing, service, financial and governmental sectors in and around the capital city truly makes Santo Domingo the center of economic life for the Dominican Republic. It is neither hyperbole nor exaggeration to say Santo Domingo is the heart of economic activity for the entire country.
Free trade zones house many prominent foreign manufacturing facilities such as Lanco, Bravo, Gerdau Metaldom and Frito-Lay. These free trade zones allow for the import and export of materials and products without tariff application from the host country. In this way, raw materials may enter Santo Domingo at market rate, be processed, refined or manufactured into new products, and then exported, all without any import/export fees. These zones encourage companies to locate in Santo Domingo and provide over 120,000 jobs. The downside to this arrangement is that all materials and products made in the free trade zones must be exported. Many of these products, as mentioned previously, are shipped to America. These zones allow companies to import and export materials/products with no additional tariff cost, while also gaining access to cheap labor (Special Economic Zones in the Dominican Republic: Policy Consideration for a More Competitive and Inclusive Sector, 2016).
While large companies and corporations play a key role in the economy of Santo Domingo, small businesses play a major role in the city’s economy, as they do for any city. These small businesses, such as restaurants and local services, provide job opportunities for less skilled or less educated individuals.
7.2. Economic Outlook
World economic growth in 2018 is predicted to be at its highest level since 2011, reaching nearly 4%. Nearly all countries are expected to share in this growth, with only eight countries out of 193 expected to have a shrinking economy. Of global regions, the emerging Asian market is forecasted to have the strongest growth of between 6% and 7%. The Latin America and Caribbean (LAC) region, on the other hand, is projected to have the lowest growth rate, that of 2.5%. This figure excludes Venezuela, as its projected growth is −15% due to country specific and political reasons, and this is not appropriate to include in a regional evaluation (Cavallo & Powell, 2018). Over the next several years, the economy of the Dominican Republic is expected to continue along its current trajectory of growth. Two of the main pillars of the economy, tourism and services, are both projected to continue to grow (Myers, 2014). Similarly, the domestic economy is forecasted to diversify and grow as the population of the country continues to become more middle class and have more disposable income.
The United States, as the largest trading partner of the Dominican Republic, plays an important role in the strength its economy. As such, the positive economic growth expected for the US will also help maintain the growth of the Dominican Republic’s economy. Similarly, many Dominicans live and work in the US, sending money back home to family. As the US grows, the remittances sent back to the Dominican Republic are expected to grow in turn. The diversified economy of the Dominican Republic helps it avoid severe negative impacts should one aspect of its economy be damaged or experience decline.
7.3. Priorities
In order avoid a plateauing of growth, several objectives should be prioritized. That is, investment should be made to increase renewable energy generation domestically; the manufacturing sector should aim to increase the complexity and, thus the value of goods produced, and maintaining tourist growth through increased tourist destination options and diversified tourist types should be prioritized. To fulfill these objectives, the government should invest in and facilitate 1) the creation of a solar cell manufacturing plant, 2) the creation of a tourism focused marketing firm, 3) the construction of an eco-resort cocoa farm tourist destination, and 4) the construction of a business focused convention center.
7.4. Proposed Projects
7.4.1. Solar Cell Manufacturing Plant
It is proposed by the industry team to construct and operate a solar cell plant to help reduce the country’s reliance on fossil fuels while also diversifying the manufacturing sector of economy. The solar cells produced would be exported to countries in the Caribbean, along with North and South America. Cells would also be sold in country for large-scale solar projects or for individual use. Such a plant would increase exports and create high paying manufacturing jobs. The plant would be located near Santo Domingo where a workforce familiar with manufacturing already exists. Transportation of goods into and out of the country, and the infrastructure associated with this, already exists thanks in part to established free trade zones.
The demand for solar cells would likely increase in the region and worldwide as countries continue to take climate change more seriously. Recent climate change reports lay out a desperate plea for countries to reduce their greenhouse gas emissions immediately and significantly. Reports like this help drive the desire for solar. The construction of a solar cell manufacturing plant in greater Santo Domingo would allow the country to reduce its own greenhouse gas emissions and reliance on imported fossil fuels, while also positioning itself as a regional exporter of solar cells.
Solar cells manufactured in the Dominican Republic would be able to take advantage of close proximity to large markets, namely the United States. Lower shipping costs as compared to China-made solar cells, along with lower costs of labor, will position Dominican made solar cells favorably in the North and South American markets (Goodrich, 2011).
Based on recently constructed solar cell manufacturing plants, this project is estimated to have a total cost of $70 million USD. A 177,000 square foot parcel of land located in the north-west section of Santo Domingo would cost $3.5 million USD, and construction of a 150,000 square foot plant would cost approximately $65 million USD. The remaining $1.5 million USD would be used to purchase auxiliary equipment such as trucks, as well as to pay employee salaries as production begins (Oliver, 2018). Existing solar cell manufacturing companies would be approached to fund the project, while additional funding could come from other foreign and domestic investment as well as the government budget.
7.4.2. Tourism Focused Marketing Firm
It is also proposed to establish a private marketing firm, which would work with local and federal agencies to identify potential foreign tourist groups for specific online marketing campaigns. Most tourists to the Dominican Republic come to relax on a beach and soak in the sun, but there are many other inland and niche attractions, which are being underutilized. To promote inland and niche attractions, a marketing firm, contracted by local and federal government agencies, would help promote underutilized tourist attractions. The government does operate an existing tourist website, called Go Dominican Republic, which lists several inland and niche attractions, such as Plantation tours, national park tours, cigars and rum experiences and cultural events. The goal of the tourism marketing firm would be to expand the list of attractions while also connecting potential groups to appropriate resources and marketing material to increase interest in visiting the Dominican Republic. Birders, for example, could be attracted to the island by promoting rare birds only found on Hispaniola (Birding in the Dominican Republic, 2018). Catholics and other religious groups could be encouraged to travel to the Zona Colonial to see the oldest church in the Americas, the Catedral Primada de America. Assent of the highest mountain in the Caribbean, Pico Duarte, could attract climbers and hikers.
The total cost to start a small tourism marketing firm is low, approximately $20,000 USD. This would cover the costs of computers, monitors and other office equipment. The cost to operate and successfully market would be approximately $100,000 USD annually. This would cover the costs of three digital marketing specialists and one manager, along with software licensing costs, travel, office rent and digital marketing (Digital Marketing Specialist, 2018). Financing would come from local or foreign marketing firms, which would be interested in expanding existing operations. Additionally, contracts between the marketing firm and local and national governmental agencies of the Dominican Republic, paid for by the Ministerio de Turismo, would contribute to covering expenses.
7.4.3. Cocoa Farm and Eco-Resort
Another proposal is to start and manage an eco-resort and cocoa farm to attract eco-tourists to inland Dominican Republic. Cocoa has been, and is likely to continue to be, a highly desirable cash crop. Interest in, and awareness of, fair-trade and ethically harvested products have also become more important to many consumers. The construction of a cocoa farm would take advantage of the Dominican Republic’s climate, as well as its long agricultural history. The cocoa would be grown in adherence to organic standards and sold to foreign markets at premium prices. An eco-resort, an environmentally friendly and nature-focused resort, would also be located onsite. There are two varieties of eco-resort, which could be constructed: a bare-bone, low-cost option, or a luxurious, well featured expensive option. The bare-bones eco-resort would consist of several simple structures to accommodate guests and a communal kitchen. These structures would provide only the basic needs required by guests, including furniture, a small bathroom, several electrical outlets and an outdoor sitting area. Wi-Fi, televisions and air conditioning would not be provided. The luxurious eco-resort would consist of larger, more secluded structures, which include more amenities, namely air conditioning. Regardless of the version, an eco-resort should focus on the surrounding environment. Trails should be constructed around the property to highlight natural features, while bikes, kayaks, fishing gear and other outdoor recreational equipment should also be provided. The combination of cocoa farm and eco-resort should also be taken advantage of. Having guests be guided through the growing, harvesting and processing of cocoa beans would attract guests who want to get their hands dirty and have new experiences. Cocoa harvested by guests could even be processed and turned into chocolate, providing a unique and special farm to table experience.
This first cocoa farm eco-resort would act as a pilot program for similar resorts, setting an example of what could be done to increase tourism while also creating new and well-paying jobs for those without professional degrees. If the first eco-resort would prove favorable, then expansion of the program would occur. Increased government support for cocoa farm upgrades and retrofits to include an eco-resort option would occur through loans and grants.
Upfront costs would be substantial as appropriate sized farmland, cocoa trees and farming equipment would be expensive. The farm property would cost $1.9 million USD, which would include cocoa trees and watering equipment.
Retrofits and construction of the bare-bones eco-resort would cost approximately $30,000 USD, while the luxurious eco-resort would cost approximately $100,000 USD. Additional costs, such as initial marketing, employee wages and website creation upfront would be more than $2 million USD. Annual costs, consisting of cocoa farm operation and eco-resort operation, would be approximately $4 million USD (Fleming, 2009). Revenue from cocoa production would cover these costs, positioning all eco-resort revenue as direct profit.
Retrofitting and construction of an eco-resort on an already existing and operational cocoa farm would greatly reduce the cost and make it a more viable option for independent and small farm operations. Funding of these retrofit projects could be via bank loans or government investment, most likely from the Ministerio de Turismo.
7.4.4. Convention Center
The final proposal here is to construct a convention center near Santo Domingo to help increase business travel to the Dominican Republic. Nearly all tourists who enter the Dominican Republic do so for leisure, not for business. Business travel to the country makes up less than 10% of tourist activity (Travel and Tourism Economic Impact, 2018; GoDominican Republic, 2018). The goal of this project is to increase business travel to the Dominican Republic, specifically to a location near the capital of Santo Domingo. Construction of the convention center, along with possible enhancements to local roads and infrastructure would be done over several years. A hotel would also be built next to or above the convention center in order to provide convenient lodging for all attendees. The benefits of this project would be twofold, i.e., increased business tourism and job creation.
The convention center would be located within the city of Boca Chica, a 15-minute drive from the airport and a 45-minute drive to the capital. The location of the convention center is key to its success. Boca Chica is a beachfront area with an established nightlife, shops and restaurants. Close to the beach and nearby amenities, it would attract companies to the convention center. Easy access to and from the airport is also essential as business clients would not want to travel by car from the airport any longer than necessary. A drive of less than an hour to Santo Domingo is also ideal as it provides easy access to the financial and governmental center of the country, along with many tourist attractions. The Dominican Republic is just a short flight from major cities and markets, including Atlanta, Miami, Kingston, San José, Barranquilla, and San Juan. Many Europeans also travel to the island due to direct flights. Businesses from these locations could be attracted to this convention center. A weekend long conference at the Boca Chica convention center could be part business and part vacation, as many attendees might bring their spouses or families for an extended stay.
A convention center would help stimulate the surrounding economy while also providing new employment opportunities. An economic impact study from the University of San José estimated that the 315,000 people who visited a California convention center increased local spending my $45 million USD. The same facility also employed 180 full-time staff members, with additional part-time staff required for specific trade shows and events (Yen, 2016).
Capital costs, however, are significant. Land acquisition, construction, and operation and maintenance of a large building like a convention center would require a large upfront investment. The price for the desired parcel of land in Boca Chica could not be found, but based on estimates of other Boca Chica listings, it is estimated that land costs would be approximately $2.5 million USD (Land, 2018). The time to build the convention center would be approximately four years and cost approximately $100 million USD. This number is based on a $750 USD per square foot construction cost, which was assumed based on this source and the costs of building convention centers in the US (Spanberg, 2018). Funding would come from private and government investment. Many hotel and resort companies operate in the Dominican Republic already, including in Boca Chica, and would be approached as possible partners for this project. The government would invest in the project as well, to maintain itself as a stakeholder. The governmental contribution could come in several forms, including tax breaks, infrastructure construction, or direct investment, ether via increased city taxes or federal funds.
8. Transportation Sector
8.1. Background
Santo Domingo, as the capital of the Dominican Republic, has been experiencing extreme population growth. This growth has brought with it a need for new forms of transportation, which have been created with little to no regulation. Two and a half million individuals now use the urban public transportation system, and one million use private vehicles (Transporte Publico y Movilidad Urbana en el Gran Santo Domingo, 2017).
8.2. Metro
In September of 2005, President Dr. Leonel Fernandez Reyna created the Office of the Reorganization of Transportation (OPRET) with the main purpose of integrating a Rapid Transportation System for the main cities in the Dominican Republic. The routes would reduce the presence of inadequate public vehicles and help with heavy traffic and road congestion. The Metro system in Santo Domingo started construction soon after the creation of OPRET with an investment of more than $700 million USD (Domingo, 2018) to construct 34 three-car trains (see Figure 8) for two different rail lines (see Figure 9).
The lines run from 6:00 am to 10:30 pm Monday through Friday and from 6:00 am to 10:00 pm Saturday, Sunday and holidays. Passengers can purchase a single ride ticket for RD $15 ($0.31 USD) plus the travel option amount. A one-way trip fare is RD $20 ($0.42 USD), while a round trip fare is $40 RD ($0.83 USD). Another option for passengers is to purchase a Metro Rechargeable Card for $200 RD ($4.15 USD) that can be used in any Metro station and includes the purchase of the card for $60 RD and seven trips ($160 RD). The passenger then recharges the card for future trips (Metro of Santo Domingo, 2010).
According to the Master Plan for the Ordering of Transport in Santo Domingo, there are many expansion projects planned for the future of the Metro system. The first project is the expansion of Line 2 (see Figure 9). Over time, the system is supposed to evolve into six different lines to provide Santo Domingo with better connectivity (see Figure 10).

Figure 8. Metro car. Source: Schwandl, 2014.

Figure 9. Rail lines. Source: Schwandl, 2014.

Figure 10. Six additional Metro lines. Source: Metro of Santo Domingo, 2010.
8.3. Autobus
In 1997, President Fernandez created the Metropolitan Office of Bus Services (OMSA) to provide for the preparation, maintenance, repair and dispatch of the city’s buses (OMSA, 2018). These services would provide a quality, safe and affordable means of transportation for Santo Domingo residents and visitors. In 2016, the OMSA transported 22,998,365 passengers.
Since the creation of OMSA, there has been a total of 198 Mercedes Benz autobuses (see Figure 11) and 81 Hyundai MT Autobuses purchased for the system. OMSA offers five different modalities of services from which a person can choose. The first is normal service, which costs around $10 RD and is a bus without air conditioning, and it stops at every bus stop. The second service is the normal service with air conditioning. This service costs $15 RD and also stops at every bus stop. The third service is the express service, which runs at the same rates as the normal service, but makes fewer stops, which causes a decrease in travel time. This service is currently suspended due to the unreliability of the buses themselves. The fourth service is a special service that is only provided to governmental and non-profit social institutions for special activities. The final service that is offered is the University Routes service, which is a special route for the students at UASD, ETESA, O & M and other university centers (OMSA, 2018).
8.4. Guaguas
Guaguas (pronounced wawa) are the cheapest way to get around the city, but

Figure 11. An OMSA bus. Source: Bus-OMSA, 2014.
that comes with a cost. These small, privately owned taxi minibuses (See Exhibit 15) are a very popular means of transportation in Santo Domingo. On a legal trip, a guaguafits around 12 people into the minibus, but, on most trips, there will be between 20 and 25 people onboard. Passengers will pack into the minibuses to travel from one part of the city to the next. One thing to note when taking guaguas is that they do not have dedicated stops, so when a stop is approaching, a passenger will need to hit the top of the roof or alert the driver’s helper (cobrador). Whether or not the passenger takes the same trip every day, the price depends on the driver (chofer) (Guide to Public Transportation in Cabarete, 2018). There is no set fee for the ride from one place to another, but the unions have tried to put a limit on the price from $5 RD to $10 RD. Each individual guagua is assigned a specific route by the different transportation unions and is required to stay on that route, with most routes only including main roadways. Consequently, individuals using a route need to travel to a main roadway to get a ride on a guagua, which only runs until the sun sets (Figure 12).
8.5. Teleférico of Santo Domingo
There are around 270,000 residents living in La Barquita and the surrounding neighborhoods. These areas are separated from the rest of Santo Domingo by the Ozama River, making land-based transportation long and ineffective unless you own your own vehicle. Officials have estimated that of the 287,000 residents, 65% do not own a vehicle, and 80% are reliant on unregulated local transit (The Gondola Project, 2018). According to a video made by inhabitants of Santo Domingo, residents must take four different means of transportation to get from La Barquita to their place of employment in Ciudad Nueva (Rosario, 2015).
Officials in Santo Domingo recognized these problems, and, by early 2015, the government issued a press release for the construction of the cable car. POMA, a French ropeway manufacturer, had secured $3 billion RD ($65 million USD) from Agence Française de Developement (AFD) to start construction on the
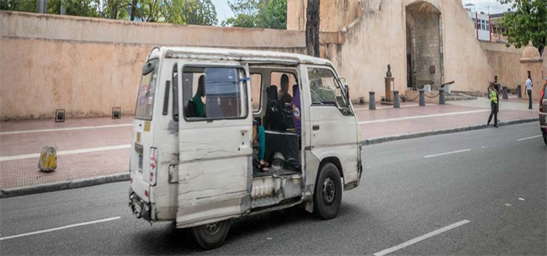
Figure 12. A Guagua. Source: Checkoutsam, 2016.

Figure 13. Teleférico of Santo Domingo. Source: The Gondola Project, 2018.
cable car in 2016 (AFD, 2018). By May 2018, the first line of the cable car was up and running for residents and tourists under the supervision of the Santo Domingo organization, URBE (Figure 13). This organization states that the cable car saves passengers 30 minutes of travel time and reduces the cost of tickets by 30% (The Gondola Project, op. cit.). The cable car operates Monday to Friday from 6:00 am to 10:30pm, Saturdays from 6:00am to 9:00pm, and Sundays from 8:00am to 9:00pm (Castillo, 2018). The cable car line costs passengers $20 RD (US $0.40) per ride, which is an inexpensive option over the four different original rides (The Gondola Project, op. cit.).
The first cable car line, which is already in operation, is a five km long route with four designated stations. All together, these stations transport 6000 passengers per hour and 54,000 passengers per day (AFD, op.cit.). The second cable car line will span eleven km and connect three different municipalities. This new route will benefit over 400,000 residents and should open in 2020 (Ibid.).
8.6. Motocochos
Motocochos are two-wheel taxi’s that replicate a motorcycle in other countries, except they allow for more than two passengers. A motococho is a popular form of transport in Santo Domingo because it can travel down small residential streets to carry passengers to the main transportation routes. Visitors to the city will see passengers carrying anything from chickens to pigs, suitcases and numerous children on the motocochos. Although these are the most inexpensive way to travel throughout the city, costing around $30 RD, they are also the most dangerous method of transportation for riders due to the road conditions. Motococho drivers will wear a yellow or green safety jacket to be identified as official drivers, but very few wear helmets or carry helmets for passengers (Local Transportation, n.d.). Recently, Uber has signed a contract to include motocochos as a ride option for passengers (Figure 14).
8.7. Taxis
A taxi in Santo Domingo is a vehicle that passengers call beforehand to take them from place to place. Once the passenger calls the taxi and states where s/he is getting picked up and where the destination is, s/he is given the total amount for the ride. The cost for a taxi ride throughout the city usually is around $150 - 200 RD. Since the taxis do not have meters, it is standard practice that the passenger confirms the price over the phone (Guerra, 2018). There are no buses or Metro lines that directly connect to the Santo Domingo International Airport; therefore, most commuters need to take a taxi to travel outside of the Metro and bus boundaries (Figure 15).

Figure 14. A Motococho. Source: Lauren, 2014.

Figure 15. A taxi. Source: Taxi in Dominican Republic, n.d.
8.8. Uber
In Santo Domingo, Uber is the most common and popular form of transportation for visitors and more prosperous residents. Uber has proven to be the most reliable, safe and economic transportation method in the city. In order to take an Uber, passengers download the app on their mobile phones and connect their credit card to the app. After the passenger creates his or her account, then s/he can request rides. There are many different car options when selecting an Uber (Uber, 2018). An Uber XL accommodates up to six passengers, while an Uber X takes up to four. There is also an Uber X VIP option, which transports passengers with the top-rated drivers for an additional charge. Recently, Uber added the option to book a motococho with the Uber Moto platform at a starting price of $20 RD (Diario, 2017). The Uber Moto platform requires a motococho driver to have a valid driver’s license and a letter of no criminal record. Along with guidelines for the drivers, there are restrictions for the motococho itself. The motococho must be a 2009 or newer model in good condition with a rear and front photo of the motorcycle displaying license plates. The motococho must also be registered and insured (Diario Libre, 2017) (see Figure 16).
8.9. Public Cars or Carro Publicos (Carritos)
Carro Publicos are unmarked vehicles (cars, trucks, vans) that run on set routes up and down the busiest streets of Santo Domingo. Most of these carritos are deteriorating and falling apart (see Figure 17). Each carrito accommodates two passengers in the front seat and four passengers in the back. Individuals pay for a seat in the vehicle, which usually ranges from $25 RD to $50 RD depending on the distance (GoDominican Republic, 2018). It is possible to pay double to get the front seat alone or quadruple for the back seat alone. Each carrito is marked on the outside with a transportation sticker (see Figure 17 and Figure 18), and each driver places his or her union ID in a visible spot on the insider of the car (Guerra, op. cit.).

Figure 16. Uber. Source: Uber, 2017.

Figure 17. Public car. Source: Barros, 2016.
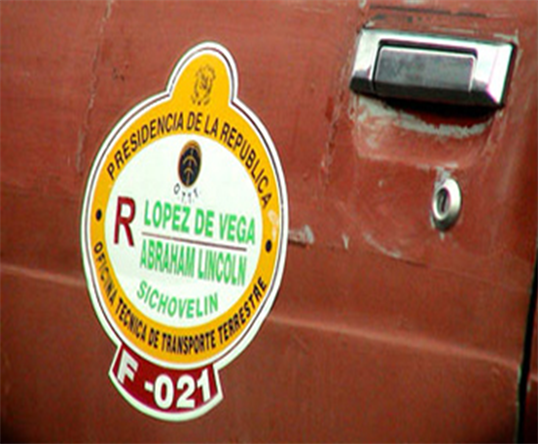
Figure 18. Transportation sticker. Source: Guerra, 2018.
8.10. Problem Statement
Santo Domingo is known around the world as a city with terrible transportation; it is often said that it is the worst in Latin America. First, there is the issue of connectivity. When tourists arrive at the Santo Domingo airport, there is no Metro system or city bus to catch a ride to the city center. Instead, they are required to get in an Uber or taxi, which can end up being expensive. This applies to the residents of Santo Domingo as well. This is a struggle that the government has been trying to solve by adding different services, but it took until 2018 to connect the eastern portion of Santo Domingo.
With an increasing population, growth in private vehicles, and urban sprawl, congestion has become the second largest issue that Santo Domingo transportation faces (See Exhibit 23). Much of this congestion occurs during the peak hours of 7:30am to 9:30am and 5:00pm to 7:00pm. There is also heavy traffic around the lunch hours of 12:00pm to 1:30pm (Pinto Tours, 2016).
The third largest issue that Santo Domingo transit faces is safety in both the vehicles and on pedestrian sidewalks. To deal with this issue, the Ground Technical Transportation Office was established to govern the safety and redesign of bus routes (UNESCO, 2017). This office allocated the different routes to drivers and worked with 17 national laws and 20 other laws that were put in place. These laws were created to provide a safer and more reliable transportation network. Unfortunately, the issues continued and even increased due to urban sprawl and the increase of private vehicles. Motorcyclists continue to drive without helmets and guaguas still keep their doors open with individuals hanging out the doors. Many drivers are aggressive and often ignore traffic signals when they are present. The streets also have huge safety issues. There is a deficiency of street lighting and the absence of many pothole covers, which creates a hazard for motorcyclists. Many of the sidewalks are disconnected and crumbling (see Figure 19 and Figure 20), which creates a problem for pedestrians walking to the different modes of transportation.

Figure 19. Traffic congestion in Santo Domingo.

Figure 20. Sidewalk in poor condition. Source: Graner Family, 2017.
8.11. Proposed Projects
8.11.1. Multi-Modal Transportation App
As mentioned throughout this section, many individuals utilizing public transportation need to take three to four different modes to get to their place of employment. Most of the time, the connecting mode of transportation is stuck in traffic. There is also the issue that many riders are uneducated about other transportation modes that might be less expensive. The proposed project of a multi-modal transportation app would provide a system to educate and inform riders. The goal for this app is to improve the public transit user’s experience, while increasing the use of public transit. Through this app, Santo Domingo public transit would be better connected, and street congestion reduced.
A multi-modal transportation app is a mobile app for both iOS and Android that is a one-stop app for a rider. This app would display all public transit lines to and from a specific destination allowing riders to identify the most price conscious mode of transportation (see Figure 21). The different transportation modes that the app would feature are the Metro lines, OMSA bus lines, the Cable Car lines, Uber, Uber Moto, and some taxi services. There is the potential that the app would collaborate with the different unions in order to receive some funding. The app would provide a system for a rider to map out a trip and pay for it in its entirety in one transaction. Once the transaction is approved, the rider would then have the option of receiving an E-Ticket (see Figure 22) or Print at Home Ticket. By providing two options for the tickets, the multi-modal app would be accommodating a variety of incomes. The app would also have a tracking system on the different modes of transportation that would allow passengers to follow the current time of arrival for the next bus/Metro/etc. It would show when different modes of transportation are stuck in traffic or having mechanical issues so that passengers can choose a different mode when in a rush.

Figure 21. Sample screen. Source: The ultimate transport App, n.d.

Figure 22. Sample E-ticketing. Source: Welcome to cross country, n.d.
An app bonus is that when there is a congested route or mode of transportation, passengers would be alerted and provided incentives to take a different mode of transportation, similar to that done with the Metropia app. The hope is that this would release some of the traffic congestion and reroute some of the vehicles to a different connecting road.
This app would also play an essential role in connecting tourists with the public transit system in Santo Domingo. The app would promote public transit to tourists, which would in turn increase the ridership on these modes of transportation. It would also be able to inform tourists of hot spots around the city and promote them to visit specific locations or neighborhoods. By encouraging local hot spots to tourists, it would create a better experience for the tourists that would in turn benefit Santo Domingo as a whole. The total cost for the 5-year project would be $248,000 USD.
8.11.2. Wayfinding Maps
When taking public transportation, tourists and commuters alike have a difficult time tracking the different modes of transportation. As a solution to this issue, the second project proposes that transportation and way finding maps be placed throughout different neighborhoods of Santo Domingo. This project focuses initially on the neighborhoods of Ciudad Nueva and Zona Colonial. It would reduce pedestrian frustration and create an overall better experience for tourists in Santo Domingo.
Connect point is a company that focuses on digital Smart Stops, signage and interactive kiosks for transit. The digital Smart Stops (see Figure 23) would be placed at the busiest bus stations and Metro stops and allow passengers to interact with the screen. Passengers would be able to track their mode of transportation and identify the buses/Metro they would need to make it to their destination via the touch screen kiosk. With the Smart Stops, tourists would be able to identify neighborhood hotspots and figure out the best public transit to get to the desired location. The Smart Stops are highly visible stands that are solar powered with an internal battery. This means that the structures do not require an expensive electrical infrastructure (Smart Stop, n.d.). Along with the Smart Stops, there would be a few digital bus stops (see Figure 24) placed throughout the city at the stops that have slightly less traffic (Digital Bus Stop, 2018).
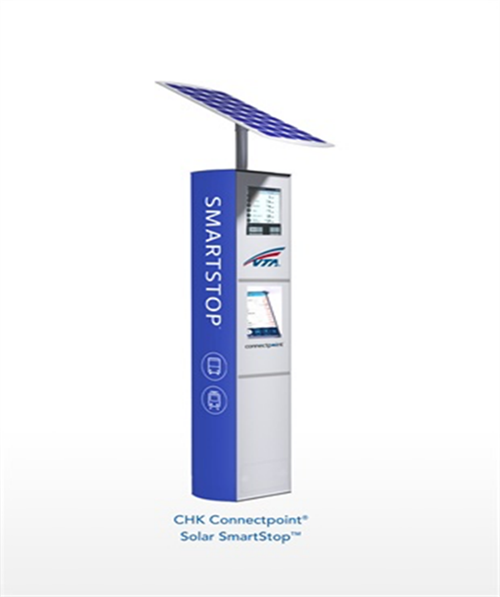
Figure 23. Smart Stop. Source: Smart Stop, n.d.
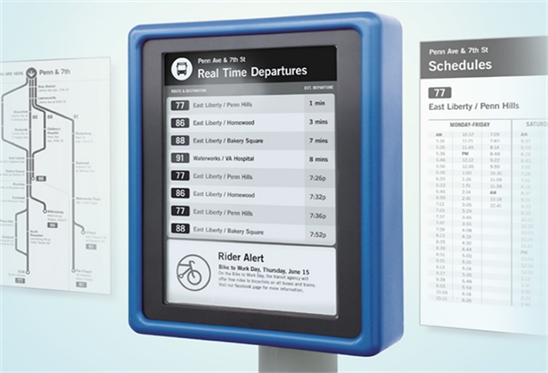
Figure 24. Digital bus stop. Source: Custom design, n.d.
The second part of this project would be the installation of different way finding maps throughout the city. Way finding maps provide a mix of services to the community, such as interactive screens to provide pedestrian directional information and a social media tracking program. The interactive screen would allow for pedestrians to figure out walking directions around the various neighborhoods in Santo Domingo. The project would start by placing these kiosks in the Zona Colonial and Ciudad Nueva. It would also have a feature for companies to promote their location and for it to be programmed for certain social media posts to scroll through during off time. This would allow for different social media hash tags and posts to catch the eyes of tourists and promote Santo Domingo’s businesses. It would be easy to update a program that provides pedestrians with up to date knowledge about the city. The total cost for both parts of the 5-year project would be $320,000 USD.
8.11.3. Sidewalk Repairs
To increase street safety and create a better pedestrian experience, the third proposed project would repair the sidewalks throughout Santo Domingo. The first targeted area would be Gazcue, in partnership with the energy team and the water team, which would be installing new energy lines and water pipes respectively in that area. When the city removes the current above ground energy lines and transfers them below ground, it would also renew the sidewalks in this neighborhood. This collaboration would provide an easy fix that would create pedestrian friendly and aesthetically pleasing sidewalks. It would remove the large holes and level out the current sidewalks. With a little extra money, the project could install bollards and improved street lighting to protect pedestrians from traffic. The sidewalks would be repaired during the energy sector project construction. Therefore, that sector would fund most of these repairs. However, the transportation sector would provide funds for the new streetlights and bollards. These funds would come directly from the already allocated funds to the transportation sector and would total $179,500 for the 5-year project. Thus, total costs for all three transportation projects over the course of the 5-year environmental plan for Santo Domingo would total $737,500 USD.
9. Energy Sector
9.1. Background
Energy demand in the Dominican Republic has been steadily increasing, even with population growth remaining relatively stagnant in the last decade. The demand is projected to increase by 6% annually in the coming years with an infrastructure that cannot handle the increased load. This increase in demand comes from additional public and private housing and emerging industries in the Dominican Republic. The problem arises with electricity production. The Dominican Republic is a small island nation with no natural access to fossil fuels for electricity production, and thus needs to import the fossil fuels (coal, oil and natural gas) the nation requires from the United States (OEC, n.d.).
The distribution network covers 88% of the population in both rural areas inland and cities near the coasts. With a large disparity of wealth, especially within the major cities like Santo Domingo, energy theft is a major issue with nearly 8% of all connections being from illegal or illegitimate connections (World Bank, 2018).
9.1.1. Electricity
The Dominican Republic’s electricity is produced by private companies, with the exception of the hydroelectric dams, which are state-operated. Many of these private companies are not Dominican but are from the US and European countries as the result of investment groups and foreign aid deals. Electricity production is broken down by geographical location, with all the coal and natural gas and wind power plants located in coastal regions, while the hydroelectric plants are located on inland rivers and lakes. The transmission of electricity is the full responsibility of the state-owned company ETED (Comisión Nacional de Energía), but the distribution of electricity is operated by three companies, two of which are owned by the state. The state owns Ede Norte and EdeSur, while Ede Este is owned by a private company. EdeNorte distributes energy to the northern region, Ede Sur to the southern region and Ede Este to the eastern region. These companies are all part of a holding company CDEEE (Corporación Dominicana de Empresas Eléctricas Estatales), which holds all the government owned generation, transmission and distribution companies (Global Energy Network Institute, n.d.).
Coal and oil are the primary forms of energy that the Dominican Republic utilizes, and the country is heavily reliant on foreign trade and foreign markets for them. This becomes problematic when oil prices are high or imports cannot arrive on time due to delays, which puts pressure on generation companies to keep reserves of fossil fuels on hand in case the island is inaccessible during hurricane season (Ibid.).
In Santo Domingo, power outages are common. This is the result of a crumbling electrical grid, which is old and is often overwhelmed; that is, the infrastructure is frequently not able to meet demand within the city. Blackouts are so common that many people own gas generators or a bank of car batteries in case the power goes out. In recent years, the Inter-American Development Bank has been funding projects to stabilize the energy sector before an energy crisis arises. The Dominican Republic has 3394.2 MW of installed capacity with 2924.9 MW coming from fossil fuel sources. This means renewable sources only make up 13.8% of total energy production, which indicates an over reliance on fossil fuels (Ibid.). Nevertheless, there are currently proposals for two 300 MW coal-fired power plants costing $1 billion USD each funded by private venture groups (Figure 25).
9.1.2. Environmental Characteristics
The Dominican Republic’s location has a large impact on the energy sector. There is no steady supply of fossil fuel resources that can be mined and used for energy production on the island, so almost all fossil fuels are imported, which presents a problem. The Dominican Republic sits between two major corridors of hurricane travel, meaning the nation is affected by a lot of hurricanes and tropical storms during hurricane season. Thus, there could be delays in the shipping of necessary fuel, and storms could potentially damage existing plants,

Figure 25. Map of Distribution companies in the Dominican republic. Source: http://mapas.cne.gob.do/html/.
which are in coastal areas to facilitate shipping. With potential energy investments from the World Bank and the Inter-American Development Bank, the focus should lean more towards renewable sources of energy, which are more resistant to hurricanes and tropical storms as they are generally located further inland. They also last longer than fossil fuel plants. A national energy goal should be to reduce the country’s reliance on foreign trade for energy products and allow for state owned passive energy generation.
Fossil fuel power plants have an average lifespan of about 50 years; and, of the 20 fossil fuel plants in the Dominican Republic, 10 are nearing the end of their lifecycle with no real plans to replace the capacity these plants produce for the long term. Now is an appropriate time for the nation to transfer its energy production to renewable sources. Coal and oil are expensive, several of the fossil fuel plants are nearing the end of their lifespan and there are foreign investors willing to fund renewable energy projects in the area.
9.1.3. Renewable Plants
The Dominican Republic would see significant economic value in switching to renewable forms of energy, as well as more self-reliance in energy production, a more disaster resistant grid and more consistent energy production. As already noted, renewable energy production makes up 13.8% of current gross energy production in the country, with the main sources being hydroelectric plants and solar arrays. The country recently completed the largest solar array in the Caribbean with the Monte Plata Solar Array in the Monte Plata region north of Santo Domingo. The Monte Plata Array was proposed as a 33.4 MW array, but it was expanded with additional funding to generate 67 MW (Ross, 2016).
With the falling cost of photovoltaic production and maintenance, the Dominican Republic has been aggressively looking to expand energy production with solar. Currently, it costs around $3.3 million USD per MW to produce energy with coal generation and $1 million USD per MW of solar energy production. (Berke, 2018). The average annual cost to the Dominican Republic of imports of coal, gas and oil is $2.32 billion USD (Index Mundi, n.d.). Solar energy production would remove those import and consumption costs as it is a passive form of energy production with low maintenance costs. Since the average time to pay off large scale solar is 10 to14 years, solar arrays that are at the same capacity as a coal-fired power plant would pay for themselves within a fifth of the lifespan of a coal-fired plant and generate passive income even when maintenance and operating costs are factored in (Ibid.). The Dominican Republic is no stranger to renewable energy production either. The nation has used hydroelectric dams for a significant portion of its electricity production in inland areas. With the addition of the largest solar array in the Caribbean and several small wind farms, the opportunity for expansion exists. The Dominican Republic has viable areas for efficient solar (Global Solar Atlas, 2018) and wind (Diario Libre, 2018) production (Figure 26).

Figure 26. Monte plata array expansion. Source: https://www.powerengineeringint.com/articles/2016/03/solar-pv-plant-inaugurated-in-dominic-republic/html/.
9.2. Priorities
9.2.1. Modernization of the Electrical Grid
Through partnerships between the state-owned CDEEE and the private generation and transmission companies, an integrated approach modernizing the electrical grid at three different scales throughout the country is necessary. These scales are the large scale of rural spaces that connect the cities to their generation plants, the scale of the entire city grid and the scale of the city block. These three scales of grid modernization would greatly reduce distribution losses, limit blackouts and streamline energy transmission to every connected building in every city in the Dominican Republic.
9.2.2. Reduction of Fossil Fuel Based Electricity Production
Shifting away from fossil fuel-based electricity production would have a large impact on the Dominican Republic’s economy by reducing by nearly 12% its $17.5 billion USD yearly import bill, which is due to the fossil fuel imports needed for electricity production (Ibid.). Using renewable and passive forms of energy, such as solar and wind, can keep electricity generation state-owned and eliminate the need for importing fossil fuels for generation.
9.3. Proposed Projects
In this section, the energy team proposes projects that are solutions supporting the two major priorities described above. The projects explained below consider the needs of the energy sector, capital investment from foreign entities and integration with other sectors. These projects are proposed to provide the Dominican Republic with more energy independence, a stable electrical grid and reduced carbon emissions.
9.3.1. Large Scale Solar Project
A first step in reducing the Dominican Republic’s dependence on fossil fuels for electricity production is the construction of five large solar arrays in a remote valley near Canoa. This would be funded by diverting money from the two proposed 300 MW coal-fired power plants referred to previously in this chapter to the solar arrays. The amount necessary would be $625 million USD of the $2 billion USD in funding for the coal-fired plants.
Convincing the government to divert the funding to solar projects that yield the same output, last longer, generate more profit and at just over a fourth of the original budget should (in theory) be relatively easy. However, assuming some of the foreign investors would withdraw their funding with the change of project, even with foreign banks wanting to invest in renewable energy projects in the region, and if no new foreign aid is forthcoming, there is still enough capital to begin planning and construction of these arrays. With the Caribbean’s largest solar array already having been built in the Dominican Republic, public approval would support these projects, and there would not be a need to test the concept with a pilot project as the Monte Plata Array (see Figure 27) could act as the pilot project, even if these new arrays would be at a larger scale.
One 120 MW array could be constructed per year for the first three years, and two 120 MW arrays could be completed and operational by the fourth year, so that by the fifth year all arrays would be operational. After a one-year construction phase, the arrays would be producing nearly $45 million USD of passive

Figure 27. High End Apartment Project in Gazcue. Source: https://real-buzz.com/RealEstate-detail/Dominican-Republic_Santo-Domingo_Los-Casicazgos_Luxury-apartments-for-sale-In-Los-Casicazgso-Dom-Rep_10210_house-for-sale_ USD_93074112/html/.
revenue at this scale, including operation and maintenance costs. This means each 120 MW array would have a payback period of under eight years, if the price of solar remains at the current $1 million USD per MW. Trade arrangements could also be made to reduce the price of the arrays by either buying solar panels in large quantities or negotiating with foreign companies to build a factory in the Dominican Republic in order to manufacture solar panels for these arrays and for additional solar projects in the future in the country and the rest of the Caribbean. Thus, the solar panel factory proposed by the industry team in Section 7.4.1 is a proposal that should be adopted. Moreover, Solartech Energy, a Taiwanese solar panel company, could be targeted for an agreement as this solar panel company provided the solar panels for the existing Monte Plata array. Chinese companies are another alternative, especially since the Dominican Republic and China have recently established diplomatic relations.
9.3.2. Small Scale Solar Project
To reduce the load on the electrical grid in the short-term until the grid is modernized, the government could fund individual solar arrays on a building-by-building basis. The funding could come from taxes, or from the $395 million USD the World Bank is already investing in renewable energy projects. The initial building scale solar interventions would be in an older, relatively wealthy mixed-use area of Santo Domingo called Gazcue, with plans to expand to other areas of the city after the 5-year period. The project would start with a 6-month feasibility study costing $200,000 USD that identifies potential buildings that could be pilot studies. A hotel, a high-end apartment building and two restaurants are proposed as each building type has different, but much higher, electricity needs than the average household in Santo Domingo. These studies would showcase the viability of solar in Santo Domingo so that within the 5-year plan period, citizens could sign up for tax incentives that reduce the price of private solar arrays, which would reduce the load on the current grid. The objective of these solar array trials would be to determine the viability of individual solar in the area. The long-term goal would be to expand solar to many of the buildings in Santo Domingo in order to reduce the load of the current electrical grid, improve electricity reliability, reduce the instances of stolen energy and equip households and businesses for electric car hookups. Initially, an apartment building such as the one shown in Figure 26 and a restaurant as seen in Figure 27 would be used and a restaurant similar to the one seen in Figure 28 and a hotel like the one in Figure 29 and Figure 30 would be added to the program later in the 5-year plan.
All four buildings would cost $4 million USD for the solar arrays, and the government would allot $20 million USD of tax incentives to anyone wanting to opt into this program for individual solar arrays.
9.3.3. Underground Electrical Lines in Gazcue
In order to modernize the electrical lines in Santo Domingo, an expansion of the

Figure 28. Beachside restaurant in Gazcue. Source: http://depaseo.com.do/.

Figure 29. Boutique restaurant in Gazcue. Source: https://steemkr.com/art/@anadeleonartista/la-fabrica-contemporanea-parte-i.

Figure 30. Hotel in Gazcue. Source: http://hotel-riazor.hotelssantodomingo.net/en/html/.
existing effort to move power and telecommunication lines underground in the nearby Zona Colonial could be planned for Gazcue. Since Gazcue is located on the southern coast, which is susceptible to damage from tropical storms, moving the lines underground would prevent damage to them. Additionally, moving the lines underground would reduce the number of illegal connections as subterranean lines are harder to get to. This project is estimated to cost around $10 million USD for the Gazcue area as underground line installation is more expensive than traditional installations. However, this project is planned in conjunction with the water (See Section 5: Water) and transportation (See Section 8: Transportation) teams to complete three projects in the area at once. The lines would need to be placed under existing sidewalks and usually run next to existing water pipes. The three sector teams would combine projects to replace damaged or old water lines while electrical lines are moved underground, and the damaged existing sidewalks would be replaced after the installation of the utilities under the sidewalks is complete. All three sectors benefit from the project so the higher expense for underground lines can be justified.
9.3.4. Upgraded Transmission Lines
One of the major energy losses in any electrical grid occurs in the transmission from the energy production site to the distribution centers and substations. Usually, transmission lines are high voltage lines to prevent losses and are then stepped down in voltage for typical use by end users. These transmission lines are normally located inland and connect remote towns and major cities to electricity production facilities. With an upgrade project costing $50 million USD, the entire nation would have a connection to energy sources, both renewable and fossil fuel powered; that is, 100% of the population would have electrical connections as opposed to the 88% with connections currently.
9.3.5. Battery Storage Facility
With solar energy production, electricity is lost if more is produced than is used. To counter this, many solar arrays use a battery storage facility that connects to local substations so that any unused electricity can be stored for nighttime use when the arrays cannot produce electricity. With large enough battery storage capacity close to a city like Santo Domingo, blackouts could be eliminated. Currently, during peak electricity use, if the fossil fuel-powered plants cannot ramp up production at the rate at which it being used, the result is a blackout. If electricity were stored in battery facilities near substations, reserves of electricity could be used until normal service resumes (Figure 31).
9.3.6. Electric Bus Fleet
With the large-scale solar arrays being constructed over five years near Canoa, there would need to be several staging areas for the manufacture and shipment of materials for the arrays’ construction. Furthermore, there would be hundreds of skilled workers on site for the construction of the projects, and, because of the remoteness of the site, these workers would be stationed in nearby towns during the construction phase of each of these projects. Some might even become permanent residents. With a fleet of buses for the workers of these plants that have specific routes from nearby towns to the project sites, workers could get to and from the project sites easily and efficiently and at little cost to the company. The buses could be cheap to run if they would use electricity generated from the arrays. In addition, the operation of this fleet could function as a feasibility study for mass electric public transit in urban areas that is truly run on clean solar energy. If the small-scale solar project program gets expanded after the 5-year plan, fleets of buses and individual electric cars could become popular options with charging from the small solar arrays (Figure 32).

Figure 31. Typical electrical line condition in Gazcue. Source: https://alchetron.com/Gazcue/html/.

Figure 32. Battery storage facility connection to grid. Source: https://www.autoevolution.com/news/renault-to-build-europes-largest-ev-battery-energy-storage-facility-128893/html/.
9.4. Capital Costs
The estimated costs for each project are detailed below:
Project 1: Large Scale Solar
Ø 5120 MW arrays at $125 million USD each; therefore, the project total cost is $625 million USD.
Project 2: Small Scale Solar
Ø 6-month feasibility study at $200,000 USD.
Ø 4 small-scale solar array projects at $4 million USD.
Ø Tax incentives and marketing for solar array program at $20 million USD.
Ø The project total cost would be $24.2 million USD.
Project 3: Grid Modernization
Ø Underground electrical line project in Gazcue at $10 million USD.
Ø Rural transmission line upgrades at $50 million USD.
Ø Pilot battery storage facility project near Santo Domingo at $5 million USD.
Ø The project total cost would be $55 million USD
Project 4: Electric Bus Fleet
Ø $1 million USD for a fleet of 10 buses at $200,000 each.
Ø $1 million USD a year for operation and maintenance costs over five years.
Ø The project total cost would be $6 million USD.
The grand total of costs for the four energy projects would, therefore, be $734.4 million USD.
10. Finance
10.1. Role of the Finance Team
For the completion of each project proposed by the sectoral teams, it was imperative that many financial considerations be evaluated concerning capital costs, environmental studies, operation and maintenance, interest rates and available funding. It was the role of the finance team to analyze the various projects based on their area of impact, number of people affected, total cost of the project and the level of priority. A thorough analysis of these factors, in conjunction with the financial circumstances of each project, is what the finance team has used to determine which projects would be selected. The costs of the projects selected have been financed using foreign and domestic sources of funding, including foreign direct investment (FDI), foreign aid, development bank assistance and the Dominican government’s national budget. For each project, financing is assured only for the 5-year period of the environmental plan for Santo Domingo proposed in this paper.
10.2. Proposed Projects in the 5-Year Environmental Plan
The various projects funded here have been proposed to alleviate the environmental problems in various sectors of Santo Domingo. These have been selected from a larger number of projects that have been considered by the six sectoral teams (i.e., poverty alleviation, water, solid waste, industry, transportation and energy) during the research and analysis process of developing the 5-year environmental plan for Santo Domingo.
10.3. Process
The finance team first evaluated the Dominican Republic’s overall government budget, foreign direct investment (FDI) and foreign aid. Then, it estimated how much of the national budget would go towards Santo Domingo and projected that for the years 2019 to 2023. Each sector’s budget was first compared to the estimated Santo Domingo budget. Then, if there was still a need for funds, FDI and foreign aid were considered.
10.4. Sources of Funds
10.4.1. Foreign Direct Investment
Foreign Direct Investment (FDI) is a reliable source of international funding in the Dominican Republic, which has become one of the main recipients of FDI in the Caribbean and Central America (Investment Climate Statements in 2018, 2018.). FDI is defined as an investment made by a company or individual in one country in business interests in another country, in the form of either establishing business operations or acquiring business assets in the other country, such as ownership or controlling interest in a foreign company.
These investments are determined by the economic and political situation of the country. FDI has played a role in the Dominican Republic’s transition from a commodity export heavy economy to one based on basic manufacturing and services (Investment Policy Review of the Dominican Republic, 2009). Tourism has led in FDI and is projected to continue to increase with the government’s goal to double the number of tourists coming into the country from 5 million 1n 2015 to 10 million by 2022 (Ibid.). Spain has historically dominated the tourism sector with the building of hotels. Spanish investors were the first to bring a hotel chain - the Barceló - to the republic with 19 hotels in total (Ibid.) (Table 3).
Table 3. Foreign direct investment from top ten countries in the Dominican republic, 2016-2018.
Source: Banco Central de la Republica Dominica (2018). Flujos de la Inversión Extranjero Directa por Actividad Económica.
10.4.2. Foreign Aid
Foreign aid is also another main source of funding for the Dominican Republic. The Development Assistance Committee (DAC) of the Organization for Economic Cooperation and Development (OECD) defines Official Development Assistance (ODA) as, “government aid that promotes and specifically targets the economic development and welfare of a developing country.” OECD has considered ODA the “gold standard” of foreign aid since 1969, and it remains the main source of financing for development aid (Official Development Assistance (ODA), 2018).
The finance team determined the country’s partners, the sector or sectors relevant to each partner, and their related foreign aid agencies. Consequently, the foreign aid agencies and development banks cited in this report are the ones related to the sectors that were analyzed in previous chapters, i.e., poverty alleviation, water, solid waste, industry energy and transportation.
Among the top ten donors of gross ODA (see Exhibit 38), Korea, Japan, and Germany provide aid in the relevant sectors. Korea’s development agency, KOICA, averaging $14.2 million USD in ODA, focuses its development efforts around a few priority sectors, including health, community development, transportation and telecommunications. Japan’s development agency, JIKA, averaging about $9.8 million USD in ODA, focuses its assistance on poverty reduction (mitigating disparities), improving industrial competitiveness and environmental conservation. Germany’s development agency, KFW DEG, participates heavily in solar and renewable energy (Figure 33).
The recipient sectors of bilateral ODA (see Figure 34) relevant to the sectors of the 5-year environmental plan for Santo Domingo include: other social infrastructure (32%), economic infrastructure (10%), multi-sectors (11%) and production (3%). In addition to bilateral gross ODA, there is funding from multilateral organizations. The total amounts listed in Exhibit 39 below include bilateral ODA, multilateral funding and private funding. The most funding can be found in the Regional Development Banks ($357 million USD) and the least in the Global Fund ($6.5 million USD).

Figure 33. Top ten donors of Gross ODA for Dominican republic, 2015-2016 averages. Source: OECD-DAC http://www.oecd.org/dac/financing-sustainable-development/development-finance-data/aid-at-a-glance.htm.

Figure 34. Bilateral ODA by Sector for Dominican republic, 2015-2016 average. Data Source: OECD-DAC http://www.oecd.org/dac/financing-sustainable-development/development-finance-data/aid-at-a-glance.htm.
Development banks are defined as, “national or regional financial institutions designed to provide medium- and long-term capital for productive investment, often accompanied by technical assistance, in poor countries” (Brittanica, 2017). Development banks make loans to public or private bodies, or alongside other financial institutions, although they are best known for promoting and securing private investment (Ibid.). The largest and most prominent is the World Bank, and the relevant other development banks for the Dominican Republic are the Inter-American Development Bank and the Caribbean Development Bank.
Since it was established in 1959, the Inter-American Development Bank (IDB) has been a leading source of long-term financing for economic, social and institutional development in Latin America and the Caribbean (Inter-American Development Bank, December 2016). For example, with $750 million USD in resources from IDB and $150 million USD from the Brazilian Development Bank (BNDES), Brazil was able to bolster long- term credit to finance renewable energy and energy efficiency (Ibid.). Yet, according to IDB president Luis Alberto Moreno, the private sector plays a crucial role in securing investment (Ibid.).
10.5. The Government Budget
The government budget is based on both tax revenue and Gross Domestic Product (GDP), as well as expenditures. Therefore, in approaching the amount of funds available from this source, the finance team analyzed the proposed budget report by the Department of Budget and Management for 2017 for all the Dominican Republic. The team determined how much total money is available, and then broke it down into how much is available for each sector from which Santo Domingo would draw.
10.5.1. Government Income
To analyze government income from 2019 to 2023, the finance team looked at GDP data and tax revenue records to estimate government income for Santo Domingo.
1) Gross Domestic Product
The Gross Domestic Product of the Dominican Republic has grown significantly from 2012 to 2017, with the value rising from $60.75 billion USD to $76.09 billion USD. In Exhibit 7.6, the IMF projects the country’s GDP from 2018 to 2022. The GDP value of the Dominican Republic represents 0.12% of the world economy. The GDP of the Dominican Republic averaged $19.34 billion USD from 1960 until 2017, reaching an all-time high of $76.09 billion USD in 2017, with a record low of $0.65 billion USD in 1961. The International Monetary Fund (IMF) has projected the country’s GDP until 2022, which is summarized in Figure 35.
2) Government Tax Revenue
The report by the World Bank, Gearing up for a More Efficient Tax System in the Dominican Republic, proposes alternatives to improve the efficiency of the nation’s tax system to support the government in its efforts to increase public revenue and to promote inclusive growth and a competitive business climate. These options include better policies to increase tax revenue, better targeting of fiscal spending to benefit the poorest, and an increase of the tax base (World Bank, n.d.).

Figure 35. Dominican republic GDP in Current Prices from 2012 to 2022 (in billion USD) in 1961). Source: IMF, 2018 https://www.statista.com/statistics/527457/gross-domestic-product-gdp-in-dominican-republic/.
The report notes that losses in tax collection caused by fiscal evasion, fraud, and poor management of the Transfer of Industrialized Goods and Services Tax (ITBIS, in Spanish), are among the largest in Latin America and the Caribbean. The diagnosis recalls that the Dominican Republic is following an exemplary growth trajectory compared to its regional neighbors.
However, tax revenues between 2004 and 2014 represented, on average, 13.4% of GDP, which is below the 14.3% regional average. In 2016, total revenue only reached 14.6% of GDP, well below the 2007 high of 16.6% and the revenues from several comparable countries in the region with a lower per capita GDP.
10.5.2. Government Budget Expenditures
The General Budget Directorate (Dirección General de Presupuesto - DIGEPRES) of the Dominican Republic is the institution responsible for the management of the national budget after annual congressional approval.
According to this institution, for 2018, the Government of the Dominican Republic had a total budget of $13,854 million USD ($692,728 million RD). From this budget, the government will spend $6511 million USD ($327,609 million RD) for social services, $2185 million USD ($109,969 million RD) for general services, $2485 million USD ($125,021 million RD) for economic services, and $2286 million USD ($115,017 million RD) for debt burden (DIGEPRES, 2018). However, DIGEPRES estimates that debt payments will decrease more each year, so there will be additional available funding in the budget for both social and economic services (Ibid.). The General Budget Directorate (Dirección General de Presupuesto, DIGEPRES) of the Dominican Republic is the institution responsible for the management of the national budget after annual congressional approval.
Dominican Republic GDP-Composition by Sector
Exhibit 41 shows where production took place in the Dominican economy in 2017. The distribution gives the percentage contribution of agriculture, industry and services to total GDP. Agriculture includes farming, fishing and forestry. Industry includes mining, manufacturing, energy production and construction. Services cover government activities, communications, transportation, finance and all other private economic activities that do not produce material goods (Table 4).
To estimate the budget for the city of Santo Domingo, the finance team made the following assumptions: 1) the GDP projections in Table 4 made by the IMF
Table 4. GDP breakdown by major economic sector in 2017.
Source: https://www.one.gob.do/economicas/cuentas-nacionales.
have a 95% degree of confidence; 2) the contribution to the Santo Domingo’s GDP by economic sector will follow the same trend for the next five years; 3) the city that has the most inhabitants in the Dominican Republic is Santo Domingo, and its population represents 25% of the total population; 4) the population of Santo Domingo will increase for the next five years at the rate of 1% per year, and 5) the share of the national budget considers the number of inhabitants of each city to identify which areas need more facilities and projects for development.
Consequently, the finance team projected the budget for the next five years for the city of Santo Domingo in Exhibit 42. It considered 1) the projection of national GDP for the next five years, 2) the trends in the contribution of each sector to GDP and 3) a population on Santo Domingo representing 25% of the total population of the Dominican Republic (Table 5).
10.5.3. Foreign Direct Investment
The amount of Foreign Direct Investment (FDI) available to Santo Domingo was calculated as follows. The finance team used the average growth rate of total FDI flows from 2015 to 2018 and the average population growth rate and population share of Santo Domingo (25%) to project Santo Domingo’s total FDI flows for 2019 to 2023. The projection for each individual sector was calculated using its average percent contribution to total FDI. Thus, Santo Domingo is projected to receive $5.0449 billion USD in FDI over the five years from 2019 to 2023. Of that total, $1.7522 billion USD is relevant to three of the sectors of this report: Industry, Energy and Transportation. The figures are summarized in Table 5.
Table 5. 2019- 2023 Projections of national budget for Santo Domingo project sectors.
Notes: 1) Improvements in drinking water and sanitation. Water and sanitation management and new infrastructure: water treatment plants and solid waste management; 2) Include the expansion and repair of road infrastructure, all type of improve in public transport including the transportation services; 3) It includes the budget for the following industries: food, beverages and tobacco, manufacturing and construction; 4) It includes the annual budget of the National Institute of Hydraulic Resources, the construction of the Dam “Monte Grande”, and the rehabilitation and complementation of the Dam “SabanaYegua”, Construction of Irrigations Systems and Program of Culture of Water; 5) It includes the budget for promote the use of alternative energy, the Improvements of the National Electric distributions system, the program for produce Ethanol, and the total expenses in economic services in Energy and Fuels. Source: Prepared by Laura Mendez and Cintya Aguirre, 2019.
10.5.4. Foreign Aid
Foreign aid for Santo Domingo was calculated using the OECD breakdown by sector of Bilateral ODA Commitment 2015-2016 averages (OECD, 2018) and multiplying them by the Santo Domingo population share (0.25). This was not projected over the 2019-2023 time span for various reasons. These include that 1) amounts have been fairly consistent every year without much growth overall; 2) most of the project sector’s budget will be covered by the government budget; thus, most of the foreign aid would just be an additional source; energy would have access to the most foreign aid ($10.8 million USD), and transportation the least amount of foreign aid available ($0.05 million USD) (Table 6 and Table 7).
10.6. Results
Table 7 compares each project sector’s proposed budget (or what would still be needed after finding its own funding) to the Santo Domingo budget. On the left-hand side, each color indicates additional funding: foreign investment, foreign aid, private investment. The budgets highlighted in green indicate budgets that could be fully covered by the Santo Domingo budget. This includes solid waste, water and transportation.
The initiatives of industry would be better funded privately or with foreign investment. The Santo Domingo budget encompasses 33% of the investment in
Table 6. Santo Domingo foreign direct investment projections 2019-2023 (in million USD).
Source: Calculated by Laura Mendez and Cintya Aguirre, 2019.
Table 7. Bilateral ODA commitments by sector for Santo Domingo (in million USD).
(1) Used Dominican Republic Country Average and not the calculated Santo Domingo estimate. *Amount is calculated multiplying the Dominican Republic averaged amounts by Santo Domingo population factor (0.25). Source: Calculated by Laura Mendez and Cintya Aguirre, 2019.
the initiatives the industry team proposed as well as funding for the construction of the buildings. The $6.38 million USD still unaccounted for in the industry budget set by the Santo Domingo budget would be covered by the tourism ministry as the government has a given high priority to initiatives that bring business and tourism to the country. These are upfront costs and would be distributed in the first three years.
The energy team indicated that its budget would be fully covered, assuming that the two currently proposed coal-fired power plants would be replaced by solar power arrays. Much of its funding would also be private investment gathered by development banks such as the IDB.
The energy sector would benefit from impact investment. The poverty alleviation team’s project in slum upgrading would be part of an existing UN project; thus, it would have funding for the first four years. To finance the fifth year, the sector could look to development banks such as the IDB group. The team’s Elemental Housing Project could be funded fully by impact investment facilitated by the IDB as it has funded similar projects previously. Since the finance team has been working closely with the sectoral teams and advising them of the available funds, it helped enable them to make sound proposals.
10.7. Summary
Several sector teams have identified potential collaborations as some of their projects complement each other or are similar, thus making financing more efficient and affordable. For example, the energy team assumes that if it can make a case to replace the proposed two coal-fired power plants with solar arrays, it would save two-thirds of the funding allocated to the two power plants. That money could be redirected to fund some of the energy team’s other projects, the water team’s project to upgrade its infrastructure and the transportation team’s project to repair the sidewalks.
The water team and the solid waste team both want to develop a school curriculum for students and their families about water quality and waste management (i.e., recycling).
The proposed budgets of the water, solid waste and transportation teams could all be covered by the projected Santo Domingo budget, and the solid waste team’s budget makes up less than 10% of the Santo Domingo budget for four out of the five years of the plan period, and still less than half for the other year. For the transportation and water teams, their budgets only make up less than half of a percent of the Santo Domingo budget.
The reason for their very large Santo Domingo budgets is the fact that there are large projects already being implemented (e.g., construction of a new wastewater treatment plant, the addition of new Metro lines, etc.). The available money for the projects of these teams in the government budget might be a lot smaller than projected, but it should still be enough. In case that more than the government budget is needed, the solid waste and water sectors have an estimated yearly amount of $5.9 million USD available in foreign aid. Compared to the transportation team’s proposed budget, there is more than enough potential funding in foreign aid and FDI to supplement the government budget.
The projects of the industry, energy and poverty alleviation teams would depend mostly on private investment, FDI and foreign aid. Tourism would receive the most Foreign Direct Investment; it would account for 28% of the total FDI. Industry would also be able to pull funding from FDI.
The sector that requires the most funding would be the energy sector. It would rely heavily on the following sources - the World Bank and the Inter-American Development Bank and private investment, although the government does have some money in its budget in case extra financing is necessary. With its proposed cost savings, however, the energy team believes this sector would be able to help finance other sectors (Table 8).
Table 8. Comparisons of Budget Projections 2019-2023 (In million USD).
Notes: (1) Budget will be covered by IDB funds, World Bank and the redirected funds and left-over funds from the replacement of the coal power plant with the solar plant; (2) The budget assignment for poverty and alleviation comes from different ministries; thus, a specific budget was not determined. Budget will be covered by foreign aid sources. Source: Prepared by Laura Mendez and Cintya, Aguirre, 2019.
11. Concluding Remarks
The intent of this project was to bring the contemporary thinking and practice of Urban Environmental Management to the solution of real problems in Santo Domingo, the largest city in the Caribbean. The objective was to replicate as much as possible the conditions under which a team of expatriate consultants would operate in this context so that they could develop ideas and procedures that fit the circumstances they would likely confront as professional planners working on such projects for international development banks (e.g., the World Bank, the Inter-American Development Bank (IDB) or the Caribbean Development Bank), multilateral donors in the United Nations system such as the United Nations Development Program (UNDP), the Food and Agricultural Organization (FAO), the Industrial Development Organization (UNIDO) or HABITAT, as well as the numerous bilateral donors of the developed countries, which are primarily known by the alphabet soup of their initials (USAID, JICA, SIDA, CIDA, GTZ, DANIDA, NORAD, AFD, etc.). Major countries include the United States, Japan, Canada, Australia, United Kingdom, Germany, France, the Netherlands, Belgium, Switzerland, Sweden, Denmark, Norway, Finland, Italy and Spain. Projects funded by these institutions, agencies and countries are carried out not only by consulting firms from the donor countries names, but increasingly from countries such as Brazil, India, China and Korea as well, and the staffs of experts they provide come from many of the countries named (Edelman, 2014; Edelman, 2018).
In this working environment, it was instructive for the students to formulate a 5-year plan of solutions to the environmental problems and issues they faced rather than being told how to deal with them. This expanded their analytical skills and taught them how to utilize the limited knowledge and resources available to come up with implementable solutions for the benefit of the people of Santo Domingo. They learned that such skills are transferable to other projects, and they gained a greater appreciation of the skill set that they are developing as planners (Edelman, 2016). Bringing the reality of development to the classroom and asking students to confront it gives them an appreciation of professional practice that the study of theory alone does not. Consequently, this project has attempted not only to expand the education of graduate student, but also to provide a meaningful contribution to planning pedagogy (Edelman, 2015).
Conflicts of Interest
The author declares no conflicts of interest regarding the publication of this paper.
Cite this paper
Edelman, D. J. (2019). Managing the Urban Environment of Santo Domingo, the Dominican Republic. Current Urban Studies, 7, 76-142. https://doi.org/10.4236/cus.2019.71005
References
- 1. Abreu, I. et al. (2018). Analisis del Medio Ambiente Urbano Santo Domingo. Pontificia Universidad Católica Madre y Maestra (PUCMM). [Paper reference 1]
- 2. Age Fotostock. Cathedral of Santa Maria la Menor 1514. UNESCO World Heritage Site. Agence Francaise de Developpement (AFD) (22 May 2018). Launch of the First Cable Car Service in the Carribbean. https://www.afd.fr/en/launch-first-urban-cable-car-service-caribbean [Paper reference 1]
- 3. Angel, S. (January 2001). Housing Policy in the Dominican Republic: Diagnosis and Guidelines for Action. New York: Inter-American Development Bank. [Paper reference 1]
- 4. Banco Central de la Republica Dominica (2018). Flujos de la Inversión Extranjero Directa por Actividad Económica. [Paper reference 1]
- 5. Barros, C. D. (2016). Travel Information about Punta Cana, Hotel, City Transport, Map, Sightseeing, Airport, Health and Security. Accessed 11 November 2018. [Paper reference 1]
- 6. Berke, J. (8 May 2018). One Simple Chart Shows Why an Energy Revolution Is Coming—And Who Is Likely to Come out on Top. https://www.businessinsider.com/solar-power-cost-decrease-2018-5/html/ [Paper reference 1]
- 7. Britannica (2017). Development Bank. https://www.britannica.com/topic/development-bank [Paper reference 1]
- 8. Britannica (2019). Santo Domingo. https://www.britannica.com/topic/santo-domingo [Paper reference 2]
- 9. Bus-OMSA (23 June 2014). https://vanguardiadelpueblo.do/2014/06/23/resolver-el-caos-del-transito-una-prioridad-nacional/bus-omsa/
- 10. California Energy Commission (2018). California ISO Glossary. https://www.energy.ca.gov/glossary/ISO_GLOSSARY.PDF [Paper reference 1]
- 11. Castillo, K. (29 June 2018). Teleferico de Santo Domingo. https://telefericodesantodomingo.wordpress.com/ [Paper reference 1]
- 12. Cavallo, E., & Powell, A. (2018). A Mandate to Grow (pp. 1-121). Inter-American Development Bank. https://publications.iadb.org/bitstream/handle/11319/8805/2018-Latin-American-and-Caribbean-Macroeconomic-Report-A-Mandate-to-Grow.pdf?sequence=1&isAllowed=y [Paper reference 1]
- 13. Checkoutsam (7 April 2016). Check out Sam: Travel Guide and Info for Santo Domingo, DR. https://www.checkoutsam.com/location/dominican-republic/santo-domingo/ [Paper reference 1]
- 14. CIA (2018). Dominican Republic. https://www.cia.gov/library/publications/the-world-factbook/geos/dr.html [Paper reference 1]
- 15. Corporación del Acueducto y Alcantarillado de Santo Domingo—CAASD (2018). Cunidad (n.d.). https://www.diariolibre.com/actualidad/ciudad/duquesa-un-vertedero-fuera-de-control-HA7471823 [Paper reference 2]
- 16. Diario, L. (17 March 2017). Uber anunciaservicio de motoconcho con tarifadesde RD$20. https://listindiario.com/la-republica/2017/03/17/458071/uber-anuncia-servicio-de-motoconcho-con-tarifa-desde-rd-20 [Paper reference 1]
- 17. Diario Libre (17 November 2014). El reciclajeen República Dominicanamuevemás de US$100 millones al ano. https://www.diariolibre.com/actualidad/el-reciclaje-en-repblica-dominicana-mueve-ms-de-us100-millones-al-ao-DIDL885071 [Paper reference 1]
- 18. Diario Libre (2018). República Dominicana, indefensa ante eventos climáticos. https://www.diariolibre.com/actualidad/medioambiente/republica-dominicana-indefensa-ante-eventos-climaticos-BM916542/html/ [Paper reference 1]
- 19. Diario Libre (22 February 2017). Uber suma servicio de motoconcho en República Dominicana. https://www.diariolibre.com/actualidad/ciudad/uber-suma-servicio-de-motoconcho-en-republica-dominicana-KB6366639 [Paper reference 1]
- 20. Díaz, K. (30 June 2017). Duquesa, un vertedero fuera de control. https://www.diariolibre.com/noticias/ciudad/duquesa-un-vertedero-fuera-de-control-HA7471823 [Paper reference 1]
- 21. Digital Bus Stop (2018). https://www.connectpointdigital.com/digital-bus-stop/ [Paper reference 1]
- 22. Digital Marketing Specialist (2018). https://www.glassdoor.com/Job/jobs.htm?suggestCount=0&suggestChosen=false&clickSource=searchBtn&typedKeyword=digitalmarketingspecialist&sc.keyword=digitalmarketingspecialist&locT=C&locId=2691756&jobType= [Paper reference 1]
- 23. Dirección General de Presupuesto—DIGEPRES (2018). http://www.digepres.gob.do/?page_id=7945 [Paper reference 1]
- 24. Dominican Republic Inflation Rate (December 2018). https://tradingeconomics.com/dominican-republic/inflation-cpi [Paper reference 1]
- 25. Dominican Today (16 July 2015). Biggest Dominican Landfill Has Only 7 Years of Life Left, Contractor Warns. Dominican Today. https://dominicantoday.com/dr/economy/2015/07/16/biggest-dominican-landfill-has-only-7-years-of-life-left-contractor-warns/ [Paper reference 1]
- 26. Edelman, D. J. (Ed.). (February 2015). Managing the Urban Environment—Lagos, Nigeria. Saarbrücken: LAP LAMBERT Academic Publishing. [Paper reference 1]
- 27. Edelman, D. J. (Ed.). (January 2014). Managing the Urban Environment—Mysore, India. Saarbrücken: LAP LAMBERT Academic Publishing. [Paper reference 1]
- 28. Edelman, D. J. (Ed.). (January 2016). Managing the Urban Environment—Manila, the Philippines. Saarbrücken: LAP LAMBERT Academic Publishing. [Paper reference 1]
- 29. Edelman, D. J. (Ed.). (January 2018). Managing the Urban Environment—Lima, Peru. Saarbrücken: LAP LAMBERT Academic Publishing. [Paper reference 1]
- 30. Edelman, D. J., Schuster, M., & Said, J. (2017). Urban Environmental Management in Latin America, 1970-2017. Current Urban Studies, 5, 305-331. [Paper reference 1]
- 31. Environmental Protection Agency—EPA (June 2014). Municipal Solid Waste Landfills: Economic Impact Analysis for the Proposed New Subpart to the New Source Performance Standards. https://www3.epa.gov/ttnecas1/regdata/EIAs/LandfillsNSPSProposalEIA.pdf [Paper reference 1]
- 32. Fleming, K. (2009). The Economics of Cacao Production in Kona. AgriBusiness, 17, 1-12. https://www.ctahr.hawaii.edu/oc/freepubs/pdf/AB-17.pdf [Paper reference 1]
- 33. GDP (Current US$) (2018). https://data.worldbank.org/indicator/NY.GDP.MKTP.CD?end=2017&locations=DO&start=1960&view=chart [Paper reference 1]
- 34. General Kinematics (15 January 2014). The Cost of Starting a Full Force Recycling Program. https://www.generalkinematics.com/blog/cost-starting-full-force-recycling-program/ [Paper reference 1]
- 35. Global Energy Network Institute (n.d.). National Energy Grid. [Paper reference 1]
- 36. GoDominicanRepublic (2018). Moversepor República Dominicana. http://www.godominicanrepublic.com/es/travel-to-dr/moverse-por-republica-dominicana/ [Paper reference 1]
- 37. Goodrich, A. (10 October 2011). Solar PV Manufacturing Cost Analysis: U.S. Competitiveness in a Global Industry. https://www.nrel.gov/docs/fy12osti/53938.pdf [Paper reference 1]
- 38. Graner Family (30 March 2017). Walking in Santo Domingo. https://granerfamily.org/2017/03/30/walking-in-santo-domingo/ [Paper reference 2]
- 39. Guerra, A. (4 March 2018). Transportation in Dominican Republic: How to Get Around. https://www.iheartdr.com/transportation-dominican-republic/ [Paper reference 1]
- 40. Guide to Public Transportation in Cabarete (25 April 2018). https://villataina.com/public-transportation-cabarete/ [Paper reference 1]
- 41. Holschuh, A. (16 April 2018). Dominican Republic Shares Strong Tourism Numbers and Plans for Continued Growth. https://www.globenewswire.com/news-release/2018/04/16/1472369/0/en/Dominican-Republic-Shares-Strong-Tourism-Numbers-and-Plans-for-Continued-Growth.html [Paper reference 2]
- 42. Hoy Digital (18 October 2017). Vertedero de Duquesa representa “altos costos” para el Estado. http://hoy.com.do/vertedero-de-duquesa-representa-altos-costos-para-el-estado/ [Paper reference 1]
- 43. IMF (2018). https://www.statista.com/statistics/527457/gross-domestic-product-gdp-in-dominican-republic/ [Paper reference 1]
- 44. Index Mundi—Country Facts (n.d.). https://www.indexmundi.com/html/ [Paper reference 1]
- 45. Informal Settlements in the La Cienaga Neighborhood of Domingo Savio. https://arquitexto.com/2018/05/nuevo-domingo-savio/ [Paper reference 1]
- 46. Inter-American Development Bank. (December 2016). Brazil to Push Private Investment in Clean Energy with $750 Million in IDB Resources. https://www.iadb.org/en/news/news-releases/2016-12-15/investment-in-renewable-energy-in-brazil%2C11690.html [Paper reference 1]
- 47. Investment Policy Review of the Dominican Republic (2009). United Nations. [Paper reference 1]
- 48. Josh, J. (Ed.) (2016). Current Affairs November 2016 eBook (p. 93). [Paper reference 1]
- 49. Karasz, P. (3 July 2018). Wave after Wave of Garbage Hits the Dominican Republic. https://www.nytimes.com/2018/07/23/world/americas/dominican-republic-garbage.html [Paper reference 1]
- 50. Land, Boca Chica (2018). https://global.remax.com/Land-For-Sale-BOCA-CHICA-Santo-Domingo_1052001003-1679?LFPNNSource=GlobalSearch&cKey=1052001003-1679 [Paper reference 1]
- 51. Lauren (11 June 2014). Wanderlust Dominican Republic. http://wanderlustdr.blogspot.com/ [Paper reference 1]
- 52. Mejía, K. D. (5 July 2016). https://www.diariolibre.com/actualidad/ciudad/el-dilema-de-la-metropolis-que-hacer-con-la-basura-FY4247997 [Paper reference 1]
- 53. Myers, G. N. (21 May 2014). Dominican Republic Tops in Caribbean Tourism and Growing. https://www.travelweekly.com/Caribbean-Travel/Dominican-Republic-tops-in-Caribbean-tourism-and-growing [Paper reference 1]
- 54. Nature Conservancy (2018). [Paper reference 1]
- 55. Navarez, A. (16 November 2015). Latin America’s Expanding Wealth Gap. https://www.worldpress.org/article.cfm/latin-america-expanding-income-inequality [Paper reference 1]
- 56. OEC (2018). https://atlas.media.mit.edu/en/profile/country/dom/ [Paper reference 1]
- 57. OEC (n.d.). Dominican Republic. https://atlas.media.mit.edu/en/profile/country/dom/html/ [Paper reference 1]
- 58. OECD (2018). Official Development Assistance (ODA). [Paper reference 1]
- 59. OECD-DAC. http://www.oecd.org/dac/financing-sustainable-development/development-finance-data/aid-at-a-glance.htm [Paper reference 1]
- 60. Oliver, C. (30 May 2018). Update: Korean Solar Company Bringing 500-Plus Jobs to Dalton; Plant to Be Built in Carbondale Business Park. https://www.dailycitizen.news/news/local_news/update-korean-solar-company-bringing--plus-jobs-to-dalton/article_fe67e52a-640e-11e8-9803-93c0d3c0a17c.html [Paper reference 1]
- 61. OMSA (2018). http://www.omsa.gob.do/index.php/sobre-nosotros-m [Paper reference 2]
- 62. Páez, W. (9 September 2018). Tras salida de recolectora SDN luce con mucha basura. https://www.diariolibre.com/actualidad/ciudad/tras-salida-de-recolectora-sdn-luce-con-mucha-basura-EE10722464 [Paper reference 1]
- 63. Pinto Tours (2016). Driving in Santo Domingo and Punta Cana. http://pintotours.net/Americas/DomRepublic/drivingStoDom.html [Paper reference 1]
- 64. Quinta Monroy/ELEMENTAL (31 December 2008). https://www.archdaily.com/10775/quinta-monroy-elemental/html/ [Paper reference 1]
- 65. Rosa, A. D. (27 April 2018). Duquesa requiere que cabildos del Gran Santo Domingo paguen más por tonelada de residuos que depositan. https://www.diariolibre.com/actualidad/ciudad/duquesa-requiere-que-cabildos-del-gran-santo-domingo-paguen-mas-por-tonelada-de-residuos-que-depositan-ID9731318 [Paper reference 1]
- 66. Rosario, P. (9 September 2015). Teleférico Santo Domingo. https://www.youtube.com/watch?time_continue=238&v=iACgM14m4FU [Paper reference 1]
- 67. Ross, K. (31 March 2016). Solar PV Plant Inaugurated in Dominican Republic. https://www.powerengineeringint.com/articles/2016/03/solar-pv-plant-inaugurated-in-dominic-republic.html/ [Paper reference 1]
- 68. Santo Domingo Water Fund (2017). [Paper reference 1]
- 69. Schwandl, R. (2014). Santo Domingo. http://www.urbanrail.net/am/sdom/santo-domingo.htm [Paper reference 1]
- 70. SmartStop (n.d.). https://smartstopselfstorage.com/ [Paper reference 1]
- 71. Spanberg, E. (12 November 2018). Final OK near for $115 Million Convention Center Expansion, Renovation. https://www.bizjournals.com/charlotte/news/2018/11/12/final-ok-near-for-115-million-convention-center.html [Paper reference 2]
- 72. Special Economic Zones in the Dominican Republic: Policy Consideration for a More Competitive and Inclusive Sector (2016). World Bank Group, 1-34. [Paper reference 2]
- 73. Taxi in Dominican Republic (n.d.). https://www.visitdominicanrepublic.org/taxi-in-dominican-republic [Paper reference 1]
- 74. The Gondola Project (27 February 2018). http://gondolaproject.com/category/installations/teleferico-de-santo-domingo/ [Paper reference 1]
- 75. Times of India (4 April 2015). https://timesofindia.indiatimes.com/city/indore/Waste-to-energy-plant-hits-installation-cost-bump/articleshow/46803287.cms [Paper reference 1]
- 76. Transporte Publico y Movilidad Urbana en el Gran Santo Domingo [PDF] (2017). Observatorio de Politicas Sociales y Desarrollo. [Paper reference 2]
- 77. Travel and Tourism Economic Impact 2018 Dominican Republic (Rep.) (2018). World Travel and Tourism Council Website. https://www.wttc.org/-/media/files/reports/economic-impact-research/countries-2018/dominicanrepublic2018.pdf [Paper reference 1]
- 78. Uber (2018). Uber Moves Santo Domingo. https://www.uber.com/cities/santo-domingo/ [Paper reference 1]
- 79. Uber moto llegó a República Dominicana (16 March 2017). http://www.traslashuellasdigital.com.do/2017/03/16/uber-moto-llego-a-republica-dominicana/ [Paper reference 1]
- 80. UNESCO (March 2017). Road Safety Performance Review: Dominican Republic. https://www.unece.org/fileadmin/DAM/trans/roadsafe/unda/RSPR_DR_April_2018.pdf [Paper reference 1]
- 81. UN-Habitat (2013). The Challenge of Slums. The State of the World Cities Report 2012/13. Refer to Issue Paper No. 9 on Land for “Security of Tenure” Definition. [Paper reference 1]
- 82. United Nations Department of Economic and Social Affairs/UNESA (2017). World Population Prospects: The 2017 Revision. Population Division. [Paper reference 1]
- 83. University of Sheffield (2015). Leaky Pipes Can Allow Contaminants into Our Drinking Water. ScienceDaily. https://www.sciencedaily.com/releases/2015/06/150607214248.htm [Paper reference 1]
- 84. USAID (2001). Dominican Republic Environmental Assessment. Tellus. http://usaid.gov/dr/docs/resources/dr_environmemt_assessment092001.pdf [Paper reference 1]
- 85. Watson, L. (21 September 2017). Hurricane Maria: Storm Lashes Dominican Republic after Puerto Rico Is “Obliterated”. https://www.telegraph.co.uk/news/2017/09/21/hurricane-maria-storm-century-lashes-dominican-republic-direct/ [Paper reference 1]
- 86. World Bank (n.d.). Gearing up for a More Efficient Tax System in the Dominican Republic. [Paper reference 1]
- 87. Yen, T.-H. (2016). An Economic Impact Study of a Convention Center in Northern California. Advanced Tourism Research Globally, 1-7. https://scholarworks.umass.edu/cgi/viewcontent.cgi?article=1391&context=ttra http://depaseo.com.do/ http://hotel-riazor.hotelssantodomingo.net/en/html/ http://mapas.cne.gob.do/html/https://alchetron.com/Gazcue/html/https://steemkr.com/art/@anadeleonartista/la-fabrica-contemporanea-parte-ihttps://www.autoevolution.com/news/renault-to-build-europes-largest-ev-battery-energy-storage-facility-128893/html/https://www.one.gob.do/economicas/cuentas-nacionaleshttps://www.powerengineeringint.com/articles/2016/03/solar-pv-plant-inaugurated-in-dominic-republic/html/ [Paper reference 1]