Current Urban Studies
Vol.02 No.04(2014), Article ID:52735,10 pages
10.4236/cus.2014.24033
The Social Dimension of Sustainable Development: Social Inclusion in Tanzania’s Urban Centres
John M. Lupala
School of Urban and Regional Planning, Ardhi University, Dar es Salaam, Tanzania
Email: lupalajohn@yahoo.com
Copyright © 2014 by author and Scientific Research Publishing Inc.
This work is licensed under the Creative Commons Attribution International License (CC BY).
http://creativecommons.org/licenses/by/4.0/


Received 5 October 2014; revised 15 November 2014; accepted 10 December 2014
ABSTRACT
One of the challenges confronting cities in the developing world is social exclusion and marginalization of the poor. This has been observed in terms of large scale informalities in settlements growth, employment and livelihood activities. Inadequate infrastructure, diminishing access to basic services and livelihood opportunities are increasingly precipitating social exclusion in cities. In Tanzania, the policy shift from social welfare to liberal economies is contributing to marginalization and subsequently, exclusion of poor households in accessing basic services. This paper discusses the social dimension of sustainability viewed from social inclusion point of view. Eight major urban centres in Tanzania are being examined. The data collection methods included household interviews, review of documents, workshops and group discussion. Results show that with the exception of access to education and health services, cities are poorly performing in terms of access to water supply, income versus cost of living, employment, services to the handicapped and ownership of properties by sex. Quality of life elements such as sanitation and urban informality also remains below average. While informality in cities accounted for 66 percent (in terms of built up areas), access to onsite potable accounted for only 36.9 percent. On the bases of these findings, it is recommended that strategies such as cross subsidization and addressing informalities should be developed and implemented with a view to ensuring social inclusion in cities.
Keywords:
Social Sustainability, Social Inclusion, Informality, Basic Services, Tanzania

1. Introduction
Although sustainable development as a concept has been debated from varying perspectives and more for many years, theoretical and empirical discussion on social sustainability has been lagging behind. Dempsey et al. (2009) for example assert that the meaning of social sustainability is yet to be clearly defined or agreed upon. They view this concept in relation to “sustainable communities” and social cohesion. They define socially sustainable communities as places where people want to live and work, now and in the future. These are places where people meet their diverse needs of existing and future requirements, sensitive to their environment and contribute to a high quality of life. Such places are safe and inclusive, well planned, built and run, and offer equality of opportunity and good services for all (Dempsey, et al. 2009) . Other authors have defined social sustainability as a concept that focuses on the personal assets like education, skills, experience, consumption, income and employment (Omann & Spangenberg, 2002) . They view social sustainability under access to social processes and benefits including the right to a dignified standard of living for all citizens. Social sustainability should comprise citizen’s right to actively participate in societal issues including education to support life-long learning opportunities (ibid.). As a means to assess social sustainability, (Omann & Spangenberg, 2002) have defined the criteria include; self-determined lifestyle including a mix of paid and informal work for work environment, satisfaction of basic needs, reliable and sufficient social security system, equal opportunities to participate in a democratic society and enabling of social innovation and structuring of work types.
1.1. Social Inclusion or Exclusion in the Context of Sustainability
Social inclusion or exclusion is not a new concept and many authors have attempted to define it, more so, from social perspective. These include: Mathieson et al., (2008); Ladman, (2006); Levitas et al., (2007), Council of Europe (1998) and Gore and Figueiredo (1997). Levitas et al. (2007) define social exclusion as a complex and multi dimensional process, involving the lack or denial of resources, rights, goods and services. It includes the inability to participate in normal relationships and economic, social, cultural or political activities to the majority of the people in a society. Exclusion affects both the quality of life of individuals and the equality and cohesion of society as a whole. Giddens, Duneier and Appelbaum (2006) view social exclusion from processes or mechanisms and as new source of inequality in which people become cut off from involvement in the wider society. People who live in ramshackle housing projects with poor schools and few employment opportunities may effectively be denied opportunities for self-betterment than most people in the society. Giddens, Duneier and Appelbaum (2006) further argue that; “crime rates may be reflecting the fact that growing number of people do not feel valued―or feel they have an investment in the societies in which they live”. Giddens, Duneier and Appelbaum further argue that the growing homelessness is one of the distressing signs of changes of stratification system. Impliedly, the authors point to homelessness as one parameter of social exclusion.
Arguing from city development planning point of view, the UN Habitat (2001) and Goltsman, Susan and Iacofano (2007) define an inclusive city as a city that promotes growth with equity. “It is a place where everyone, regardless of their economic means, gender, race, ethnicity or religion, is enabled and empowered to fully participate in the social, economic and political opportunities that cities have to offer”. In the larger perspective, social equity is one of the three pillars of sustainability, others being participatory planning and decision-making. According to UN-Habitat (2001) ; “inclusive urban governance reduces inequality and social tension; incorporates the knowledge, productivity, social and physical capital of the poor and disadvantaged in city development; and increases local ownership of development processes and programmes”. Viewed from infrastructure and practical point of view, one may extend the argument that; the increasing number of households with limited or no access to potable water supply, electricity and decent houses constitute the major dimensions of exclusion. Limited access to basic services such as quality health and education services also constitute components of social exclusion. Although there are a number of studies on social exclusion in European context, similar discussion are limited from Africa and more specifically in Tanzania. Pertinent questions worth raising are; to what extent are Tanzania cities socially sustainable? Are people enabled or empowered to effectively participate in the social, economic and access basic services in urban areas? Are there any variations in terms of social sustainability among cities? These questions constituted the major points of departure for this paper.
1.2. The Tanzania’s Policy Shift and Its Impact on Social Inclusion
Tanzania has gone through three distinct phases of macroeconomic changes since independence (1961). These changes have had varying impacts on inclusiveness to her people. The first phase spanned between 1961 and mid 1980s. During this phase, Tanzania pursued socialism policy underpinned by the social welfare principles. This policy emphasized equity among its people access to livelihood opportunities, basic services and communal way of living. All citizens were assured of free access to health, education and water supply. Several programmes were implemented towards this goal including the Universal Primary Education for all (UPE of 1974). This policy orientation could not be sustained because of poor economic performance amidst rapidly urbanizing cities. The second economic epoch is a period between 1985 and 1995. This period observed a shift from controlled to liberal economy. It was during this period that the Structural Adjustment Programme (SAP) was implemented. This was characterized by among other changes; retrenchment and freezing of public employment and participation of the private sector in the economy (Ngware et al., 2003) . It was also during this phase that private services provision in education, health, water supply and transport was given more impetus. However, affordability to privately run services by poor households had become an issue during this period. The third phase is the period from 1995 to the present times (2014). The focus has been on sustaining liberal macro-economic policies, restoring fiscal disciplines and creating an institutional base for supporting greater participation of the private sector. All these macro-economic policy changes have contributed in shaping inclusion observable in many cities today.
2. Methodology
This paper is a product of the study that was carried out to examine the state of cities in eight (8) major urban centres of Tanzania between 2010 and 2013. The study focused on identifying the prevailing situation and developing data bases of cities in the thematic areas of governance, sustainability, productivity, safety and security and inclusiveness. These centres included the five cities of Dar es Salaam (comprised of three municipalities of Ilala, Temeke and Kinondoni; in which each municipality was treated as an independent case), Mwanza, Tanga, Arusha and Mbeya and the Municipality of Zanzibar (Map 1).
Data collection process was done through participatory mechanisms whereby city specific teams were established and deployed to collect specific data for each theme based on agreed upon indicators and tools for data collection. For the theme of inclusiveness, the key indicators and data was collected exploring issues related to housing, infrastructure and social services. These included the sub-themes of access to shelter by gender and income category; access to technical infrastructure services such as water connection, solid waste collection and access to buildings by people with physical disabilities. Access to education and health were also considered as sub-themes of social services. Other sub-themes were employment, extent of formality and informality and proportion of income to the cost of living.
Each city team developed a sample size based on 95 percent confidence. This sampling was based on number of houses in each city from where household interviews were conducted. The estimation on number of houses was based on house counts from latest aerial photos of each city (2010). This culminated in sample sizes of 399 houses for IIala, 287 for Temeke, 399 for Kinondoni, 398 for Mwanza, 440 for Tanga, 278 for Arusha, 397 for Mbeya and 395 for Zanzibar Municipality. Household interviews were complemented by spatial data from city specific aerial photos, satellite images and existing plans and maps. Official information was collected from relevant offices for spot and trend data spanning for the period of five years (between 2007 and 2012). At data analysis stage, comparison across cities was done using spreadsheet.
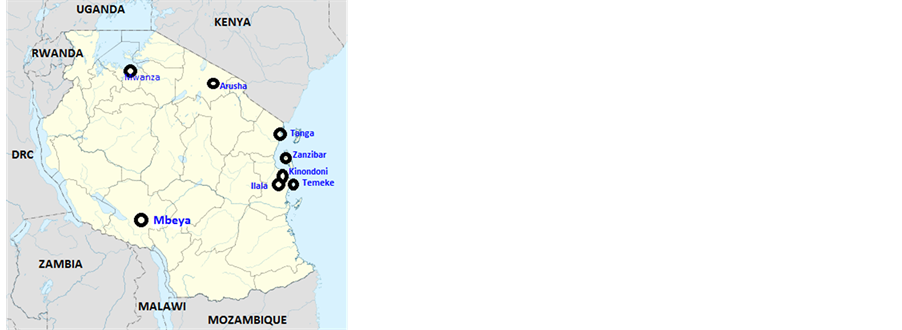
Map 1. Location of major urban centres in Tanzania.
3. Results
Unequal income and livelihood opportunities are the two main underlying factors of urban inequity. They derive from biases in distribution of livelihood opportunities at national level as well as dysfunctions of city structures at the local urban level. In the same vein, absence of policies that adequately address the “poor-rich” divide, usually culminate into socio-spatial disparity and widening gap between and within cities. In this sense, inequity reveals a differentiation in the manner in which resources are allocated and facilities and services accessed. From infrastructure point of view, the increasing number of households with limited or no access to potable water supply, electricity and decent houses have been other view points of exclusiveness. One may extend this argument to include basic social services such as access to quality health and education services. This section provides evidence on most of these items as collected from the eight major urban centres of Tanzania.
3.1. Household Income versus Cost of Living
Household income as a variable of inclusion becomes meaningful when compared to affordability in costs of living. Cost of living in urban areas is a key factor for a household to continue staying or relocating to another place where such costs are more affordable. UN-Habitat (2012) report notes that urban migrants choose to return to their villages due to increased cost of living in towns. As a consequence of the implementation of the Structural Adjustment Programme in 1980s and the decades that followed, there were rising numbers of urban inhabitants who lost their jobs and returned to their villages. Although the majority first tried to create their own (often informal) jobs in cities or towns, for those who failed (as many did), the village was their last resort and return migration was their preferred survival strategy (ibid.). Facing higher cost of living, even employed urban residents at times choose to return to rural areas where incomes may be lower but where food and housing are almost free.
Results from the eight cities and municipalities indicated that household incomes were far below the cost of living. While the average household income across urban centres was revealed to be Tanzanian Shillings (TZS) 282,753 (US$ 177), the average cost of living was Tanzanian Shillings 491,250 (US$ 307).This gives a ratio of 0.58 of income to cost of living. In other words, the average incomes of households were nearly a half of the actual costs of living. The income-cost of living gap or ratio imply that some households have to compromise some of the basic requirements to make their living in urban areas. Cost of living in terms of monthly monetary expenditure on basic goods and services was the highest in Kinondoni and Temeke where on average households were spending TZS 642,500 (US$ 402) per month. It was lowest in Mwanza where average expenditure was observed to be TZS 333,750 (US$ 209). Variations in cost of living per month across these cities are summarised in Table 1. It is also important to note that there was a variation in income-cost of living ratio among cities. For instance, while the income-cost of living ratio in Zanzibar was observed to be 0.9 indicating the small gap in income and cost of living, this ratio was lowest in Kinondoni and Mbeya where each municipality registered a ratio of 0.4. Impliedly, the gap between income and costs of living were significantly high. Variation in cost of living was largely attributed to, among other factors, the geographical differences among cities, service levels and mechanisms for accessing such services, richness in food production from the hinterlands of each city and monetary circulation among and within cities.

Table 1. Average income and cost of living per month.
Source: Household interviews, January 2013.
3.2. Employment Pattern
The main driver of inequity and therefore social exclusion often tends to be differential access to employment as well as to public goods and services. Inequity in this respect reflects biases in the economic realm which effectively concentrate a disproportionate share of resources, services and opportunities in the hands of certain groups or individuals. This includes politicians and mid cadres in government structures who can influence decisions. Access to employment is not only a source of income but also another important redistributive parameter that guarantees inclusiveness in cities. While formal employment is more secure and with secured long term retirement benefits, informal employment is characterized by its temporary nature in terms of space and legality aspects. Social sustainability under informal sector remains questionable. When the pattern of employment (formal and informal employment) was analysed across the eight cities and municipalities, evidence shows that only 39 percent of the work force was engaged in formal employment. This implies that the larger proportion of the labour force was engaged in the informal sector (Figure 1). The highest level of informal employment was found in Kinondoni that accounted for 97 percent, followed by Arusha with 82 percent and Temeke amounting to 80 percent. The highest level of formal employment was noted in Tanga that recorded 64 percent. This pattern of employment also typifies the dominance of informal urbanization in respective cities and municipalities.
The dominance of informal employment is attributed to a number of factors including the impacts of the Structural Adjustment Programme (SAP) that had massive impact on retrenchment of government employees in the late 90s, lack of requisite skills and training limiting employability of some people, rapid urbanization that is not pairing with employment needs, lack of credit facilities and problems of transition from centrally planned to market economy. These problems affect youths, particularly those aged between 15 and 19 years who have just completed primary education and migrate to urban centres.
3.3. Access to Health Services
Health services are generally regarded as essential components of human development and inclusiveness. Social exclusion often manifests itself in the way household access health services. Health services also feature prominently among the Millennium Development Goals. Healthy children learn better and healthy adults work better. They are both major assets and key parameters to city social sustainability. Health services have been invariably deployed as distributive sectors for equity and inclusion of otherwise marginalised social groups. Results from the eight cities indicate that there was a relatively good level of enhancement of equity in health subsidies. On average, 67 per cent of patients in mainland cities and 100 per cent in Zanzibar were getting subsidised health services. Access to health services was relatively poor in Ilala municipality with only 17 per cent subsidisation (Figure 2).
3.4. Access to Education Services
As the case was for health services, access to education facilities is one of the most compelling factors that underpin equity and inclusiveness in urban areas. From independence (1961) to mid 1980s, Tanzania had made tremendous strides in terms of increased enrolment of students in primary education. By 1984, the enrollment of

Figure 1. Percentage of formal and informal employment in urban centres.

Figure 2. Access to health services in cities (percentage).
children in primary school had reached more than 90 percent of all school-aged children. This proportion was higher than those found in most African countries, including those in the middle and high income groups (Mbilinyi, 2003) . This was facilitated by the Universal Primary Education (UPE) Programme. The latter aimed at 100 percent enrollment in primary schools. This was in line with the goals and ideals of the then socialism policy that declared primary education as a compulsory education to all income categories of all citizens.
In the latter decades, the two key programmes, i.e. the Primary Education Development Programme (PEDP) and the Secondary Education Development Programme (SEDP) consolidated the former declaration by making secondary education free for all. Implementing these two programmes resulted in increased access to secondary by the majority of the students completing primary education. Statistics shows that while the transition rate from primary to secondary education stood at 22 percent in the year 2000, this figure had increased to 68 percent in 2006 and dropped to 52 percent in 2009. This is a significant stride in a country with emerging economy like Tanzania. Although the government’s intention remains to be utmost relevant in addressing inclusiveness and equity through provision of affordable education for all, the declining quality in public schools is increasingly becoming an issue that jeopardizes social inclusion in the education sector. The introduction of private (including religious) schools in the early 90s saw an increase in the gap in the quality of education. The cost of private schools is too high for ordinary citizens to afford. While the current fees chargeable by private secondary schools stands between TZS 1,000,000 and 6,000,000 (US$ 588 and 3529) the monthly minimum wage of government employees is only TZS 188,000 (US$ 110). In that respect, private schools have been largely serving children whose parents are in the middle or high income category. This is increasingly contributing to the rich-poor divide in most urban centres.
Empirical evidence from the eight cities and municipalities indicated that public schools dominated the education sector by enrolling 91 per cent of all primary school-going age children and 66 per cent of all children in secondary schools. Significant differences are emerging in secondary schools mainly because of low level of public investment. In cities where parents and guardians of children had relatively higher incomes, there was a tendency of enrolling students in private secondary schools even though such pupils had their primary education in public schools. This fact was clearly revealed in Ilala where only 24 per cent of pupils who studied in public primary schools continued with their studies in public secondary schools (Table 2). This shift from public primary schools to private secondary schools will in future lead to exclusion of poor household who are unable to pay for private secondary schools raising a question with regard to social sustainability of many Tanzanian cities.
3.5. Ownership of Housing Properties by Sex
Ownership of housing has invariably constituted one of the indicators of urban social inclusion especially in societies where women are traditionally in a disadvantaged position. It is more relevant when data on housing ownership is disaggregated by gender because women ownership to housing and properties has been an issue of debate in most cities of the developing world. Not only women ownership of houses but in which localities (planned or planned) also constituted a parameter in analysing true inclusion or exclusion in cities. Empirical evidence shows that, on average, only 30 per cent of females owned houses in planned settlements, whereas the proportion for planned areas accounted for 37 per cent. More variation becomes apparent when cities were considered separately with a maximum proportion of up to 86.9 per cent in Ilala and 72.5 in Temeke (Figure 3).
Although this data does not directly point to how houses were acquired, impliedly, it shows that access to

Figure 3. Percentage of women owning houses in major urban centres.
Table 2. Percentage of pupils in public schools.
Source: Official records from Education Departments of respective cities, January 2013 (ND = No Data).
planned landed properties is still low for women. One may argue that women are yet to have adequate access to house ownership especially in planned areas as compared to men counterparts. This raises a question on social inclusion for women as one of the traditionally disadvantaged group in the Tanzanian society.
3.6. Access to Potable Water
Water is a pre-requisite resource for human survival and development. It is also a key element in terms of distributive equity among communities and therefore a parameter for inclusiveness in cities. Official records show that the proportion of Tanzania’s urban population served with water increased slightly from 63.2 per cent in 2007/08 to 64.3 per cent in 2008/09 (URT, 2010) . The Millennium Development Goal number 7 target number 10 aims at halving the proportion of people without sustainable access to safe drinking water and basic sanitation by 2015 (UNDP, 2000). In the same vein, Cluster II (improvement of quality of life and social well-being), goal number 4 (increasing access to affordable clean and safe water; sanitation and hygiene) of The National Strategy of Reduction of Poverty II (2010), envisages to increase the proportion of households with access to potable water in urban authorities from 84 per cent to 95 per cent between 2009 and 2015. And for Dares Salaam, the target is to increase the proportion of households with improved sources of water from 68 per cent in 2010 to 75 per cent in 2015 (URT, 2010) . Accesses to water in developing countries typically refer to a combination of sources including domestic water connection, nearby water kiosk, shallow wells and boreholes. It also refers to service levels in terms of hours of water flow from the piped connections. In this project, only a limited scope of water connection was considered t because of the wider coverage in terms of number of cities studied. Evidence from the cities and municipalities indicates that households connected to water supply were generally low. Only 36.9 percent of all households had house water connection. Except Zanzibar where approximately 80 per cent of households had water connections, other cities had less than 40 per cent of households who were connected to water supply (Figure 4). The actual situation of water supply in many urban centres in Tanzania is still wanting in terms of supply, coverage, quality and quantity.
3.7. CBD Buildings with Facilities for People with Disabilities
For a city to be truly inclusive and positively contribute towards social sustainability, it must deploy systems that will ensure equal opportunities for all. In terms of buildings, the key variables that might contribute towards this goal may include building processes and building constructions that take into account the more vulnerable, namely; the poor, women, children, the elderly, youth and the disabled (UN-Habitat, 2012) . A socially sustainable and prosperous city is one where the aspirations of all segments of the population are realized. Increasingly,

Figure 4. Households with house water connections (percentage).
many countries are now bringing to the agenda the question of access to buildings and other city facilities to people with disabilities. A cross-section of this aspect across cities indicated that design and construction of buildings was not giving due regard to equality on gender and group-specific needs. On average, only about 5 per cent of all buildings in CBDs had facilities such as ramps and lifts for people with disabilities. The highest consideration was notable in Arusha that had 18.8 per cent of all buildings in the CBD (Figure 5).
3.8. Quality of Life
Quality of life embraces many indicators and can therefore be discussed from various broad categories. In this paper, only a limited scope in terms of improved sanitation, waste management and improved settlements were considered as key equity areas in this context. The fact that majority of the poor households live in unplanned settlements, access to proper sanitation and waste management have been the key elements that reveal the divided cities in terms of quality of life. Evidence on these three sub components revealed the following pattern:
3.8.1. Sanitation
Although sanitation types varied across cities, on average, 58 per cent of all houses had pit latrines, 32 per cent had water closets, 5.7 per cent were connected to a sewer and 4 per cent had no toilets. The dominant sanitation system in these cities was therefore pit latrines and the number of houses connected to sewerage systems was very limited (Table 3). In quantitative terms, only 28 per cent of the houses in cities had improved sanitation. Mbeya was poorly performing in this respect because 47.9 per cent of its houses did not have own toilets. This situation is not only a health risks but also exposes the city to waterborne disease and other hazards.
3.8.2. Waste Collection
Empirical evidence from cities and municipalities revealed that an average of 51 per cent of the solid waste generated was being collected daily. The best performing cities in waste management included Mwanza, which was collecting approximately 84 per cent of the waste produced. This has been attributed to the well-established partnership between Mwanza City Council and women’s groups that were playing a key role in street cleaning. The worst performing city was Zanzibar, which managed to collect only 18 per cent of the waste produced (Table 4).
3.8.3. Urban Informality
Informal urbanisation is one of the crucial factors that continue to shape the emergent spatial structures and patterns of most Tanzanian cities. Informality is not only prevalent in human settlements but also in livelihood activities in which the majority of the urban residents earn their living. In terms of spatial coverage, cities were predominantly informal, with an average of 66 per cent of their built up areas. Although several studies have shown the potential of unplanned settlements to provide housing for the poor, these settlements are ill-equipped with basic infrastructure services raising critical concerns over inclusiveness in the city spatial structures. In some settlements, housing densities had reached prohibitive levels making access to, and provision of services very difficult. Informality was observed to be the lowest in Mwanza with 40 per cent of its built up areas. It was the

Figure 5. CBD buildings with facilities for people with disabilities (percentage).
Table 3. Type of sanitation used (in %).
Source: Official interviews, January 2013 (ND = No Data).
Table 4. Waste generated versus waste collected (tons per day).
Source: Health department of respective cities and Municipalities, January 2013.
highest in Arusha constituting 80 per cent of the urbanised land. There was however a notable variation across cities and municipalities as summarised in Figure 6.
In terms of population living in informal settlements, evidence from the cities and municipalities indicate that an average percentage of 72 were living in informal settlements. This implies that majority of the people are living in settlements where infrastructure services are inadequate raising major concerns over quality of life in these areas and social sustainability questions.
4. Discussion
Viewed holistically from the composite components of social inclusion as applied across the eight cities, Zanzibar was performing well followed by Temeke, Kinondoni and Ilala as compared to the rest of other cities. Although Arusha was highly ranked in terms of having many buildings with facilities for people with disabilities, it was
performing poorly in terms of other parameters such as female households owning houses in planned and unplanned areas. There were also some missing data for Arusha. The latter registered few scores in terms of waste collection but had also the highest level of informally developed settlements with correspondingly higher population thresholds living in these settlements. In other words one can argue that urban centres that registered lower scores in most of the composite variables were relatively less inclusive as compared to the others. The cross comparison of the composite variables is summarized in Map 2.

Figure 6. Percentage of land covered by informal settlements.

Map 2. Comparison of social inclusion across the eight major urban centres of Tanzania.
5. Conclusion and Recommendations
This paper has empirically shown the social dimension of city sustainability can be measured through the inclusion component with various elements across urban centres. The experience that can be drawn from Tanzania is that; to the large extent, cities are yet to reach acceptable levels where one can confidently conclude that social inclusion is guaranteed in cities. Although cities were performing relatively well in terms of access to education and health services with the larger proportions of the population being served, they were poorly equipped in areas of employment where informal employment dominated the sector. Unreliability in employment results in inadequate income creating a considerable gap in cost of living. Limited access to landed properties by women, restricted access to potable water by the majority of urban residents, building inaccessibility by people with physical disabilities and inadequate sanitation and waste collection underpin social exclusion in most of the Tanzanian with increasing concerns over social sustainability for longer periods in future. Informal urbanization that characterize city spatial growth in most of the cities and increased densification in unplanned settlements undermine initiatives for achieving quality of life with remarkable consequences in social exclusion. In order for Tanzanian cities to move towards social sustainability goals, it is recommended that local communities, local and central governments and other urban stakeholders should develop strategies that aim at addressing informalities in urban growth. Urbanization and urban growth trends should be guided to ensure that basic services are accessible by all sectors in the society especially the poor and disadvantaged groups including women, children, the old, youths and people with physical disabilities. Practical mechanisms such as cross subsidization that have worked in other countries can be adapted to facilitate social inclusion in Tanzanian cities.
References
- Council of Europe (1998). Fighting Social Exclusion and Strengthening Social Cohesion in Europe. Recommendation 1355, Parliamentary Assembly Debate on 28 January 1998.
- Dempsey, N., Bramley, G., Power, S., & Brown, C. (2009). The Social Dimension of Sustainable Development: Defining Urban Social Sustainability. Sustainable Development Journal, 19, 289-300.
- Giddens, A., Duneier, M., & Appelbaum, R. (2006). Essentials of Sociology. New York: WWW NORTON.
- Goltsman, S., & Iacofano, D. (2007). The Inclusive City: Design Solutions for Buildings, Neighbourhoods and Urban Spaces. Berkeley: MIG Communications.
- Gore, C., & Figueiredo, J. B. (1997). Social Exclusion and Anti-Poverty Policy: A Debate. Geneva: International Institute for Labour Studies, ILO.
- Ladman, T. (2006). Human Rights and Social Exclusion Indicators: Concepts, Best Practices and Methods for Implementation. Colchester: Department of Government Human Rights Centre, University of Essex.
- Levitas, R., Pantazis, C., Fahmy, E., Gordon, D., Lloyd, E., & Patsios, D. (2007). The Multidimensional Analysis of Social Exclusion. A Study Report. Townsend Centre for the International Study of Poverty and University of Bristol. Department of Communities and Local Government (DCLG), UK.
- Mathieson, J., Popay, J., Enock, E., Escorel, S., Hernandez, M., Johnston, H., & Rispel, L. (2008). Social Exclusion Meaning, Measurement and Links to Health Inequalities; A Review of Literature. WHO Social Exchange Network Background Paper, Lancaster, UK: Institute for Health Research, Lancaster University.
- Mbilinyi, M. (2003). Equity, Justice and Transformation in Education: The Challenge of Mwalimu Julius Nyerere Today. Haki Elimu Working Paper Series No. 2003.5, Dar es Salaam: HakiElimu.
- Ngware, S., Kironde, J., Manda, P., & Malya, U. (2003). Local Government in Tanzania; A Country Profile, Association of Local Authorities. Unpublished Report of the Association of Local Authorities of Tanzania, Dar es Salaam.
- Omann, I., & Spangenberg, J. (2002). Assessing Social Sustainability; the Social Dimension of Sustainability in a Socio-Economic Scenario, Sustainable Europe Research Institute SERI. Proceedings of the 7th Biennial Conference of the International Society for Ecological Economics, Sousse, 6-9 March 2002.
- UN-Habitat (2001). Inclusive Cities Initiative: The Way Forward. Nairobi: UN Habitat.
- UN-Habitat (2012). State of The World’s Cities: Prosperity of Cities. Nairobi: UN-Habitat.
- United Republic of Tanzania, URT (2010). The National Strategy for Growth and Reduction of Poverty (NSGRP). Programme Document, Dar es Salaam: Vice President’s Office.