Geomaterials
Vol.3 No.3(2013), Article ID:34606,9 pages DOI:10.4236/gm.2013.33013
A Novel Process for the Study of Breakage Energy versus Particle Size
Technical University of Crete, Chania, Greece
Email: elistach@mred.tuc.gr
Copyright © 2013 Elias Stamboliadis. This is an open access article distributed under the Creative Commons Attribution License, which permits unrestricted use, distribution, and reproduction in any medium, provided the original work is properly cited.
Received April 18, 2013; revised May 20, 2013; accepted May 28, 2013
Keywords: Centrifugal Crusher; Kinetic Energy; Breakage Energy; Size-Energy Relationship
ABSTRACT
The energy size relationship is examined, either as the specific energy required breaking a particulate material from an initial size d1 to a final size d2, where d is usually the d80 size, or as the specific energy required to break a single particle. The present work uses the results obtained using a controlled frequency centrifugal crusher to crush particles of a predetermined size class under different rotation frequencies related to the kinetic energy of the particles at the moment of crushing. The paper calculates the relationship between the rotation frequency and the kinetic energy of the particles before crushing and examines the size distribution of the products. The study results allow presenting the relationship between the kinetic energy of the particles and the mass of particles produced below the initial size class. The work also produces the optimum mathematical model that describes this relationship among three proposed ones. According to this model one can calculate the energy required breaking half of the initial mass below the initial size class and the corresponding specific energy is appointed to the average size of the class. The parameters of the mathematical model can be used to compare the grindability of the different materials. The process can be used as an alternative to the drop weight technique used so far for the study of the breakage energy of minerals and rocks.
1. Introduction
Comminution of minerals is an energy consuming operation and is responsible for the main energy cost in mineral processing plants. Modern mineral uses demand finely ground materials for building and chemical Industries and environmental applications. The most modern application is the use of magnesium bearing minerals for the capture of carbon dioxide, P. Renforth et al. [1].
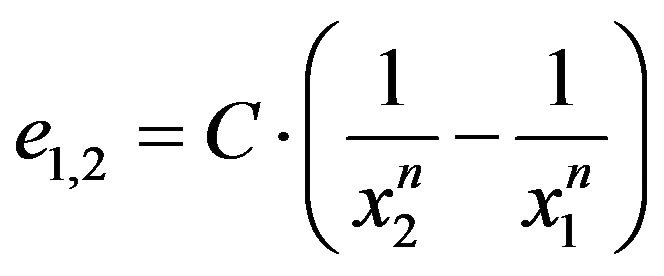
It is well known that the specific energy, energy per unit mass, required to break a mineral particle increases rapidly as the particle size is reduced. Based on grinding data several theories of the energy-size relationship have been proposed and the most common ones are those of Rittinger [2], Bond [3], Kick [4], Charles [5], Stamboliadis [6] and Stamboliadis et al. [7], to name some of them. According to these theories the energy size relationship refers to the specific energy e1,2 required to grind a material from an initial size x1 to a final size x2 and is given by Equation (1), where x1 and x2 are not the sizes of a specific particles but the screen sizes at which a predetermined fraction of the material passes. Usually, x is the screen size at which 80% of the material will pass.
 (1)
(1)
In Equation (1), C is a constant and the difference between these theories is the value of the exponent n and the way it can be measured.
This work refers mainly in the study of the breakage energy required to break single particles and this consists a different approach than the one mentioned above. The first experiments to determine the energy required to break a single particle were made using the drop weight technique. According to it a weight of mass M is allowed to fall on a mineral particle of mass m, from a height h. The initial potential energy Ep of the falling weight is Ep = M·g·h, where g = 9.81 m/s2 is the acceleration of gravity. At the moment the weight strikes on the particle its potential energy has been transformed in to kinetic Ek = MV2/2, where V is the velocity obtained by the falling weight, obviously, Ep = Ek. Initially the energy was determined by measuring the height but in our days one can also measure the velocity at the moment of impact, thanks to technological developments in high speed cameras [8].
The present work uses a new method to provide the energy required to break a particle. This is done using a centrifugal crusher that accelerates particles on a rotating disc that escape from the disc with a kinetic energy that depends on the rotation frequency [9]. The particles strike vertically on a specially designed wall and break.
The size distribution of the daughter particles depends on the strength of the material and the kinetic energy of the initial particle at the moment of impact. Such data have been presented recently by E. Stamboliadis et al. [10], but here the analysis is going a step further to provide a mathematical model to determine the energy-size relationship for breakage. The model one should look for is one that gives the mass fraction of the feed material that breaks below the size class of the feed as a function of the kinetic energy that the feed particles have obtained. The maximum fraction that can break is unit (100%) and the model one should look for is unit model that varies from zero to one. The proposed model can be used to compare the grindability of different types of rocks and minerals using the parameters of the model.
This work also provides the relationship between the rotation frequency of the disc and the kinetic energy that the particles acquire when leaving the disc. As it will be shown below the specific energy, energy per unit mass, of any particle leaving the disc is independent of its size and depends only on the rotation frequency and the disc diameter that is standard for the particular equipment used. The rotation frequency is used as the parameter that influences the kinetic energy.
Three different models have been tested to find the one that fits the results obtained. They all have a parameter ΔHx = kJ/kg that indicates the specific energy required to break a particle of size x. The inverse of this parameter kx = 1/ΔΗx gives the breakage rate kx = kg/kJ that shows the mass of the particles of size x that break per unit of specific energy provided.
Each model gives a curve that differs from the data obtained. The sum of the squares of the differences between the measured and the calculated value gives the accuracy of the model. For each case one can vary the value of the parameter ΔΗx, and choose the one that gives the least value to the sum of squares. This sum is the best accuracy that a certain model can provide. Comparing the sums of least squares for the three models tested one can select the best one that gives the minimum sum of least squares.
As will be explained later, the model chosen can help to answer the question, when does a particle break, and obviously the answer is a statistic one because for practical reasons the particles tested are not all of equal mass or size but they have been chosen to belong to the same size class that is as narrow as possible. Consequently when one speaks for the size of a particle he actually denotes the average size of the size class and only when one refers to the size of a screen below which certain particles will pass the size is absolute.
2. The Crusher Used
2.1. Description of the Crusher
The equipment used is a locally made centrifugal crusher described in detail by D. Stamboliadis [9]. It consists of a horizontal rotating disc, 500 mm in diameter, surrounded by a homocentric, cylindrical cell 900 mm in diameter. The disc rotation axis is vertical and is linearly and directly connected to the axis of an electric motor through a cobbler. The rotation frequency of the motor and consequently of the disc is controlled by an inverter in the range of 700 to 2500 rpm. Radialy on the disc there are two symmetric, vertical blades that oblige any particle on the disc to rotate. The particles are introduced at the center of the disc, through a vertical shaft, and are obliged to rotation by the radial blades. As a result of the rotation, a centrifugal force acts on the particles and drives them to the periphery of the disc along the blades. As the particles move from the center to the periphery of the disc their rotation velocity, which is vertical to the radius, increases continuously and so does the centrifugal force that gives them a velocity on the direction of the radius. At the moment the particles reach the periphery of the disc they escape with the two velocity components that are vertical to each other and equal in magnitude, as calculated below. Their resultant is the vector sum of the two velocities and its direction is at 45 degrees to the radius of the disc at the moment of escape. This means that the resultant velocity vector is not vertical to the homocentric cell surrounding the rotating disc and the particles will not crush on it at an angle of 90 degrees. In order to ensure that the particles leaving the disc will crush on a surface vertical to the direction of their velocity the inner side of the surrounding cell is lined by blades of hard steel at an angle of 45 degrees to the radius. Figures 1 and 2 give an outside and an inside view of the crusher.
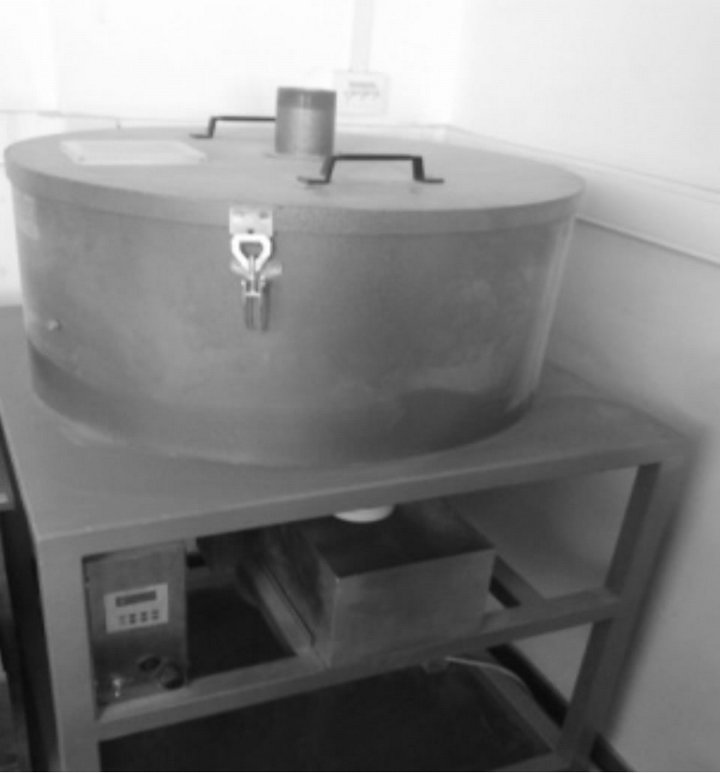
Figure 1. External view of the crusher.

Figure 2. Internal view of the crusher.
2.2. Calculation of the Kinetic Energy
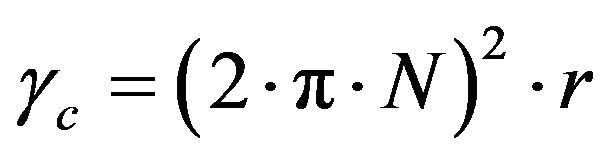
The calculation of the kinetic energy of the particles at the moment of impact has been described by D. Stamboliadis [9] and is as follows. Let R be the radius of the disk and N the rotation frequency. Assume a particle of mass m been at a distance r from the center of rotation. The peripheral velocity Vp at this point it given by Equation (2):
 (2)
(2)
A centrifugal force  acts on the particle that is related to its peripheral velocity according to Equation (3):
 (3)
(3)
The centrifugal force moves the particle to the perimeter with an acceleration calculated by Newton’s law given by Equation (4)
 (4)
(4)
Substituting (2) and (3) into (4) one obtains Equation (5)
 (5)
(5)
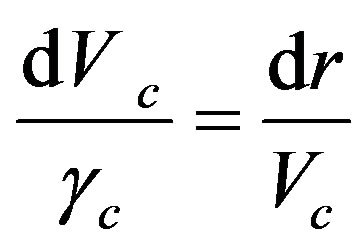
From the laws of motion one has the relationship between the centrifugal velocity Vc, the time t and the centrifugal acceleration given by Equation (6), as well as, the relationship between the centrifugal velocity, the time and the radius given by Equation (7).
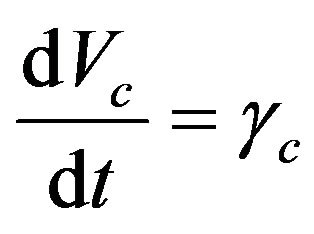 (6)
(6)
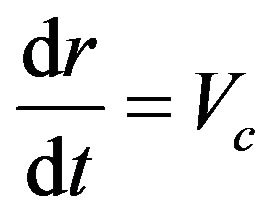 (7)
(7)
Equating and deleting dt from (6) and (7) one has Equation (8)
 or
or 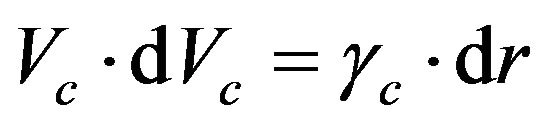 (8)
(8)
Substituting (5) into (8) one has the differential Equation (9) that relates the centrifugal velocity to the distance of the particle from the center of the rotation.
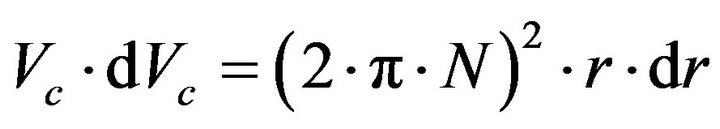 (9)
(9)
The integration of (9) gives Equation (10)
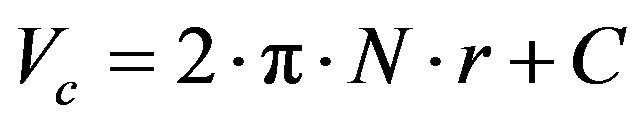 (10)
(10)
For r = 0 then Vc = 0 and consequently C = 0.
At the moment when the particle escapes from the disc r = R and the centrifugal radial velocity is given by (11).
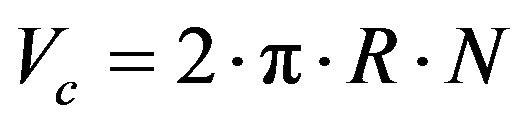 (11)
(11)
At the same moment the peripheral velocity is given by Equation (12) as is equal but vertical to the centrifugal velocity.
 (12)
(12)
The vector sum of these two velocities is the actual escaping velocity V that is calculated from Equation (13)
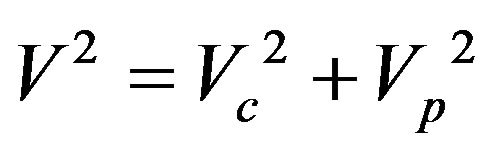 (13)
(13)
Taking into consideration (11) and (12) the final velocity is given by Equation (14) and has a direction of 45˚ relative to the radius of the disc at the moment of escape.
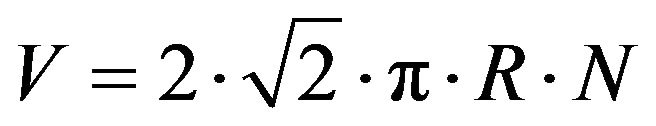 or
or 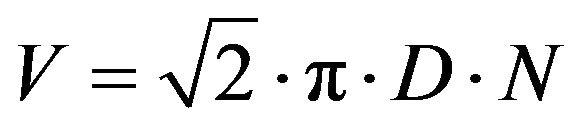 (14)
(14)
where D is the disc diameter D = 2R.
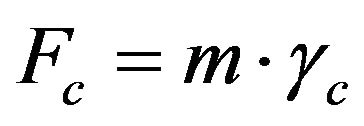
The kinetic energy E of a particle with velocity V is given by Equation (15)
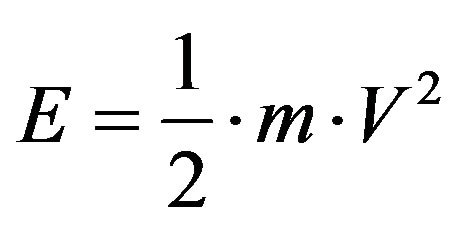 (15)
(15)
Substituting (14) into (15) the kinetic energy of the particle at the escape point from the disc is given by Equation (6)
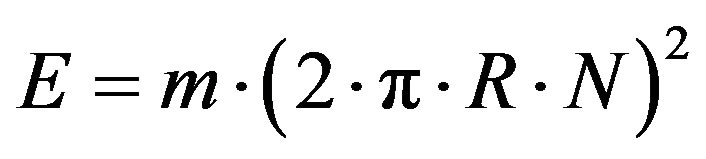 or
or 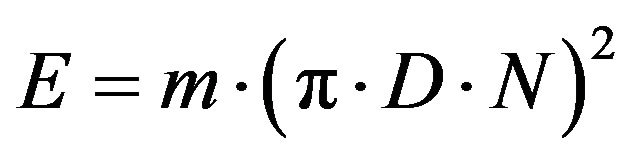 (16)
(16)
The specific energy e = E/m is then given by Equation (16) and it is independent of the particle mass.
 or
or 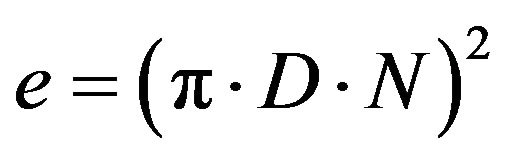 (17)
(17)
Applying the above formulas to the present case one calculates that for the particular crusher, with a disc 500 mm in diameter, the frequency required to achieve a specific energy e = 3600 (J/kg) or the same 1 (kWh/ton), which a usual specific energy required , is 2293 rpm and is independent of the size of the particle. This frequency is within the capacity of the machine manufactured.
3. Experimental
3.1. Materials Used
Two different rocks are studied, namely 1) microcrystalline limestone from the operating quarry of Hordaki near Chania, in the island of Crete, Greece and 2) serpentine from the area of Mantoudi in the Island of Euboea, Greece.
There are two reasons for the selection of these materials. The first is that limestone is more or less homogenous compared to serpentine that is weathered and these rocks are expected to have different behavior regarding the energy size relationship. The second reason is that limestone is used widely as a building material, while serpentine is a source of MgO that is studied for the capture of carbon dioxide in environmental applications [1]. In both cases the energy cost for size reduction is very important.
The microscopic structure of the samples appears in polished sections presented in Figures 3 and 4 respectively. One can see that limestone is microcrystalline and the crystals are not distinguished giving a homogeneous appearance at the scale of the particles tested. On the other hand serpentine crystals can be distinguished but they appear to be weathered and the space between them consists of the weathering product that is expected to be weaker than the healthy crystals.
3.2. Experimental Procedure
The experimental procedure followed during the test work
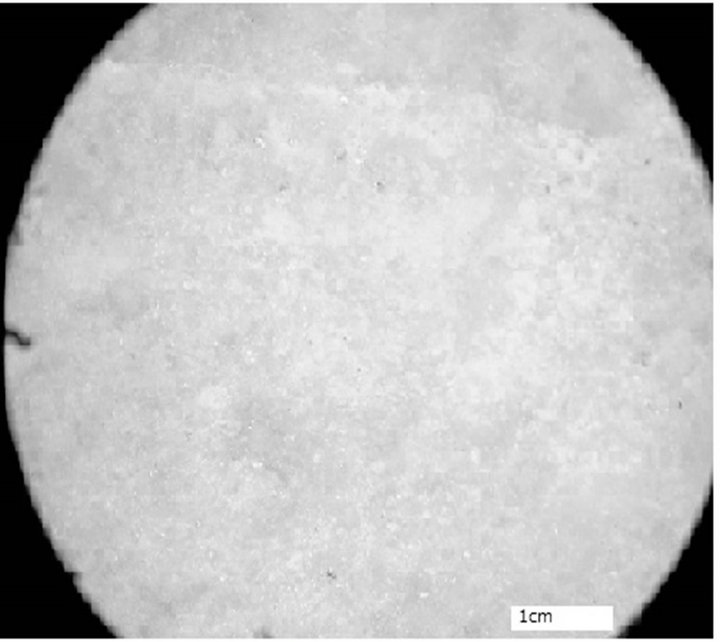
Figure 3. Limestone.

Figure 4. Serpentine.
is described by E. Stamboliadis et al. [4]. A quantity about 30 kg of each material tested was crushed to minus 30 mm using a laboratory jaw crusher. The material is then classified into the following size fractions of very narrow size range (16 - 22.4 mm), (8 - 11.2 mm), (4 - 5.6 mm), (2 - 2.8 mm) and (1 - 1.4 mm). The geometric average size of each size fraction is calculated to be (18.93 mm), (9.47 mm), (4.73 mm), (2.37 mm) and (1.18 mm) respectively. Each size fraction is crushed in the centrifugal crusher at different rotation frequencies using 1 kg of the particular feed size fraction at a time. The frequencies used and the corresponding specific energies are presented in Table 1.
The crushed product of each test is collected and classified in size fractions using the screens 16, 8, 4, 2, 1, 0.5, 0.25, 0.125 and 0.063 mm. The mass distribution of each product is the cumulative mass % finer than the corresponding screen and is plotted versus the screen size in the same figure for all the specific energies used for the same feed fraction. From such a figure one can see the effect of the specific energy to the size analysis of the products.
The results are also presented in a way that for the same feed size, it gives the mass fraction of the material broken below the feed size as a function of the specific energy. The results obtained from this kind of presentation are used to derive the mathematical model that fits them. This model gives the energy required to break each feed fraction size and contains parameters that allow comparing the different materials tested.
3.3. The Results Obtained for Limestone
The results obtained for each feed fraction of limestone tested at different rotation frequencies are tabulated in tables. Table 2 presents the data obtained for the fraction 16 - 22.4 mm of limestone. It is reminded that each rotation frequency corresponds to a certain specific energy as shown in Table 1. The top row of Table 2 shows the screen size (mm), while the left column gives the specific energy of the feed particles (J/kg). The values presented in the table give the measured mass fraction of the product that passes through the corresponding screen for the indicated specific energy.
The horizontal plot of the values of Table 2 gives Figure 5 that shows the mass fraction of particles finer than the screen size for the different specific energies. The

Table 1. Experimental frequencies and corresponding specific energies.

Table 2. Limestone feed 16 - 22.4 mm, mass fraction passing.
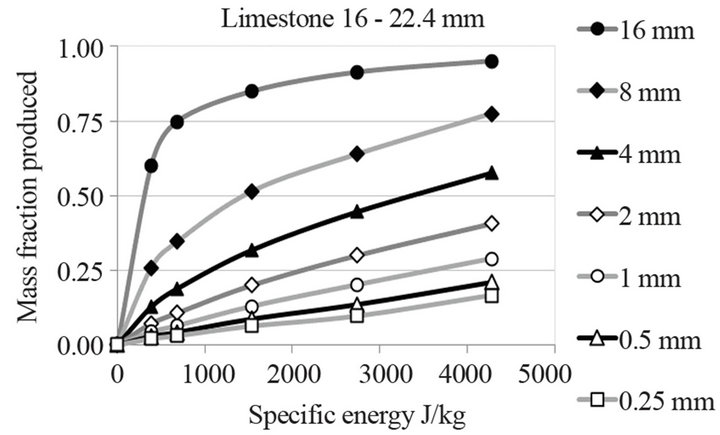
Figure 5. Mass finer versus screen size.
higher the specific energy the curves move to finer sizes.
The vertical plot of Table 2 gives Figure 6 that presents the mass fraction of the product that passes the indicated screen size, for all specific energies applied. All curves tend to 1, which is the maximum mass fraction that can be produced below any size. Obviously the coarse particles are produced at a higher rate than the finer ones and as shown in Figure 6 only a small fraction of the fines is produced at the maximum specific energy tested (4500 J/kg),which actually is the limit of the machine used. The fact that the curves of Figure 6 have a maximum indicates the type of mathematical equations that can be applied to describe the phenomenon. The same type of curves, are obtained for all the feed fractions tested for each type of rock tested. Table 3 presents the results obtained for limestone from all size fractions tested at different specific energy inputs. The data give the mass fraction of the product that passes below the initial feed class. As an example, for the feed fraction (1 - 1.4) mm, the table shows the mass of the feed that passes through the (1) mm screen for all the specific energies applied.
Figure 7 presents the mass fraction of limestone broken below the feed class tested, denoted by its average size, as a function of the specific energy. Figure 8 presents the same results for all energy levels applied as a function of the average size of the feed class. Both figures show, each one in a different way, that for any feed

Figure 6. Mass produced versus.
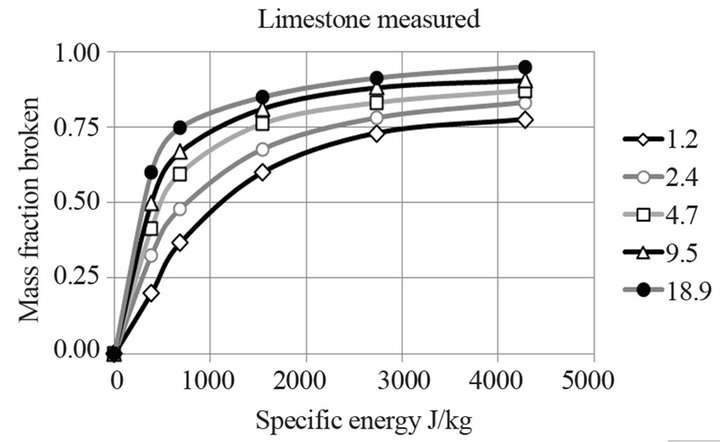
Figure 7. Mass fraction broken below the size class versus specific energy.
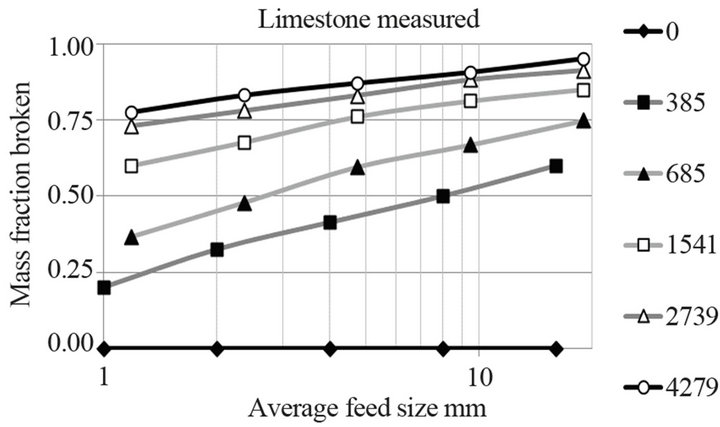
Figure 8. Mass fraction broken below the size class versus lower size.
size the mass fraction of broken particles increases with
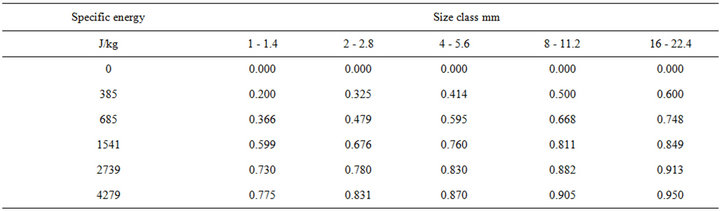
Table 3. Limestone, mass fraction produced below the size class.
specific energy but it decreases with feed size. It is more difficult to break the small particles than coarser ones.
4. Derivation of the Model
4.1. Data Processing
The data obtained so far are further processed mathematically in order to reveal a model that could describe them. As already mentioned, the mass fraction of the product at any test that is broken below its initial class size is expected to be a number between zero and unity, that is the case when all the particles produced pass below this size class. Consequently the type of the function one should look for is a unit function. Such a function should give the mass fraction of the material of a given feed size that breaks as a function of the energy provided and should also vary from zero to one that is the maximum fraction of the material that can be broken. It should also incorporate a parameter that depends on the coherence of the material and will show how it relates to the size of the material tested.
Three types of such functions have been chosen that incorporate a parameter ΔΗ (J/kg) related to the energy required for breakage, as follows.
Type M-B  (18)
(18)
Type EXP  (19)
(19)
Type LAN 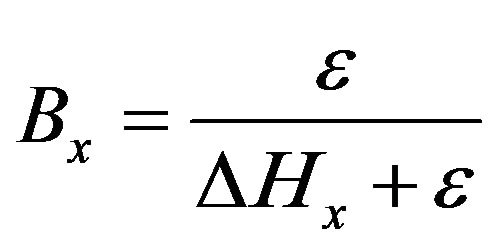 (20)
(20)
Equation type M-B (18) is actually the MaxwellBoltzman distribution law and can be found in textbooks of physical chemistry, Glasstone [11]. The same equation has also been used to format a comminution theory [12].
Equation EXP (18) is the exponential equation derived when assuming that the rate of depletion of a mass is proportional to the remaining mass. The mathematical derivation can be found in textbooks of differential equation [13]. This kind of model is found to explain grinding data [14].
Finally, equation LAN is the one used by Langmuir to describe the volume V of a gases chemisorbed as a monolayer on a solid surface, as referred by Shaw [15]. This equation is also referred homographic and is used to describe phenomena that tend to a maximum.
The form of each equation is presented in Figures 9 and 10 as a function of the specific energy ε, for ΔΗ values 10 and 100 J/kg respectively.
For low ΔΗ, Figure 9, which means that the particles break easily, all models give a quick breakage rate. The EXP is faster and the M-B is the slowest. For high ΔΗ, Figure 10, which means that the particles are difficult to break, all models give a slow breakage rate. Again the EXP is faster and the M-B is the slowest showing a delay at low values of the specific energy ε provided.
Each model is compare d with the actual results obtained for all feed sizes at the actual values of specific energy applied. For each test an estimated value of ΔΗ is selected and the calculated mass fraction predicted fcal is compared to the mass fraction fmeas actually measured at the energy level i provided. One calculates the square of the difference between them ![]() and finds the sum of squares
and finds the sum of squares  for all n energy levels applied. Changing the values of ΔΗ one can find the value that gives the least sum of squares and assign it to the size class of the feed tested. A plot of the sums of least squares versus the average size of the class tested is presented in Figure 11 for limestone.
The results vary according to the size and one can take the average sums of least squares for all sizes are plot them in Figure 12 where one can see that the LAN model gives the least deviation from the experimental data.
Similar results are obtained for serpentine presented in
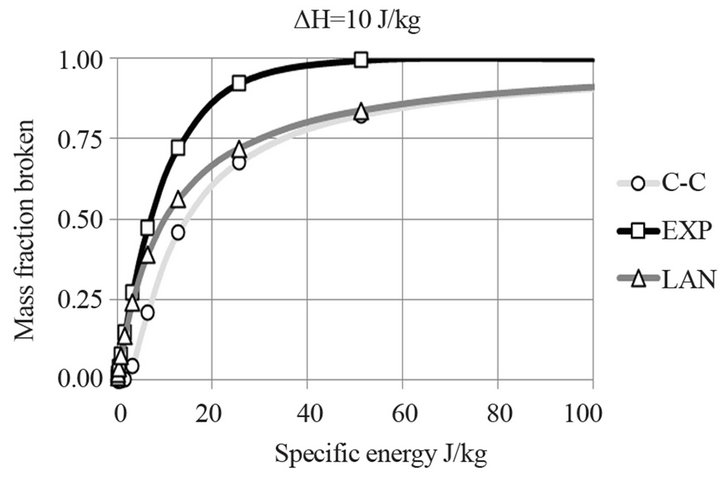
Figure 9. Mass fraction broken for ΔΗ value 10 J/kg.
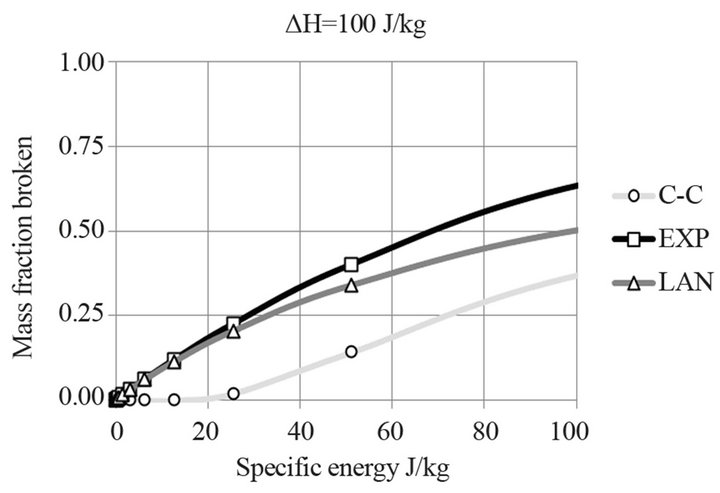
Figure 10. Mass fraction broken for ΔΗ value 100 J/kg.
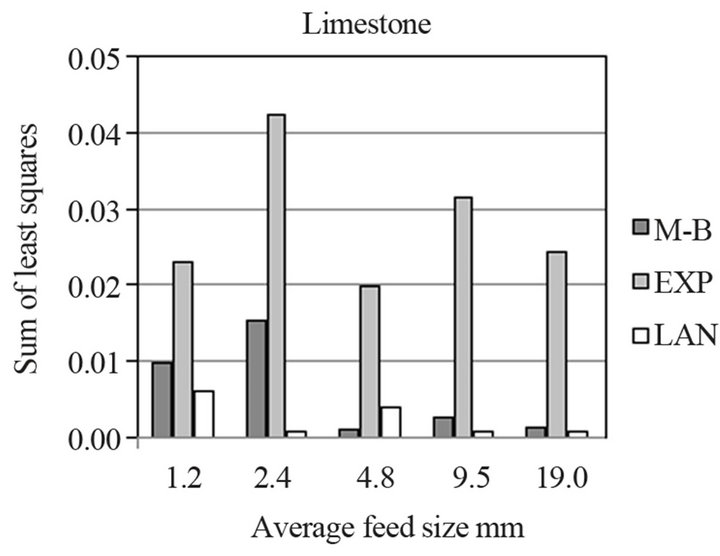
Figure 11. Sums of least squares.

Figure 12. Average sums of least squares.
Figures 13 and 14. Here again the LAN model gives the least deviation from the experimental data.
In Figure 15 it is easy to compare the calculated values of the mass fraction produced for all sizes to the obtained ones versus the energy for limestone.
The corresponding results for serpentine are plotted in Figure 16. These figures show that the agreement of the model selected to the measured data is satisfactory and there for will used to study the relationship of the specific breakage energy to the size of the particles broken.
4.2. The Relationship of Energy versus Size
Having established the mathematical model that describes the experimental data one can use it to conclude the specific energy ε required to break a particle. It is

Figure 13. Sums of least squares.
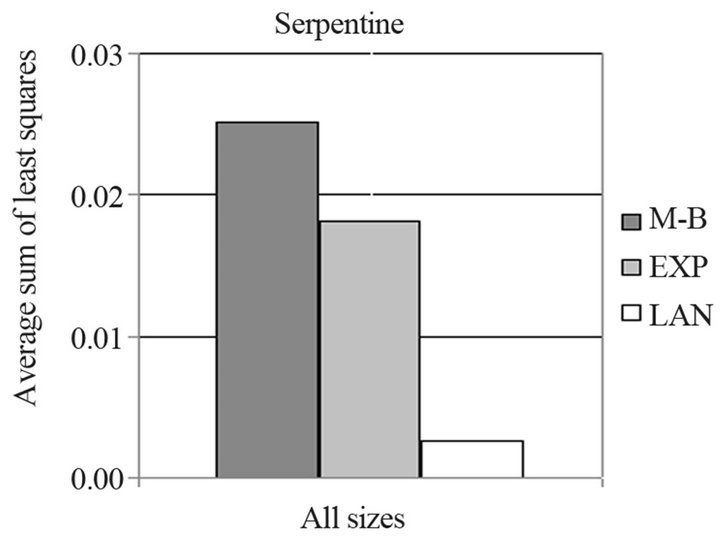
Figure 14. Average sums of least squares.

Figure 15. Mass fraction broken.
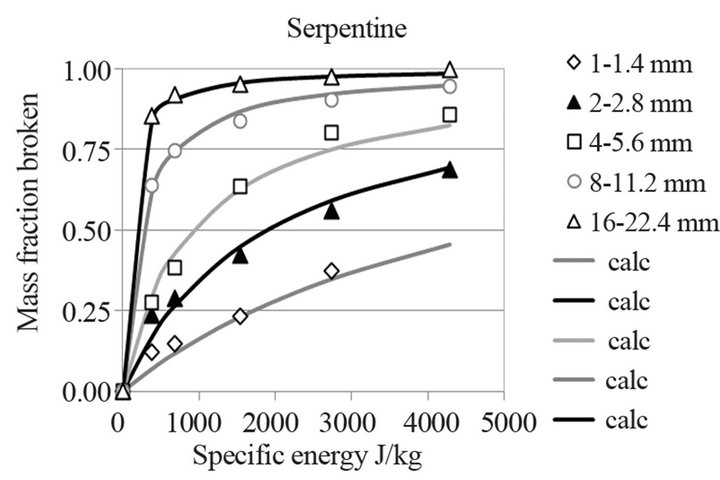
Figure 16. Mass fraction broken.
understood that the feed particles are not individual particles of a particular size but rather particles that belong to the same size class as explained above in the experimental procedure. Consequently the size x of the class is the geometric average of the xmin and xmax that is . The next step is to define the specific energy εx required to break the average particle of size x. The data obtained shows the mass fraction Bx of the size class that breaks below the minimum size as a function of ε presented in Figures 15 and 16. This problem is solved by defining the parameter ΔΗx, calculated for each feed size, as the specific energy ex required breaking the average particle x of the class. In other words the specific energy to break a particle of size x is ex = ΔΗx. From the same Equation (19) it is obvious that the units of ΔΗx are (J/kg) and at the time ex = ΔΗx it is calculated that Bx = 0.5 meaning that any size class breaks when half of its mass breaks below this class. The calculated values of ΔΗx corresponding to each average size class both for limestone and serpentine are given in Table 4 and presented in log-log scale on Figure 17.
The relationship of the specific energy for breakage versus average particle size for limestone is presented by the equation below
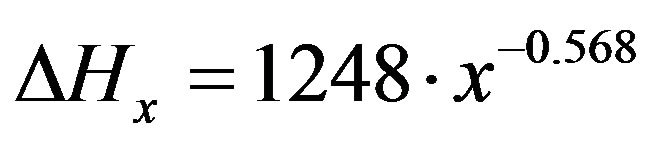 (21)
(21)
while for serpentine it is presented by the following one
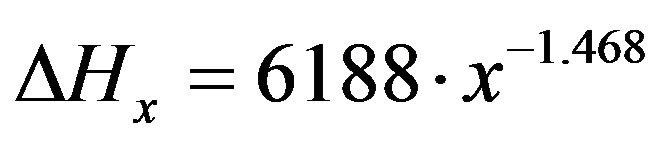 (22)
(22)
5. Discussion and Conclusions
This paper has presented the design characteristics of a centrifugal crusher that accelerates particles and gives them a kinetic energy that can be controlled by the rotation frequency of its disc. Its is calculated that the specific energy of the particles, at the moment they escape from the disc, hit the opposite wall and break, depends on the disc diameter that is kept constant during the test work as well as on the rotation frequency that can be adjusted on will. When particles of a certain size class break they create small daughter particles and their size

Table 4. Energy-size data.
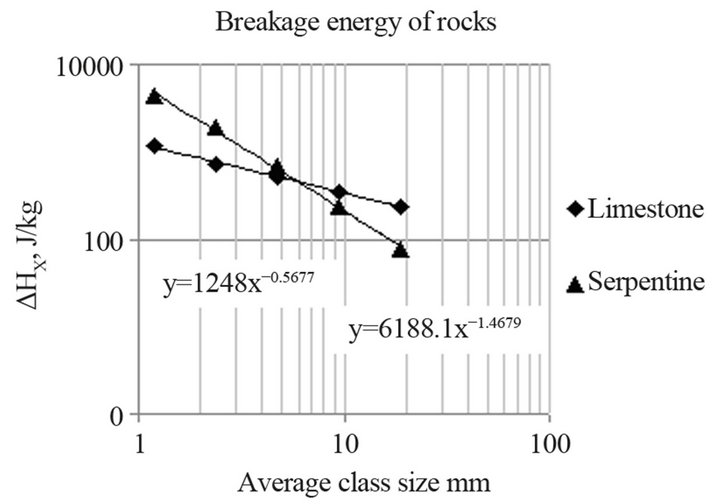
Figure 17. Specific energy for breakage.
distribution depends on the specific energy of the parent particle. For the purpose of the test work the feed particles to be broken are classified in size classes having a xmax/xmin ratio equal to . This work concentrates on the rate that the particles belonging to the same size class are broken to finer particles and pass the xmin size. Three different mathematical models are tested to describe the rate of breakage for each one of the different size classes tested for limestone and serpentine. The model that gives the best fit is the one given by Equation (19) that incorporates a parameter ΔΗx which can be related to the specific energy (J/kg) required to break a particle of size x. The opposite of ΔΗx is a parameter kx that gives the rate of breakage kx = 1/ΔΗx (kg/J). Equation (19) gives the mass fraction of the size class with average size
  that breaks below the class and it is a pure number with no units. According to Equation (19) when the specific energy ε of the particles to be broken equals ε = ΔΗx half of their mass will pass below the particular size class. This specific energy ΔΗx is defined as the energy required to break the particle with the average size of the class.
The plot of the specific energies required for breakage versus the particle size gives the relationship of specific energy versus size that is a power function of the form a·xb. As expected the specific energy required to break a particle increases as its size decreases. The coefficient a measured in J/kg as well as the exponent b, which is a number, vary with the rock type tested. For limestone that is shown to be microcrystalline and more homogeneous, at the size ranges tested, the exponent is found to be (−0.57), while for serpentine that seems to be macrocrystalline and also weathered the exponent equals (−1.47).
Coefficient a for limestone is 1250 J/kg, while for serpentine it is 6190 J/kg. These parameters can be used to characterize the minerals and rocks and classify them according to their cohesion that is expressed by coefficient a = J/kg as well as by their homogeneity expressed by the exponent b, which is a number. As a result of this consideration one could say that the small healthy crystals of serpentine are harder to break than the equivalent ones of limestone. At larger sizes serpentine particles, consisting of more than one crystal connected with weathered material, they break easier than the homogeneous particles of limestone.
REFERENCES
- P. Renforth and T. Kruger, “Coupling Mineral Carbonation and Ocean Liming,” Energy & Fuels, 2013. http://dx.doi.org/10.1021/ef302030w http://pubs.acs.org
- P. R. Rittinger, “Learning Book of Mineral Processing,” Technical University of Berlin, Berlin, 1867.
- F. C. Bond, “The Third Theory of Comminution,” Transactions of the American Institute of Mining, Metallurgical and Petroleum Engineers, Vol. 193, 1952, pp. 484-494.
- F. Kick, “The Low of Proportional Resistances and Its Applications,” Arthur Felix, Leipzig, 1885.
- R. J. Charles, “Energy-Size Reduction Relationships in Comminution,” Transactions of the American Institute of Mining, Metallurgical and Petroleum Engineers, Vol. 208, 1957, pp. 80-88.
- E. T. Stamboliadis, “Impact Crushing Approach to the Relationship of Energy and Particle Size in Comminution,” European Journal of Mineral Processing & Environmental Protectio, Vol. 3, No. 2, 2003, pp. 160-166.
- E. Stamboliadis, S. Emmanouilidis and E. Petrakis, “A New Approach to the Calculation of Work Index and the Potential Energy of a Particulate Material,” Geo Materials, Vol. 1, No. 2, 2011, Article ID: 1110007.
- L. M. Tavares and R. P. King, “Single Particle Fracture under Impact Load,” International Journal of Mineral Processing, Vol. 54, No. 1, 1998, pp. 1-28.
- D. Stamboliadis, “Design of a Centrifugal Crusher for Minerals, Based on the Design of Structures,” Undergraduate Thesis, Technological Education Institute of Piraeus, Piraeus, 2013. (in Greek)
- E. Stambloiadis, D. Stamboliadis, K. Kiskira and A. C. Emejulu, “Crushing of Mineral Particles by Control of Their Kinetic Energy,” Scientific Journal of Riga Technical University, Series 1, Material Science and Applied Chemistry, RTU Press, Riga, 2013
- S. Glasstone, “Textbook of Physical Chemistry,” 2nd Edition, Macmillan, London, 1948.
- E. Stamboliadis, “The Theory of Surface Potential Energy, Minimum Particle Size and Non-Fractal Nature of Fragmentation,” Canadian Metallurgical Quarterly, Vol. 49, No. 2, 2012, pp. 113-120.
- N. Piskounov, “Differential and Integral Calculus,” 2nd Edition, MIR, Moscou, 1966.
- E. T. Stamboliadis and V. J. Gaganis, “Application of Computer Assisted Mathematical Analysis for the Interpretation of Mineral Grinding Data,” 1st International Conference “From Scientific Computing to Computational Engineering” Athens, 8-10 September 2004.
- D. J. Shaw, “Introduction to Colloid and Surface Chemistry Surface Chemistry,” 2nd Edition, Butterworths, London, 1970.