New Journal of Glass and Ceramics
Vol.2 No.1(2012), Article ID:16979,11 pages DOI:10.4236/njgc.2012.21005
Kinetics of Phase Transformations and Thermal Stability of Se58Ge42-xPbx (x = 15, 18 & 20) Glasses
![]()
Semiconductor & Polymer Science Laboratory, University of Rajasthan, Jaipur, India.
Email: *deepika.spsl@gmail.com, *n_s_saxena@rediffmail.com
Received September 17th, 2011; revised October 19th, 2011; accepted October 29th, 2011
Keywords: Activation Energy; Differential Scanning Calorimetry (DSC); Thermal Stability
ABSTRACT
This paper presents the results of kinetic studies of glass transition and crystallization in Se58Ge42-xPbx (x = 15, 18 & 20) glasses using differential scanning calorimetry (DSC). It has been observed that these glassy systems exhibit single glass transition and double crystallization on heating. The crystalline phases have been identified by annealing the samples at temperatures intermediate between the first and second crystallization peaks. The structural characterization of the as-prepared and annealed glassy alloy has been done through X-ray diffraction (XRD). The activation energy for glass transition as well as crystallization region has been calculated using various theoretical models. In addition, the effect of annealing on various kinetic parameters of transformations has been studied. On the basis of the experimental results on phase transformations in these glasses, thermal stability of the samples under investigation has been ascertained. It was found that the thermal stability is profoundly affected by annealing since the glass transition as well as crystallization temperatures are strongly influenced by annealing the samples. The phase transformation study reveals that the thermal stability of the samples increases with the increase in lead content in the samples.
1. Introduction
The nature of glassy state and the mechanism of glass transition are considered as the deepest and most interesting unsolved problems in solid state theory. In addition to the fundamental scientific interest of the problem, the practical aspects are of vital importance to the glass industries as the properties of the glass product depend strongly on both its composition and thermal history. The material system in which glass forming kinetics are observed requires supercooling below the melting point, where the relaxation processes of the supercooled liquids are much slower than the cooling rate. This leads eventually to the glass transition where the material is frozen in an amorphous rather than crystalline state. This amorphous state is thermodynamically unstable and crystallizes at elevated temperatures. The transition of amorphous state into crystalline state proceeds by nucleation and growth reactions. Considering that glass formation is a competing process against crystallization, a systematic study on the kinetics of the crystal phase remains one of the most interesting aspects of condense matter physics.
The kinetic behavior associated with a structural change from an amorphous state to crystalline state is of great importance to establish the thermal stability and glass forming ability (GFA) of glasses and ultimately to determine the useful range of operating temperatures for a specific technological application before the eventual crystallization takes place. The critical issue for the potential applications of these glasses is their thermal stability against crystallization. They should be stable against thermal aging during their application. Therefore, it is very important to investigate the thermal stability of glasses against crystallization, when they are subjected to reheating during the fabrication of glass ceramics.
Thermal analysis tools, in particular differential scanning calorimetry (DSC) have been successfully employed [1-4] in studying phase transformations involving nucleation and growth and continuous grain growth of pre-existing nuclei and for investigating the crystallization kinetics of glass forming liquids. Kinetic data on first order transformations are often obtained from this technique in either isothermal or non-isothermal mode. The isothermal analysis is more definitive, in most cases, it has been shown that the non-isothermal technique also have several advantages, in particular that experiments can be performed quite rapidly. Additionally, many phase transformations occur too rapidly to be measured under isothermal conditions because of transients associated with the experimental apparatus. For this reason, nonisothermal methods are frequently used for studying the kinetics of phase transformations of glasses.
Kinetics of glass transition has been studied [5-8] widely from the viewpoint of understanding various structural and thermodynamic properties in the glass transition region. Also the structural relaxation due to sub-Tg annealing of the glass can be studied through the investigation of kinetics of this region. Moreover, activation energy of glass transition is a kinetic parameter which can throw light on the thermal stability of glass and can be determined through the knowledge of glass transition temperatures at different heating rates.
Many authors used the so-called Kissinger model [9] or Ozawa model [10] directly to examine the kinetics of crystallization of amorphous materials. These methods, however can not be directly applied to the crystallization of amorphous materials and the physical meaning of the activation energies thus obtained are obscure because the crystallization is advanced not by the nth order reaction but by the nucleation and growth processes. On the other hand, some authors [11-15] have applied the Johnson-Mehl-Avrami (JMA) equation to the non-isothermal process. Although sometimes they appeared to get reasonable activation energies, this procedure is not appropriate because the JMA equation was derived for isothermal crystallization [16]. Matusita and Sakka [17-19] have proposed method for analyzing the non-isothermal crystallization kinetics on the basis of nucleation and growth processes, and emphasized that the crystallization mechanism such as bulk crystallization or surface crystallization should be taken into account for obtaining the meaningful activation energy.
Authors [20] have studied the thermodynamic properties of this system and confirmed that the stability of the system increases with the increase in lead content. In the present paper, kinetics of phase transformation as well as thermal stability of Se58Ge42-xPbx (x = 15, 18 & 20) glasses under non-isothermal conditions has been studied. The Se-Ge-Pb system is of interest and has been investigated because very few attempts have been made to study chalcogenide glasses with Pb as one of the component. It is due to the fact that lead is the last element in radioactive series, which is more stable, or lead is one with which it is difficult to form a glass. Moreover, the charge reversal from usual p-type to n-type [21,22] has created an additional interest in the thermal properties of these glasses.
In view of this, kinetics of phase transformations and related thermal properties of Se58Ge42-xPbx (x = 15, 18 & 20) glasses have been studied using Differential Scanning Calorimetry (DSC). The results obtained from DSC have been interpreted using many theoretical models. These models were used to extract the kinetic parameters of the phase transformation. The effect of annealing on the phase transformation of the system under investigation has also been reported in this paper. Besides these, thermal stability of the samples has been evaluated using the kinetic parameters. Effect of increasing lead content on the crystallization and thermal stability of these glasses has also been investigated in detail in this paper.
2. Experimental Details
Glassy alloys of Se58Ge42-xPbx (x = 15, 18 & 20) have been prepared by melt-quenching technique discussed elsewhere [20]. The amorphous nature of the alloys was ascertained through X-ray diffraction pattern of the samples using Bragg-Brentanno geometry on Panalytical X’- pert Pro differactometer in 2θ range of 20˚ - 90˚ with CuKα radiation source (λ = 1.5406 Å). The X-ray tube was operated at 45 kV and 40 mA.
Rigaku Model 8230 of DSC is used to measure the caloric manifestation of the phase transformation and to study the crystallization kinetics under non-isothermal condition. The accuracy of heat flow measurement is ±0.01 mW and the temperature precision, as determined by the microprocessor of the thermal analyzer, is ±0.1 K. DSC runs have been taken at five different heating rates, i.e. 10, 15, 20, 25, 30 K/min on accurately weighed samples taken in aluminum pans under non-isothermal conditions. The temperature range covered in DSC is from room temperature (300 K) to 753 K.
3. Results and Discussion
3.1. Structural and Thermal Analysis
Figure 1 shows the X-ray diffraction patterns of as-prepared Se58Ge42-xPbx (x = 15, 18 & 20) glassy alloys. The absence of any sharp peak in the diffraction patterns confirms the amorphous nature of these samples. Figure 2 shows the DSC curves of as-prepared Se58Ge42-xPbx (x = 15, 18 & 20) samples at a heating rate of 20 K/min. The glassy alloys under consideration show an endothermic step corresponding to its glass transition temperature (Tg) and two exothermic peaks corresponding to crystallization. The double stage crystallization observed in Se58Ge42-xPbx
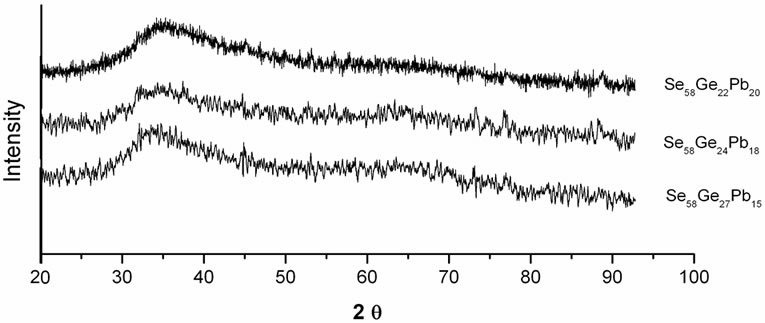
Figure 1. X-ray diffraction patterns of the as-prepared samples of Se58Ge42-xPbx (x = 15, 18 & 20) glassy alloys.
(x = 15, 18 & 20) glassy alloys may be due to the fact that in the present selenium rich glass system, germanium atoms gets tetrahedrally bonded with selenium atoms to form a loose packed structure and the excess selenium atoms forms a complete disordered segregated matrix with increasing Pb content. Therefore, in Se58- Ge27Pb15, Se58Ge24Pb18 and Se58Ge22Pb20 glasses, the first crystallization is due to the GeSe2 phase while the second crystallization correspond to PbSe phase. The occurrence of these phases is confirmed from XRD patterns of annealed samples of Se58Ge42-xPbx (x = 15, 18 & 20) glasses shown in Figure 3.
3.2. Kinetics of Phase Transformations
Kinetics of phase transformations in these glasses has been studied through the investigation of glass transition and crystallization phenomenon over the entire range of heating with constant heating rates. Understanding of the glass transition kinetics of chalcogenide glasses is of great importance to establish their thermal stability and to determine the effective working temperature limits for a specific technological application. The knowledge of crystallization kinetics is also essential to provide various kinetic parameters in the manufacturing of glass-ceramics and preventing devitrification. Various theoretical models have been employed to extract the kinetic parameters of phase transformations using characteristic temperatures obtained from DSC thermograms. Table 1 shows the values of the characteristic temperatures (Tg, Tc1, Tc2, Tp1 and Tp2) of all the as-prepared compositions at a heating rate of 20 K/min.
From Table 1, it is observed that glass transition temperature (Tg) decreases with the increase in lead (Pb) content. This decrease in Tg can be explained on the basis of the structural change that occurs due to the introduction of Pb atoms in the Se-Ge system. In Se58Ge42-xPbx (x = 15, 18 & 20) glasses, substitution of Ge with Pb atoms results in the reduction of Ge-Se bonds and an increase in Pb-Se bonds. The single bond energy values [23] of Ge-Ge, Pb-Pb and Se-Se bonds are 205.2 kJ/mol, 85.7 kJ/mol and 206.1 kJ/mol respectively, while the single covalent bond energies of Ge-Se and Pb-Se bonds are 234.9 kJ/mol and 231.2 kJ/mol respectively. The introduction of Pb in Se-Ge system reduces the bond energy of the system causing the decrease of Tg in the system [24]. Hence Se58Ge22Pb20 has the lowest Tg among all other samples.
Glass transition temperature (Tg) is also related to the rigidity of the network (i.e., it reflects the connectedness of the network) which is usually associated with the mean coordination number,
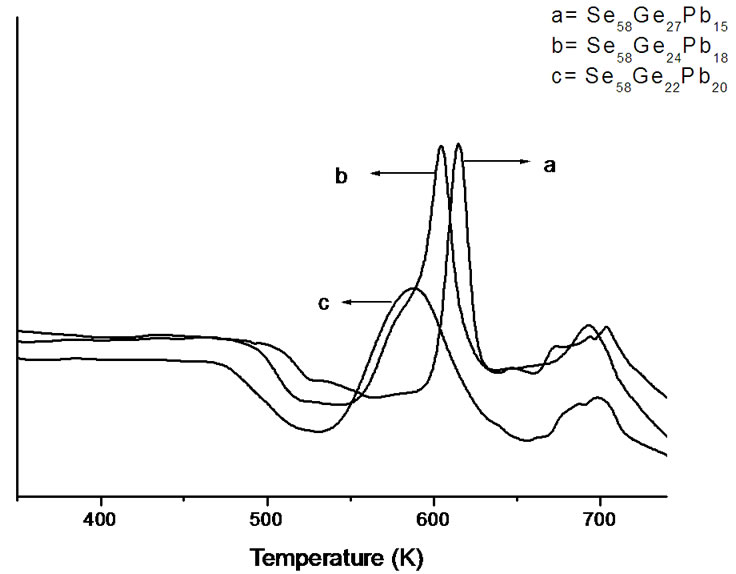
Figure 2. DSC thermograms of as-prepared Se58Ge42-xPbx (x = 15, 18 & 20) samples at a heating rate of 20 K/min.
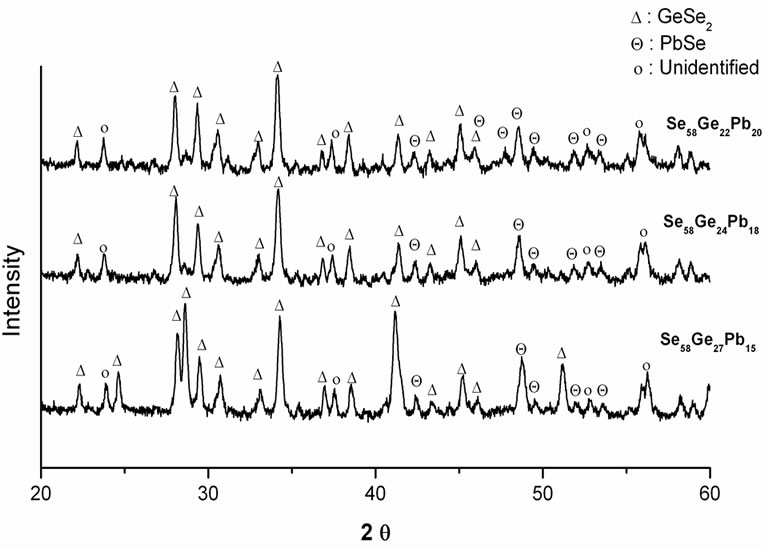
Figure 3. XRD patterns of annealed samples of Se58Ge42-xPbx (x = 15, 18 & 20) glasses.
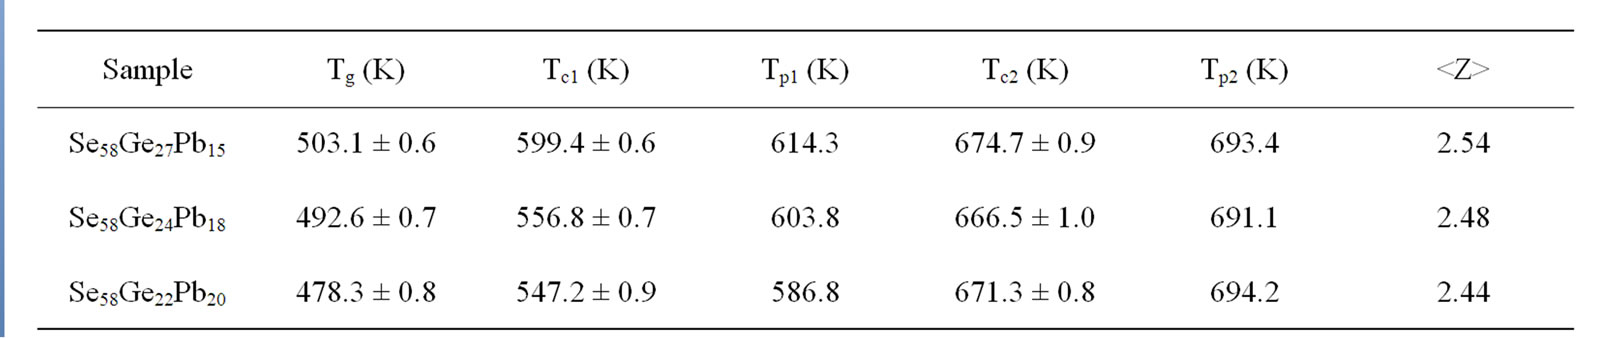
Table 1. Values of the characteristic temperatures (Tg, Tc1, Tc1, Tp1 and Tp2) of all the samples of Se58Ge42-xPbx (x = 15, 18 & 20) glassy alloys at a heating rate of 20 K/min.
the standard procedure described by Tanaka [25], using the co-ordination number of Se, Ge and Pb is 2, 4 and 2 respectively. Thus, for the glassy system SeaGebPbc (a + b + c = 100), the values of
where ZSe, ZGe and ZPb are the co-ordination numbers Se, Ge and Pb respectively and a, b, c are the atomic weight percentages of the these elements respectively in the glassy network. The values of
Kinetics of phase transformations of as-prepared as well samples annealed at temperature intermediate between first and second crystallization region has been studied in glass transition and crystallization region. The details of these investigations are given in the following sections.
3.2.1. Glass Transition Region
The kinetics of glass transition has been studied only in first glass transition region as the second glass transition does not occur under ordinary thermal scanning of the samples at different heating rates in differential scanning calorimetry. Two different approaches have been used to analyze the dependence of glass transition temperature (Tg) on heating rate (α). The first one is the empirical relationship of the form:
 (1)
(1)
where, A and B are constants for a given glass composition [27]. The value of A depicts the value of glass transition temperature at heating rate of 1 K/min, while B is proportional to the time taken by the system to reduce its glass transition temperature from a value obtained at a heating rate of 10 K/min to a value which is obtained at a heating rate of 1 K/min. Table 2 shows the values of A (K) and B (min) for as-prepared and annealed samples of Se58Ge42-xPbx (x = 15, 18 & 20) glasses.
It is observed from the Table 2 that the values of both A (K) and B (min) decrease in all the glassy samples on annealing. This decrease on annealing the samples is
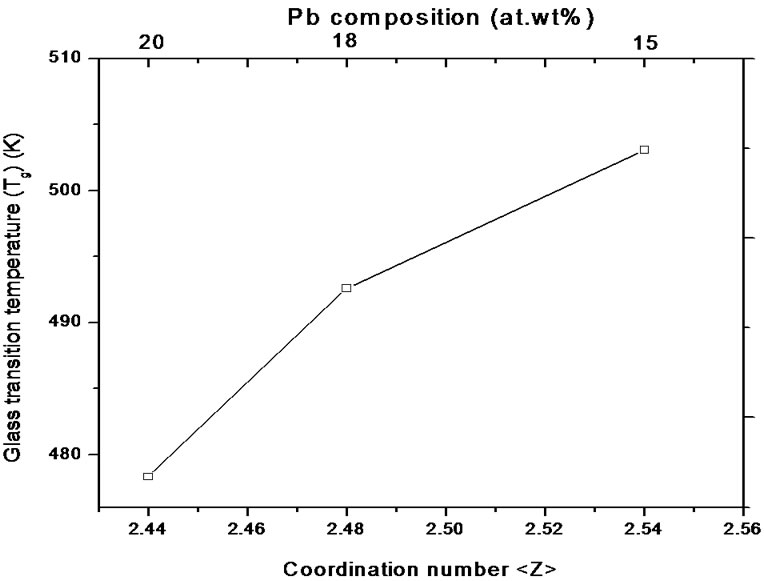
Figure 4. Variation of glass transition temperature (Tg) with coordination number,
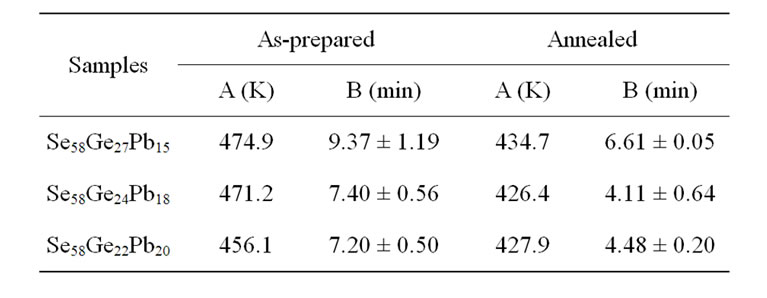
Table 2. The values of A and B for as-prepared and annealed samples of Se58Ge42-xPbx (x = 15, 18 & 20) glassy alloys.
again due to the onset of crystallization of glass at lower temperature.
Another approach, which indirectly involves the dependence of Tg on heating rate (α) is the Kissinger equation [9]. This approach is used for the evaluation of the activation energy of the amorphous-glass transition, Et, inspite of the fact that this equation was employed for the evaluation of the activation energy of crystallization. The Kissinger model is based on peak shift method and if the shifts in the glass transition peak with heating rate are almost similar to peak shifts in the crystallization region, then this equation can be used for the determination of activation energy of glass transition [28]. This condition is satisfied in measurements mentioned in this study. The Kissinger equation relating the peak glass transition temperature with heating rate is given by:
 (2)
(2)
where Tgp is the peak glass transition temperature and R is gas constant. Figure 5 shows the variation of  with 1000/Tgp for as-prepared and annealed samples of Se58Ge27Pb15 glass as a representative case. Figure 5 gives straight lines and the slope of these lines gives the activation energy of glass transition (Et). The values of activation energy for the glass transition, Et, for as-prepared and annealed samples of Se58Ge42-xPbx (x = 15, 18 & 20) system obtained from Kissinger model are given in Table 3" target="_self"> Table 3.
The glass transition activation energy is the amount of energy that is absorbed by a group of atoms in the glassy region so that a jump from one metastable state to another is possible. In other words, this activation energy is involved in the molecular motions and rearrangements of the atoms around the glass transition temperature. When the sample is heated in the DSC furnace, the atoms undergo infrequent transitions between local potential minima separated by different energy barriers in the configuration space where each local minimum represents a different structure. The most stable local minimum in the glassy region has lowest internal energy. Accordingly, the atoms in a glass having minimum activation energy have higher probability to jump to the metastable (or local minimum) state of lowest internal energy and hence is most stable. From Table 3, it is observed that activation energy of glass transition (Et) decreases with the increase in Pb content in the samples. When Pb is introduced in the Se-Ge system, it tries to satisfy its coordination requirements by making bonds with Se. As more and more Pb-Se bonds are formed, the internal energy of the glass increases and inturn glass transition activation energy decreases [29-31]. Therefore it may be concluded
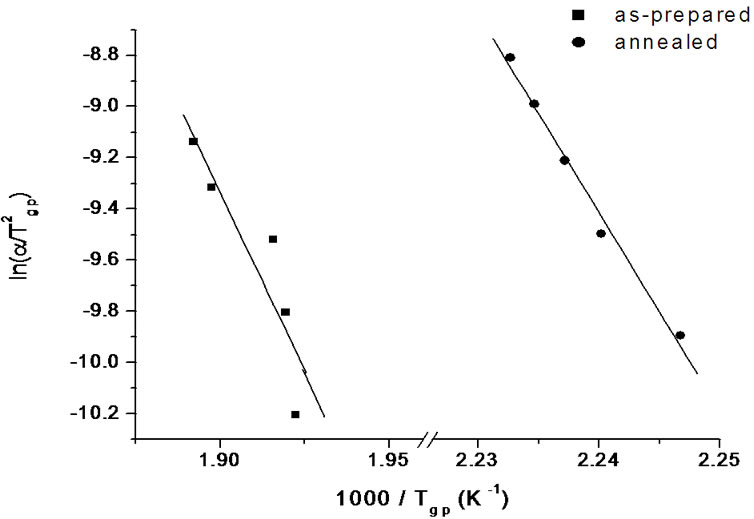
Figure 5. Variation of  with 1000/Tgp for as-prepared and annealed samples of Se58Ge27Pb15 glass.
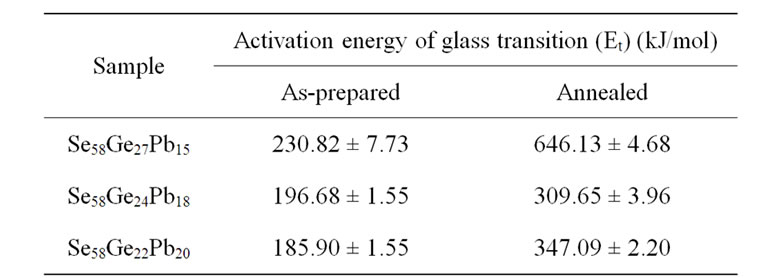
Table 3. Values of activation energy for the glass transition Et for as-prepared and annealed samples of Se58Ge42-xPbx (x = 15, 18 & 20) system obtained from Kissinger model.
that Se58Ge22Pb20 glass is most stable among all the samples and stability increases with the increase in Pb content in Se58Ge42-xPbx (x = 15, 18 & 20) glassy system. Further, it is also observed that there is an increment in the values of activation energy, Et, after annealing as the local minimum lowers down. Therefore one can say that after annealing, atoms require large amount of energy to make transitions between local minima’s and therefore systems become less stable.
3.2.2. Crystallization
The kinetic analysis of crystallization reaction is related to the knowledge of the activation energy of crystallization (Ec), Avrami exponent (n) and the frequency factor (Ko). The activation energies to be considered in a amorphous– crystalline transformation process are the activation energy for nucleation (En), activation energy for crystal growth (EG) and that for the whole process of crystallization, called the activation energy for crystallization denoted by Ec. The thermal analysis methods enable the determination of Ec [32,33]. It has been pointed out [34] that in non-isothermal measurements, the crystallization exotherm mainly characterizes the growth of the crystalline phase from the amorphous matrix; nucleation is more or less calorimetrically unobservable at temperatures below the crystallization exotherm. In other words, the nucleation takes place very rapidly and immediately after heating of the material in the initial stages of the crystallization exotherm. Consequently, the obtained values of Ec can be taken to represent the activation energy of growth, EG or Ec = EG.
The activation energy of crystallization (Ec) for the phases of the investigated glasses has been estimated using different models of Kissinger, Augis and Bennett and Matusita and Sakka.
3.2.2.1. Kissinger Model
The activation energy of crystallization (Ec) for the first and second crystallization stages of Se58Ge42-xPbx (x = 15, 18 & 20) glasses is determined using the following equation proposed by Kissinger [9]:
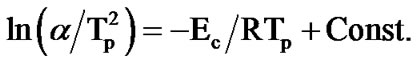 (3)
(3)
where, Tp is the peak crystallization temperature. Figure 6" target="_self"> Figure 6 show the variation of  with 1000/Tp for as-prepared and annealed sample of Se58Ge27Pb15 glass as a representative case. The variation of
  with 1000/Tp is straight line for all the samples. The slope of these straight lines gives the activation energy of crystallization (Ec).
3.2.2.2. Augis-Bennett Approximation
The activation energy of crystallization, Ec, can also be determined by an approximation method developed by Augis and Bennett [35]. The relation used by them is of the form:
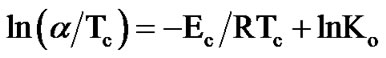 (4)
(4)
where, Ko is the frequency factor and R is gas constant.
The variation of  with 1000/Tc gives a straight line and the slope of this straight line gives the value of activation energy of crystallization (Ec). Figure 7" target="_self"> Figure 7 shows the variation of
  with 1000/Tc for asprepared and annealed samples of Se58Ge27Pb15 glass as a representative case. Table 4 shows the values of activation energy of crystallization (Ec) obtained from Kissinger and Augis and Bennett model.
From Table 4, it is observed that values of activation energy of crystallization (Ec) increases with the increase in lead content in the samples and is highest for Se58Ge22Pb20 glass. Since it is well known that activation energy of crystallization (Ec) is the energy required by the atoms in the glassy region to go to crystalline region, therefore one may infer that the sample with the highest value of Ec, will be the most stable sample. Further, it is also observed that activation energy of crystallization “Ec” decreases after annealing. This means that group of atoms in the glassy state requires less amount of energy to jump to crystalline state hence, making the sample less stable and prone to crystallization, a conclusion similar to glass transition activation energy “Et”. This is again an indication of the fact that annealing of glass leads to crystallization at lower temperature.
The Augis and Bennett method has an extra advantage over the other methods employed in the literature for the determination of activation energy of crystallization. Here, the intercept of  against 1000/Tc gives the value of pre-exponential factor Ko (frequency factor) of Arrhenius equation (Equation (5)), which is defined as the number of attempts made by the nuclei per second to overcome the energy barrier. This also provides information for the calculation of number of nucleation sites, present in the material for crystal growth. The Arrhenius equation is given by:
 (5)
(5)
where, K is the crystallization rate factor.
Knowing the value of ln Ko from Equation (4), the value of frequency factor (Ko) has been evaluated. The frequency factor (Ko) for as-prepared and annealed samples of Se58Ge42-xPbx (x = 15, 18 & 20) glassy system are
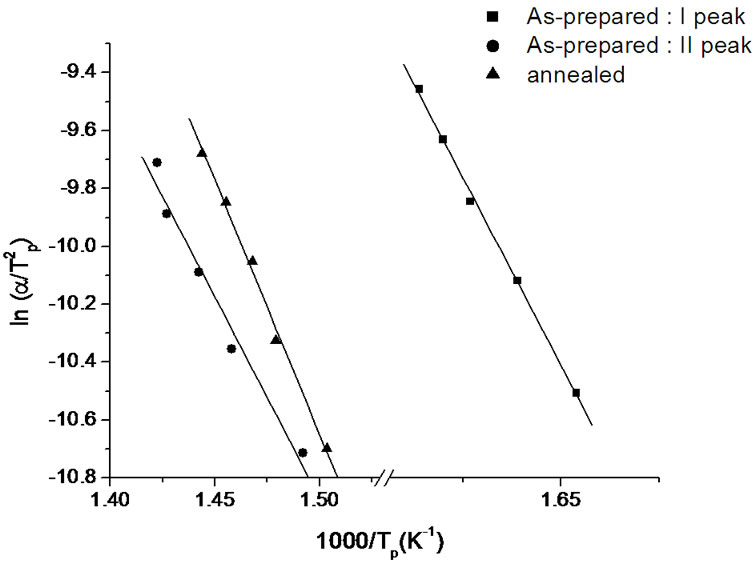
Figure 6. Variation of  with 1000/Tp for as-prepared and annealed sample of Se58Ge27Pb15 glass.
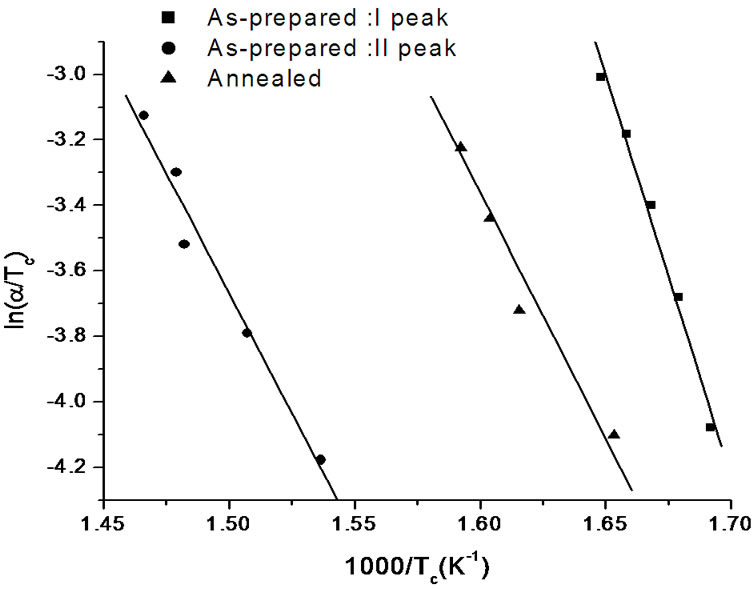
Figure 7. Variation of  with 1000/Tc for as-prepared and annealed samples of Se58Ge27Pb15 glass.
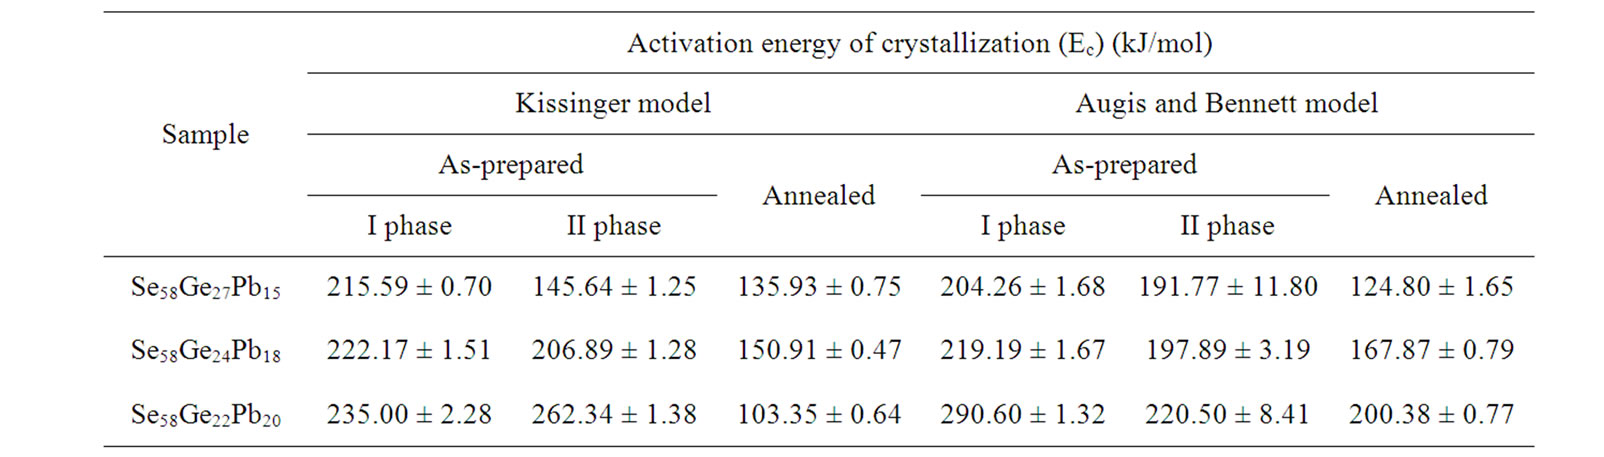
Table 4. Values of activation energy of crystallization (Ec) obtained from Kissinger and Augis and Bennett model.
given in Table 5.
From Table 5, it is observed that the value of frequency factor (Ko) of as-prepared samples decreases with the increase in lead (Pb) content in the samples. These values are indicative of the fact that the barrier to crystallization increases with increase in lead content, which inturn decreases the attempts made by the nuclei’s to overcome the crystallization barrier. The decrease in number of attempts to cross crystallization barrier also decreases the tendency of crystallization and hence makes the sample more stable against crystallization. The number of attempts made by the nuclei’s to cross the barrier and hence the tendency to crystallization is lowest for Se58Ge22Pb20 glass, which indicates the higher stability of this glassy composition. The higher value of activation energy of crystallization (Table 4) of this sample also confirms the same fact. It is also observed that there is an increase in the value of frequency factor (Ko) after annealing, which infers that the number of attempts made by the nuclei’s to cross the crystallization barrier are higher in this case.
3.2.2.3. Matusita Model
Crystallization kinetics has also been obtained using a method suggested specifically for non-isothermal experiments by Matusita et al. [17-19]. The volume of fraction crystallized (x), precipitated in a glass heated at constant heating rate (α) is related to the effective activation energy of amorphous-crystalline transformation, (Ec), through the following expression:
 (6)
(6)
where m is an integer which depends on the dimensionality of growth of the crystal, and n being a numerical factor depending also on the nucleation process. For asquenched glasses containing no nuclei m is taken as (n – 1) and for glasses containing a sufficiently large number of nuclei, which might occur due to annealing of the as quenched glass, m is taken equal to n [19]. In order to investigate the heating rate dependence of the kinetic parameters, n and Ec, the data using Matusita model have been analysed. Figures 8 and 9 show the variation of  with 1000/T at different heating rates for first and second crystallization peak of as-prepared sample of Se58Ge27Pb15 glass as a representative case. Figure 10 shows the variation of
  with 1000/T at different heating rates for annealed sample of Se58Ge27Pb15 glass as a representative case.
The straight lines in these curves are linear fit according to Equation (6). Figures 8-10 clearly show that the plots are linear for all the temperatures in the lower temperature range but show a deviation from linearity at higher temperatures. This deviation from the straight line behaviour at higher temperatures is attributed to the saturation of nucleation sites in the final stages of crystallization [36] or to the restriction of crystal growth by the small size of the particles [37]. In the curves for annealed sample, one can see that saturation of nucleation
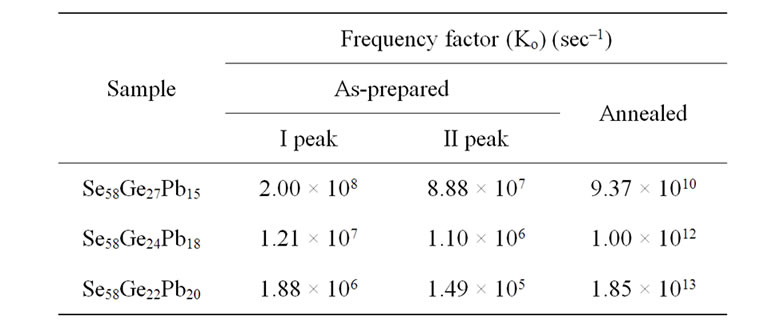
Table 5. Values of frequency factor (Ko) obtained from Augis and Bennett model for as-prepared and annealed samples of Se58Ge42-xPbx (x = 15,18 & 20) glassy system.
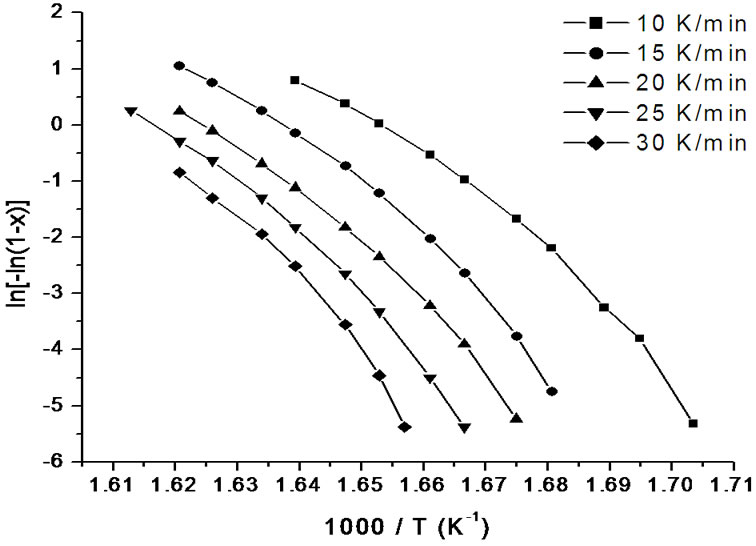
Figure 8. Variation of 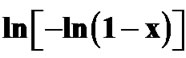 with 1000/T at different heating rates for first crystallization peak of as-prepared sample of Se58Ge27Pb15 glass.
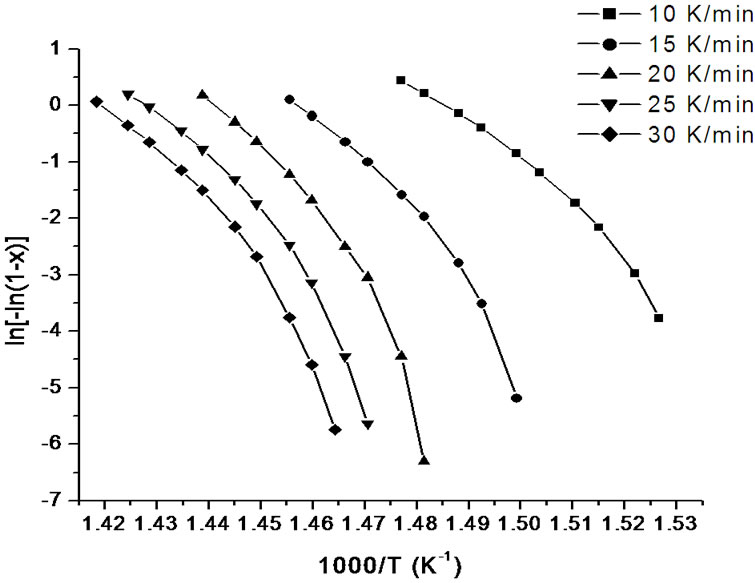
Figure 9. Variation of  with 1000/T at different heating rates for second crystallization peak of asprepared sample of Se58Ge27Pb15 glass.
Figure 10. Variation of  with 1000/T at different heating rates for annealed samples of Se58Ge27Pb15 glass.
sites occurs at lower temperatures as compared to asprepared samples which again agrees to our already stated argument of crystallization at lower temperatures in annealed samples. The values of Ec at different heating rates can be obtained from the slopes of these fitted straight lines.
The Avrami exponent (n) can also be determined using Matusita equation (Equation (6)) by plotting  against ln(α) at different temperatures. Figure 11 shows the variation of
  with
with  at different temperatures for first crystallization peak of as-prepared sample of Se58Ge27Pb15 glass as a representative case while Figure 12 show the variation of
  with
with  at different temperatures for second crystallization peak of as-prepared sample of Se58Ge27Pb15 glass as a representative case. Figure 13 shows the variation of
  with
with  at different temperatures for annealed sample of Se58Ge27Pb15 glass as a representative case.
It is clear from the Figures 11-13 that n is temperature independent and hence an average value can be calculated. The value of n has been evaluated from the slopes of the straight line fit of these relations. For all the as-prepared samples of Se58Ge42-xPbx (x = 15, 18 & 20) glasses, no heat treatment was performed prior to the DSC scans to nucleate the sample, therefore, n is considered to be equal to (m + 1) while for the annealed samples, the value of n is taken to be equal to m, since they were annealed prior to DSC scans. Table 6 shows the values of activation energy of crystallization (Ec), Avrami index (n) and dimensionality of growth (m) for the as-prepared and annealed samples of Se58Ge42-xPbx (x = 15, 18 & 20) glassy systems.
From Table 6, it is observed that values of activation energy of crystallization (Ec) increases with increase in
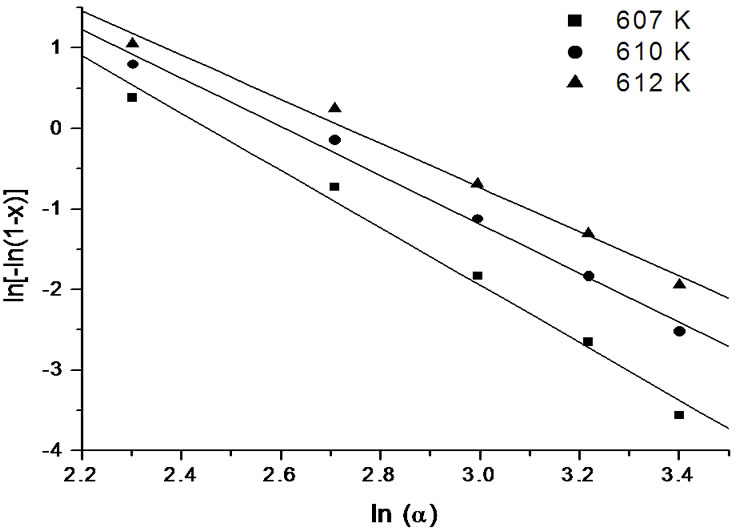
Figure 11. Variation of  with ln(α) at different temperatures for first crystallization peak of asprepared Se58Ge27Pb15 glass.
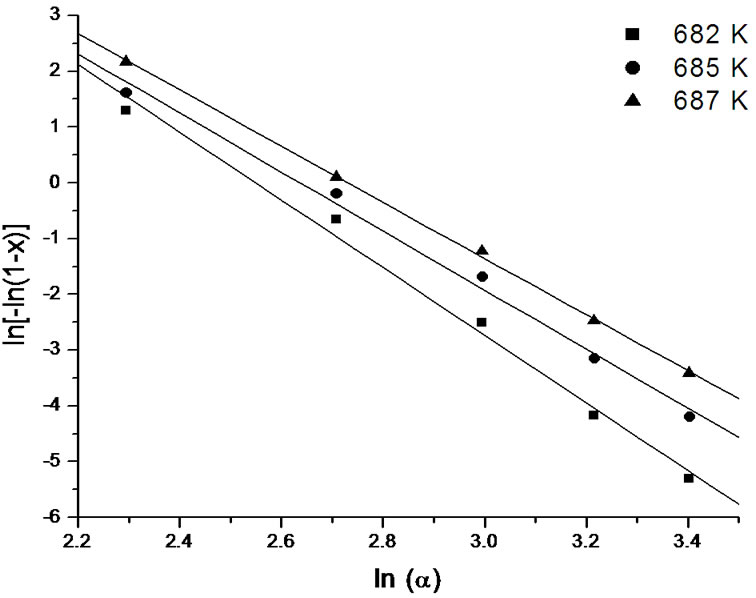
Figure 12. Variation of  with ln(α) at different temperatures for second crystallization peak of asprepared Se58Ge27Pb15 glass.
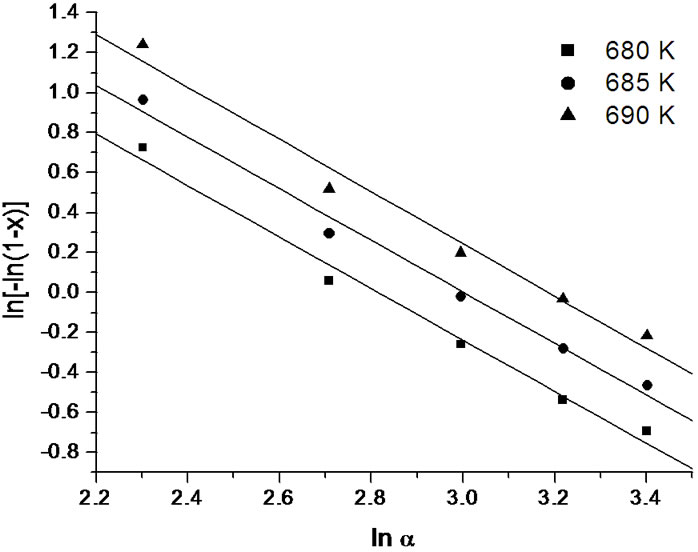
Figure 13. Variation of  with ln(α) at different temperatures for annealed sample of Se58Ge27Pb15 glass.
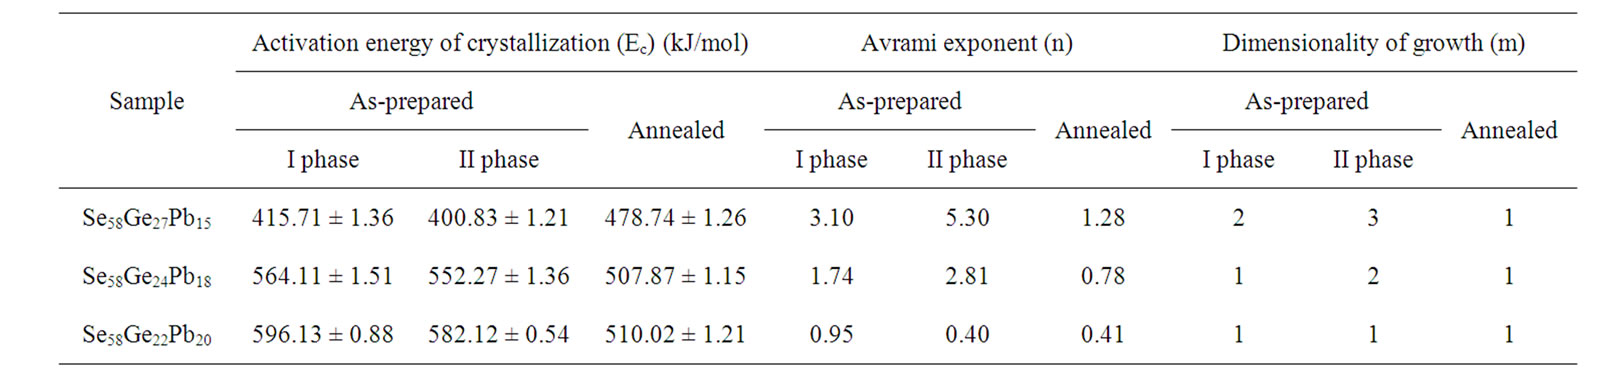
Table 6. Values of activation energy of crystallization (Ec), Avrami index (n) and dimensionality of growth (m) for the asprepared and annealed samples of Se58Ge42-xPbx (x = 15, 18 & 20) glassy alloys as obtained from Matusita model.
lead (Pb) content for both the crystalline phases of the samples. This suggests that energy barrier to crystallization increases with increase in lead content in the samples and hence making the sample more stable at higher Pb composition. The results matches with results obtained from Kissinger and Augis and Bennett model. The activation energy of glass transition, Et, also gives the same conclusion. Table 6 also clearly indicates that the values of n are not integer, which means that the crystallization process of as-prepared and annealed samples occurs with different mechanisms. It is observed that before annealing all the samples predominantly crystallizes in one, two and three dimensions suggesting surface and bulk nucleation while, the annealed samples of the system crystallize in one dimension suggesting surface nucleation. Hence, one can say that dimensionality of growth (m) of all the glassy samples of the series also changes after annealing i.e. it changes from bulk nucleation to surface nucleation.
The difference in the activation energy as calculated with the different models, even for the same sample, may be attributed to the different approximations used in the models. Besides, one of the factors influencing the activation energy may be the temperature gradient, which may not be the same for all heating rates, when the sample is placed in the DSC furnace. This arises due to the error in placing the pan in the DSC furnace with respect to the position of thermocouple. Another factor influencing the activation energy is that the models like Kissinger equation were developed for clays but have been frequently used in literatures [38,39] for determining the activation energy of the glasses.
4. Conclusions
A systematic study of as-prepared and annealed samples of Se58Ge42-xPbx (x = 15, 18 & 20) glassy alloys leads to the following conclusions:
1) The Se58Ge42-xPbx (x = 15, 18 & 20) glassy alloys exhibits single glass transition and double crystallization on heating. The first crystallization is due to the GeSe2 phase while the second crystallization correspond to PbSe phase.
2) The decrease of Et to a minimum value and increase of Ec to maximum value with the increase in lead (Pb) content in the Ge-Se glassy system is suggestive of the fact that stability of the glassy samples increases on the increase of lead content.
3) It can be also be concluded from the values of activation energy of glass transition “Et” and activation energy of crystallization “Ec” of all the samples that after annealing the sample at intermediate temperature between first and second crystallization peaks, glasses become less stable. The values of frequency factor (Ko) also leads to the same conclusion.
4) Dimensionality of growth (m) of crystals decreases to one dimension from two and three dimensions after annealing, suggesting a decrease from bulk nucleation to surface nucleation in annealed samples.
5. Acknowledgements
One of the authors (Deepika) is grateful to the DSA programme of UGC in the department for providing financial support in the form of fellowship during this work. Authors are also thankful to FIST programme of UGC for providing DSC and XRD equipments as the central facility in the department of Physics, for performing research experiments. Authors are also thankful to Mr. Kuldeep S. Rathore and Ms. Manasvi Dixit for their help in various ways during the course of this work.
REFERENCES
- M. M. Hafiz, M. M. Ibrahim, M. Dongol and F. H. Hammad, “Effect of Composition on the Structure and Electrical Properties of As-Se-Cu Glasses,” Journal of Applied Physics, Vol. 54, No. 4, 1983, pp. 1950-1954. doi:10.1063/1.332249
- M. A. Abdel-Rahim, A. H. Moharram, M. Dongol and M. M. Hafiz, “Experimental Studies of the Ge-Sb-Se System,” Journal of Physics and Chemistry of Solids, Vol. 51, No. 4, 1990, pp. 355-359. doi:10.1016/0022-3697(90)90119-Z
- D. Chaudhary, K. S. Rathore and N. S. Saxena, “Evaluation of Specific Heat and Related Thermodynamic Properties of Ge1–xSnxSe2.5 (0 ≤ x ≤ 0.5) Glasses,” Journal of Thermal Analysis and Calorimetry, Vol. 98, No. 3, 2009, pp. 725-730. doi:10.1007/s10973-009-0396-6
- R. Jain, N. S. Saxena, D. Bhandari, S. K. Sharma and K. V. R. Rao, “Kinetics of CuxTi100-x (x = 43, 50 and 53 at%) Glasses,” Physica B: Condensed Matter, Vol. 301, No. 3-4, 2001, pp. 341-348.
- S. O. Kasap and C. Juhaz, “Kinematical Transformations in Amorphous Selenium Alloys Used in Xerography,” Journal of Materials Science, Vol. 24, No. 4, 1986, pp. 1329- 1340. doi:10.1007/BF00553271
- J. P. Larmagnac, J. Grenet and P. Michon, “Glass Transition Temperature Dependence on Heating Rate and on Ageing for Amorphous Selenium Films,” Journal of NonCrystalline Solids, Vol. 45, No. 2, 1981, pp. 157-168.
- C. T. Moynihan, A. J. Easteal, J. Wilder and J. Tucker, “Dependence of the Glass Transition Temperature on Heating and Cooling Rate,” The Journal of Physical Chemistry, Vol. 78, No. 26, 1974, pp. 2673-2677. doi:10.1021/j100619a008
- S. Mahadevan and A. Giridhar, “Copper as an Additive in the As0.4Se0.3Te0.3 Glass: Mean Atomic Volume and Tg,” Journal of Non-Crystalline Solids, Vol. 221, No. 2-3, 1997, pp. 281-289. doi:10.1016/S0022-3093(97)00336-0
- H. E. Kissinger, “Reaction Kinetics in Differential Thermal Analysis,” Analytical Chemistry, Vol. 29, No. 11, 1957, pp. 1702-1706. doi:10.1021/ac60131a045
- T. Ozawa, “Kinetic Analysis of Derivative Curves in Thermal Analysis,” Journal of Thermal Analysis and Calorimetry, Vol. 2, No. 3, 1970, pp. 301-324. doi:10.1007/BF01911411
- J. Colmenero and J. M. Barandiar, “Crystallization of Al23- Te77 Glasses,” Journal of Non-Crystalline Solids, Vol. 30, No. 3, 1979, pp. 263-271. doi:10.1016/0022-3093(79)90165-0
- A. Lucci, L. Battezzati, C. Antonione and G. Riontino, “Influence of Preannealing on Crystallization Kinetics of Some Metallic Glasses,” Journal of Non-Crystalline Solids, Vol. 44, No. 2-3, 1981, pp. 287-295. doi:10.1016/0022-3093(81)90031-4
- D. W. Henderson, “Thermal Analysis of Non-Isothermal Crystallization Kinetics in Glass Forming Liquids,” Journal of Non-Crystalline Solids, Vol. 30, No. 3, 1979, pp. 301-315. doi:10.1016/0022-3093(79)90169-8
- E. M. Marseglia, “Kinetic Theory of Crystallization of Amorphous Materials,” Journal of Non-Crystalline Solids, Vol. 41, No. 1, 1980, pp. 31-36. doi:10.1016/0022-3093(80)90188-X
- K. Harnisch and R. Lanzenberger, “Determination of the Avrami Exponent by Non-Isothermal Analyses,” Journal of Non-Crystalline Solids, Vol. 53, No. 3, 1982, pp. 235- 245. doi:10.1016/0022-3093(82)90083-7
- M. E. Fine, “Introduction to Phase Transformationin Condensed System,” Macmillan, New York, 1964.
- K. Matusita and S. Sakka, “Kinetics Study of the Crystallization of Glass by Differential Scanning Calorimetry,” Physics and Chemistry of Glasses, Vol. 20, No. 4, 1979, pp. 81-84.
- K. Matusita and S. Sakka, “Kinetic Study of Crystallization of Glass by Differential Thermal Analysis—Criterion on Application of Kissinger Plot,” Journal of Non-Crystalline Solids, Vol. 38-39, Part 2, 1980, pp. 741-746. doi:10.1016/0022-3093(80)90525-6
- K. Matusita and S. Sakka, “Kinetic Study on Non-Isothermal Crystallization of Glass by Thermal Analysis,” Bulletin of the Institute for Chemical Research, Kyoto University, Vol. 59, No. 3, 1981, pp. 159-171.
- D. Chaudhary and N. S. Saxena, “Thermodynamics of Glass/Crystal Transformation in Se58Ge42−xPbx (9 ≤ x ≤ 20) Glasses,” The Journal of Physical Chemistry B, Vol. 114, No. 1, 2010, pp. 28-35.
- N. Tohge, Y. Yamamato, T. Minami and M. Tanaka, “Preparation of n-Type Semiconducting Ge20Bi10Se70 Glass,” Applied Physics Letters, Vol. 34, No. 10, 1979, pp. 640- 641. doi:10.1063/1.90621
- N. Tohge, T. Minami, Y. Yamamato and M. Tanaka, “Electrical Transport in n-Type Semiconducting Ge120Bix- Se70−xTe10 Glasses,” Journal of Non-Crystalline Solids, Vol. 37, No. 1, 1980, pp. 23-30. doi:10.1016/0022-3093(80)90475-5
- A. A. Soliman, “Thermal Stability of Cu0.3(SSe20)0.7 Chalcogenide Glass by Differential Scanning Calorimetry,” Thermochimica Acta, Vol. 423, No. 1-2, 2004, pp. 71-76. doi:10.1016/j.tca.2004.04.022
- A. K. Pattanaik and A. Srinivasan, “Differential Scanning Calorimeter Studies on Pb Modified Ge-Se-Te Glasses,” Journal of Materials Science, Vol. 38, No. 11, 2003, pp. 2511-2516. doi:10.1023/A:1023925706637
- K. Tanaka, “Structural Phase Transitions in Chalcogenide Glasses,” Physical Review B, Vol. 39, No. 2, 1989, pp. 1270-1279. doi: 10.1103/PhysRevB.39.1270
- A. N. Sreeram, D. R. Swiler and A. K. Varshneya, “GibbsDiMarzio Equation to Describe the Glass Transition Temperature Trends in Multicomponent Chalcogenide Glasses,” Journal of Non-Crystalline Solids, Vol. 127, No. 3, 1991, pp. 287-297.
- M. Lasocka, “The Effect of Scanning Rate on Glass Transition Temperature of Splat-Cooled Te85Ge15,” Materials Science and Engineering, Vol. 23, No. 2-3, 1976, pp. 173-177. doi:10.1016/0025-5416(76)90189-0
- K. White, R. L. Crane and J. A. Snide, “Crystallization Kinetics of As2–xSbxS3 Glass in Bulk and Thin Film Form,” Journal of Non-Crystalline Solids, Vol. 103, No. 2-3, 1988, pp. 210-220. doi:10.1016/0022-3093(88)90200-1
- H. A. Abd El Ghani, M. M. Abd El Rahim, M. M. Wakad, A. Abo Sehli and N. Assraan, “Crystallization Kinetics and Thermal Stability of Some Compositions of Ge-In-Se Chalcogenide System,” Physica B: Condensed Matter, Vol. 381, No. 1-2, 2006, pp. 156-163.
- M. M. A. Imran, D. Bhandari and N. S. Saxena, “Enthalpy Recovery during Structural Relaxation of Se96In4 Chalcogenide Glass,” Physica B: Condensed Matter, Vol. 293, No. 3-4, 2001, pp. 394-401. doi:10.1016/S0921-4526(00)00543-3
- N. S. Saxena, “Phase Transformation Kinetics and Related Thermodynamic and Optical Properties in Chalcogenide Glasses,” Journal of Non-Crystalline Solids, Vol. 345-346, 2004, pp. 161-168. doi:10.1016/j.jnoncrysol.2004.08.016
- V. S. Shiryaev, “Calorimetric Study of Characteristic Temperatures and Crystallization Behavior in Ge-As-Se-Te Glass System,” Journal of Physics and Chemistry of Solids, Vol. 65, No. 10, 2004, pp. 1737-1744. doi:10.1016/j.jpcs.2004.05.001
- M. A. Abdel-Rahim, “Crystallization Kinetics of Overlapping Phases in Cu6Ge14Te80 Chalcogenide Glass,” Physica B: Condensed Matter, Vol. 322, No. 3-4, 2002, pp. 252-261. doi:10.1016/S0921-4526(02)01190-0
- E. Illekova, “On the Various Activation Energies at Crystallization of Amorphous Metallic Materials,” Journal of Non-Crystalline Solids, Vol. 68, No. 1, 1984, pp. 153-156. doi:10.1016/0022-3093(84)90042-5
- J. A. Augis and J. E. Bennett, “Calculation of the Avrami Parameters for Heterogeneous Solid State Reactions Using a Modification of the Kissinger Method,” Journal of Thermal Analysis and Calorimetry, Vol. 13, No. 2, 1978, pp. 283-292. doi:10.1007/BF01912301
- A. A. Abu-Sehly and A. A. Elabbar, “Kinetics of Crystallization in Amorphous Se73.2Te21.1Sb5.7 under Isochronal Conditions: Effect of Heating Rate on the Activation Energy,” Physica B: Condensed Matter, Vol. 390, No. 1-2, 2007, pp. 196-202. doi:10.1016/j.physb.2006.08.014
- M. M. A. Imran, N. S. Saxena, D. Bhandari and M. Hussain, “Glass Transition Phenomena, Crystallization Kinetics and Enthalpy Released in Binary Se100–xInx (x = 2, 4 and 10) Semiconducting Glasses,” Physica Status Solidi A, Vol. 181, No. 2, 2000, pp. 357-368. doi:10.1002/1521-396X(200010)181:2<357::AID-PSSA357>3.0.CO;2-H
- A. A. Elabbar, “Kinetics of the Glass Transition in Se72- Te23Sb5 Chalcogenide Glass: Variation of the Activation Energy,” Journal of Alloys and Compounds, Vol. 476, No. 1-2, 2009, pp. 125-129. doi:10.1016/j.jallcom.2008.08.056
- K. A. Aly, A. A. Othman and A. M. Absousehly, “Effect of Te Additions on the Glass Transition and Crystallization Kinetics of (Sb15As30Se55)100−xTex Amorphous Solids,” Journal of Alloys and Compounds, Vol. 467, No. 1-2, 2009, p. 417. doi:10.1016/j.jallcom.2007.12.009
NOTES
*Corresponding authors.