Journal of Crystallization Process and Technology
Vol. 2 No. 3 (2012) , Article ID: 21377 , 4 pages DOI:10.4236/jcpt.2012.23015
Optical and Dielectric Studies on L-Valinium Picrate Single Crystal
![]()
1Department of Physics, Hindustan Institute of Technology, Padur, India; 2Department of Physics, Loyola College, Chennai, India.
Email: *sureshsagadevan@yahoo.co.in
Received May 4th, 2012; revised June 2nd, 2012; accepted June 11th, 2012
Keywords: Solution Growth; Single Crystal XRD; Optical Transmission; Dielectric Studies; Photoconductivity Studies
ABSTRACT
Single crystals of L-Valinium picrate were grown from aqueous solution by slow evaporation technique. Single crystal X-ray diffraction analysis reveals that the crystal belongs to monoclinic system. The optical transmission study reveals the transparency of the crystal in the entire visible region and the cut off wave length has been found to be 470 nm. The optical band gap is found to be 2.55 eV. The transmittance of L-Valinium picrate crystal has been used to calculate the refractive index (n), the extinction coefficient (K) and both the real (εr) and imaginary (εi) components of the dielectric constant as functions of wavelength. Low dielectric loss at high frequency region is indicative of enhanced optical quality with lesser defects. Photoconductivity measurements carried out on the grown crystal reveal the negative photoconducting nature.
1. Introduction
Crystal growth is a frontier area of science and technology, which plays a major role in the technology of photonics. The field of nonlinear optics has been in the hands of materials scientists for the past five decades for which organic materials are attracting a great deal of attention, as they have large optical susceptibilities, inherent ultrafast response time and good optical properties as compared to that of inorganic crystals. Research in organic and inorganic functionalized nonlinear optical materials plays a crucial role because of their molecular interactions, bond strength, high molecular polarizability, easy incorporation of ions in the lattice, etc. [1] and [2]. In the recent years there has been a growing interest in nonlinear optical materials due to their effective usage in the field of electro-optical devices, data storage technology and optical signal processing [3]. However, semiorganic single crystals are attracting great attention in the field of nonlinear optics because of their high optical nonlinearity, chemical flexibility of ions, thermal stability and excellent transmittance in the UV—visible region [4,5]. In the present investigation, we report optical, dielectric, and Photoconductivity properties of L-Valinium picrate single crystals.
2. Experimental
2.1. Crystal Growth
Single crystals of L-Valinium picrate were grown, from aqueous solution by slow evaporation technique. The solution was prepared by dissolving equimolar amounts of picric acid and L-Valine in deionized water and stirred well to yield a homogenous mixture of solution. A saturated solution was prepared and the solution was filtered. The filtered solution was taken in a beaker which was hermetically sealed to avoid the evaporation of the solvent.
3. Results and Discussion
3.1. Single Crystal X-Ray Diffraction Studies
Single crystal X-ray diffraction analysis for the grown crystals has been carried out to identify the cell parameters using an ENRAF NONIUS CAD 4 automatic X-ray Diffractometer. The title crystal belongs to monoclinic crystal system and the lattice parameters are a = 9.96 Å; b = 6.23 Å; c = 12.64 Å, β = 110.40˚ and agree well with the reported literature [6].
3.2. Optical Studies
The optical transmittance spectrum of L-Valinium picrate was recorded in the range 300 - 1100 nm with a crystal of thickness 2 mm. The Figure 1 shows that the crystal has a wide transmission of above 70% in the entire range without any absorption peak. The lower cutoff wavelength of L-Valinium picrate is 470 nm. The crystal has good optical transmission in the visible region. The transparency in the visible region for this crystal suggests its suitability for second harmonic generation.
The measured transmittance (T) was used to calculate the absorption coefficient (α) using the formula
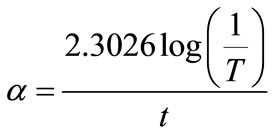 (1)
(1)
where t is the thickness of the sample. Optical band gap (Eg) was evaluated from the transmission spectrum and optical absorption coefficient (α) near the absorption edge is given by [7].
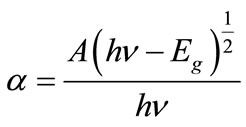 (2)
(2)
where A is a constant, Eg the optical band gap, h the Planck constant and n the frequency of the incident photons. The band gap of L-Valinium picrate crystal was estimated by plotting  versus
  as shown in Figure 2. From the figure, the value of band gap was found to be 2.55 eV.
Extinction coefficient (K) can be obtained from the following equation:
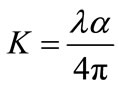 (3)
(3)
The transmittance (T) is given by
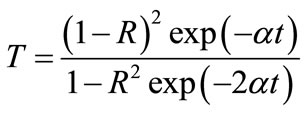 (4)
(4)
Reflectance (R) in terms of absorption coefficient can be obtained from the above equation. Hence, Equation (5)
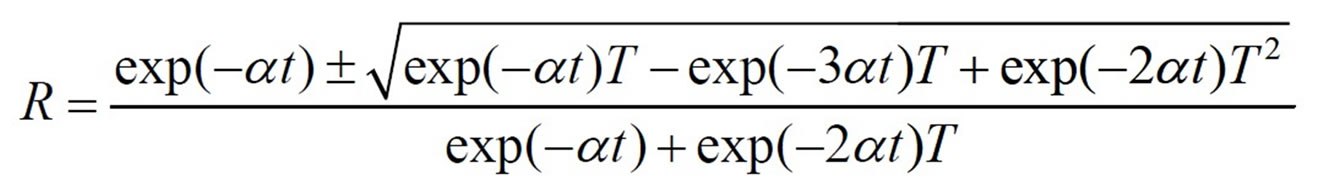 (5)
(5) Refractive index (n) can be determined from reflectance data using the following equation;
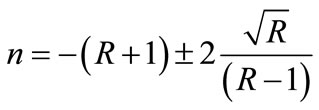 (6)
(6)
The refractive index (n) is 1.41 at λ = 1100 nm. From the optical constants, electric susceptibility (χC) can be calculated according to the following relation [8]
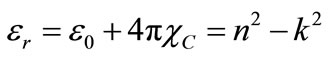 (7)
(7)
Hence,
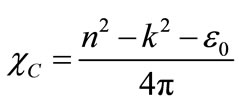 (8)
(8)
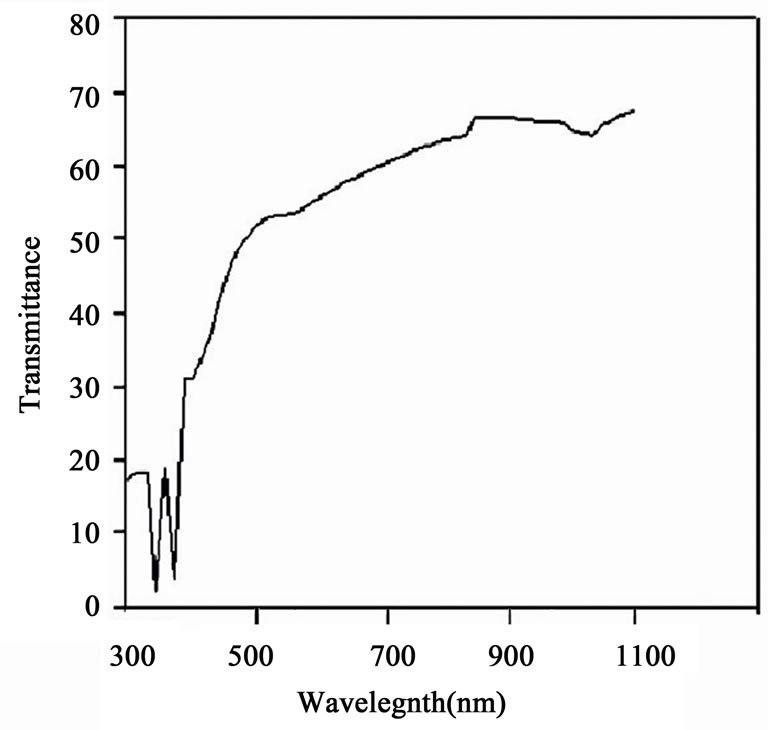
Figure 1. Transmittance spectrum of LVP.
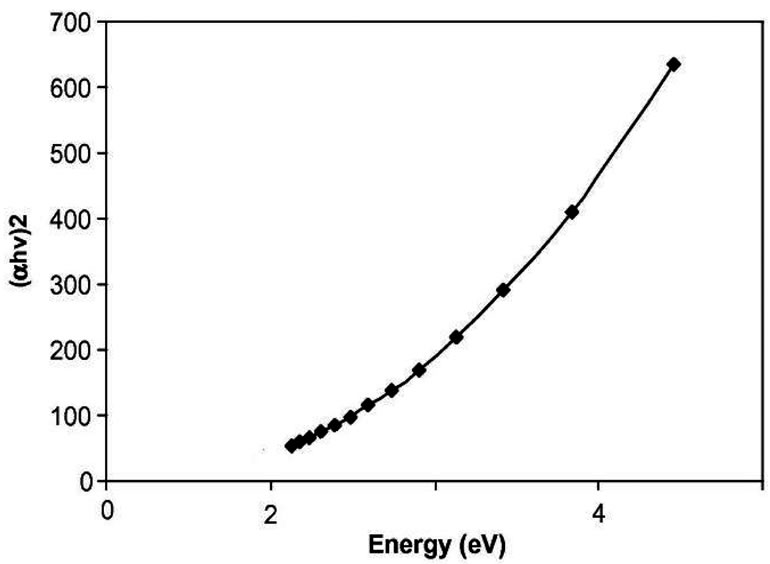
Figure 2. (αhv)2 vs photon energy (hν).
where  is the dielectric constant. The value of electric susceptibility χC is 0.163 at
 ![]() = 1100 nm. The real part dielectric constant
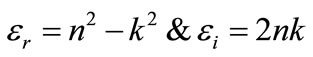
= 1100 nm. The real part dielectric constant  and imaginary part dielectric constant
  can be calculated from the following relations [9]
 (9)
(9)
The value of real  and
and  imaginary dielectric constants at
 ![]() = 1100 nm are 1.352 and 5.612 × 10⁻⁵, respectively.
= 1100 nm are 1.352 and 5.612 × 10⁻⁵, respectively.
3.3. Dielectric Studies
The dielectric constant and the dielectric loss of the L-
Valinium picrate crystals were studied at different temperatures using a HIOKI 3532 LCR HITESTER in the frequency region from 50 Hz to 5 MHz. The dielectric constant and dielectric loss have been calculate using Equations (10) and (11)
 (10)
(10)
 (11)
(11)
where d is the thickness of the sample; A is the area of the sample. Figure 3 shows the plot of dielectric constant versus log frequency. The high value of dielectric constant at low frequencies may be due to the presence of all the four polarizations, namely, space charge, orientation, electronic and ionic polarization and its low value at higher frequencies may be due to the loss of significance of these polarizations gradually [10]. From the plot, it is also observed that dielectric constant increases with an increase in temperature. The variation of dielectric loss with frequency is shown in Figure 4. The characteristics
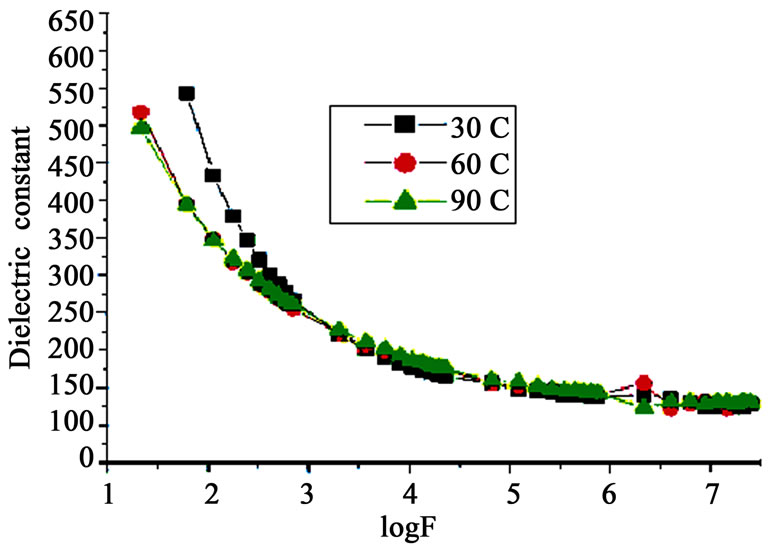
Figure 3. Plot of dielectric constant vs. log f.
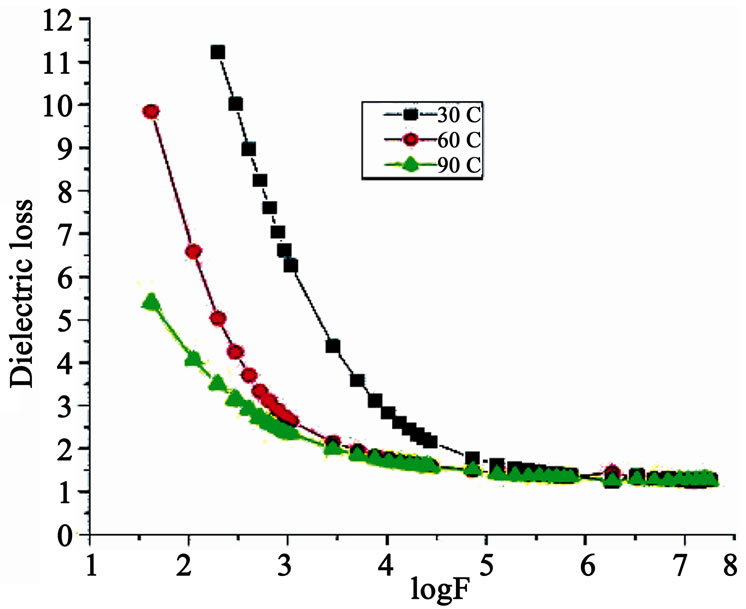
Figure 4. Plot of dielectric loss vs log f.
of low dielectric loss with high frequency for the sample suggest that it possesses enhanced optical quality with lesser defects and this parameter is imperative for nonlinear optical applications [11].
3.4. Photoconductivity Studies
Photoconductivity measurements are carried out on a cut and polished sample of the grown single crystal by fixing it onto a microscope slide. The sample is connected in series with a DC power supply and KEITHLEY 485 Picoammeter. The sample is covered with a black cloth and the voltage applied is increased from 0 to 300 V in steps of 20 V and the dark current is recorded. The photocurrentis recorded for the same values of the applied voltage. Field dependence of dark and photo currents of grown crystal is shown in Figure 5. The photocurrent is found to be lessthan the dark current at every applied electric field. This phenomenon is known as negative photoconductivity. Generally, this may be attributed to the loss of water molecules in the crystal [12]. However, the negative photoconductivity in this case may be due to the reduction in the number of charge carriers or their lifetime in the presence of radiation [13]. Decrease in lifetime with illumination could be due to the trapping process and increase in carrier velocity according to the relation
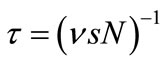 (12)
(12)
where v is the thermal velocity of the carriers, s is the capture cross-section of the recombination centers and N is the carrier concentration. As intense light falls on the sample, the lifetime decreases. In the Stockmann model, a two level scheme is proposed to explain negative pho-
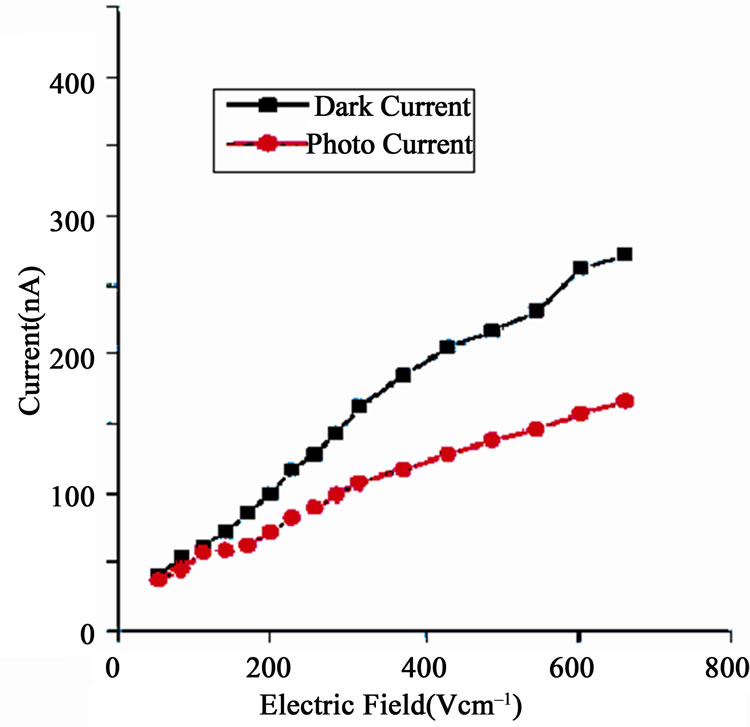
Figure 5. Field dependent photoconductivity of grown single crystal.
toconductivity [14]. As a result, the recombination of electrons and holes take place resulting in decrease in the number of mobile charge carriers, giving rise to negative photoconductivity.
4. Conclusion
Single crystals of L-Valinium picrate were grown by slow evaporation technique. Single-crystal XRD analysis confirmed that the crystals belong to monoclinic system. Optical band gap (Eg), absorption coefficient (α), extinction coefficient (K), refractive index (n), electric susceptibility χC and dielectric constants were calculated as a function of wavelength. The characteristics of low dielectric loss for the sample suggest that it possesses enhanced optical quality with lesser defects and this parameter is of vital significance for nonlinear optical applications. Photoconductivity investigations reveal the negative photoconducting nature of the title material.
REFERENCES
- C. Zhang, Z. Li, H. j. Cong, J. y. Wang, H. j. Zhang and R. I. Boughton, “Crystal growth and thermal properties of Single Crystal Monoclinic NdCOB (NdCa4O(BO3)3),” Journal of Alloys and Compounds, Vol. 507, No. 2, 2010, pp. 335-340. doi:10.1016/j.jallcom.2010.07.174
- M. J. Rosker, P. Cunningham, M. D. Ewbank, H. O. Marcy, F. R. Vachss, L. F. Warren, R. Gappinger and R. Borwick, “Salt-Based Approach for Frequency Conversion Materials,” Pure and Applied Optics, Vol. 5, No. 5, 1996, p. 667. doi:10.1088/0963-9659/5/5/020
- S. k. Gao, W. j. Chen, G. m. Wang and J. z. Chen, “Synthesis, crystal growth and characterization of organic NLO material: N-(4-nitrophenyl)-N-methyl-2-aminoacetonitrile (NPAN),” Journal of Crystal Growth, Vol. 297, No. 2, 2006, pp. 361-365. doi:10.1016/j.jcrysgro.2006.09.047
- A. P. Jeyakumari, J. Ramajothi and S. Dhanuskodi, “Structural and Microhardness Studies of a NLO material— Bisthiourea Cadmium Chloride,” Journal of Crystal Growth, Vol. 269, No. 2-4, 2004, pp. 558-564. doi:10.1016/j.jcrysgro.2004.05.059
- H. Q. Sun, D. R. Yuan, X. Q. Wang, X. F. Cheng, C. R. Gong, M. Zhou, H. Y. Xu, X. C. Wei, C. N. Luan, D. Y. Pan, Z. F. Li and X. Z. Shi, “A Novel Metal-Organic Coordination Complex Crystal: Tri-Allylthiourea Zinc Chloride (ATZC),” Crystal Research and Technology, Vol. 40, No. 9, 2005, pp. 882-886.
- K. Anitha, B. Sridhar and R. K. Rajaram, “L-Valinium picrate,” Acta Crystallographica, Vol. E60, 2004, pp. o1530-o1532. doi:10.1107/S160053680401949X
- A. Ashour, N. El-Kadry and S. A. Mahmoud, “On the electrical and Optical Properties of CdS Films Thermally Deposited by a Modified Source,” Thin Solid Films, Vol. 269, No. 1-2, 1995, pp. 117-120. doi:10.1016/0040-6090(95)06868-6
- V. Gupta and A. Mansingh, “Influence of postdeposition annealing on the structural and Optical Properties of sputtered Zinc Oxide Film,” Journal of Applied Physics, Vol. 80, No. 2, 1996, pp. 1063-1073. doi:10.1063/1.362842
- M. A. Gaffar, A. Abu El-Fadl and S. Bin Anooz, “Influence of strontiumdoping on the indirectbandgap and opticalconstants of ammoniumzincchloridecrystals,” Physica B: Condensed Matter, Vol. 327, No. 1, 2003, pp. 43-54. doi:10.1016/S0921-4526(02)01700-3
- C. P. Smyth, “Dielectric Behavior and Structure,” McGrawHill, New York, 1965.
- C. Balarew and R. Duhlew, “Application of the hard and Soft Acids and Bases Concept to Explain Ligand Coordination in Double Salt Structures,” Journal of Solid State Chemistry, Vol. 55, No. 1, 1984, pp. 1-6. doi:10.1016/0022-4596(84)90240-8
- R. H. Bube, “Photoconductivity of Solids,” Wiley, New York, 1981.
- I. M. Ashraf, H. A. Elshaik and A. M. Badr, “Photoconductivity in Tl4S3 Layered Single Crystals,” Crystal Research and Technology, Vol. 39, No. 1, 2004, pp. 63-70. doi:10.1002/crat.200310150
- V. N. Joshi, “Photoconductivity,” Marcel Dekker, New York, 1990.
NOTES
*Corresponding author.