Journal of Biophysical Chemistry
Vol.1 No.2(2010), Article ID:2542,8 pages DOI:10.4236/jbpc.2010.12013
Structure-activity correlationship and folding of recombinant Escherichia coli dihydro folate reductase (DHFR) enzyme through biochemical and biophysical approaches
1Department of Biochemical Engineering and Biotechnology, Indian Institute of Technology Delhi, Delhi, India; *Both authors contributed equally to the work
2Amity Institute of Biotechnology, Amity University, Noida, India; **Corresponding Author: pratimachaudhuri@yahoo.com
Received 5 June 2010; revised 9 July 2010; accepted 15 July 2010.
Keywords: Cellular Folding of E. coli DHFR; Structure-Function Relationship; Conformational Properties; Equilibrium Unfolding Transitions; Pathways for Denaturation and Renaturation
ABSTRACT
The design of any antagonist or inhibitor for any enzyme requires the knowledge of structure- function relationship of the protein and the optimum conformational states for maximum and minimum activities. Furthermore, designing of the inhibitors or drugs against an enzyme becomes easier if there is information available about various well characterized intermediate conformation of the molecule. In vivo folding pathway of any recombinant protein is an important parameter for understanding its ability to fold by itself inside the cell, which always dictates the downstream processing for the purification. In the present manuscript we have discussed about the in vivo and in vitro folding, and structure-function relationship of Dihydrofolate reductase enzyme. This is an important enzyme involved in the cell growth and hence inhibition or inactivation of the enzyme may reduce the cell growth. It was observed that the equilibrium unfolding transition of DHFR proceeds through the formation of intermediates having higher exposed surface hydrophobicity, unchanged enzymatic activity and minimum changes in the secondary structural elements. Because of enhanced surface hydrophobicity, and unchanged enzymatic activity, these intermediates could be a nice target for designing drugs against DHFR.
1. INTRODUCTION
Proteins are one of the most common and important cellular macromolecules, which control almost all biological processes. Every protein acquires a unique threedimensional conformation in order to be functionally effective. As unfolded polypeptides contain many more exposed hydrophobic residues than the polypeptide in their native state, they are exquisitely susceptible to aggregation. Also any small error in the process of folding produces misfolded structure, which becomes a cellular burden and is responsible for several misfolding disorders such as Alzheimer’s disease, Type II Diabetes, Parkinson’s disease and several others that are threatening human lives [1].
It is quite common that majority of over expressed recombinant proteins fail to reach a correct conformation and undergo proteolytic degradation or associate with each other to form insoluble aggregates of non native proteins known as inclusion bodies. Hence, there is a growing interest in developing strategies to prevent protein aggregation, to enhance protein refolding yields.
Dihydrofolatereductase (DHFR; 5,6,7,8-tetrahydrofolate: NADP+ oxidoreductase) (a 24 kDa protein) catalyzes the NADPH-dependent reduction of dihydrofolate (H2folate) or folic acid to tetrahydrofolate (H4folate) and is considered to be a key enzyme in folate metabolism. H2folate is the product of thymidylate synthetase and must be recycled to H4folate in order to be incorporated into tetrahydrofolate metabolic pool. After reduction of H2folate, H4folate receives one carbon unit and acts as a one-carbon donor in the biosynthesis of purines and pyrimidines and in the interconversion of amino acids [2]. Tetrahydrofolate acts as a methyl group shuttle required for the de novo synthesis of purines, thymidylic acid, and certain amino acids.
As tetrahydrofolate, the product of this reaction is the active form of folate in humans, inhibition of DHFR can cause functional folate deficiency. Folate is needed by rapidly dividing cells to make thymine, this effect may be therapeutic. For example, methotrexate is used in cancer chemotherapy because it can prevent neoplastic cells from dividing.
So, DHFR has become very important nowadays in making anti-cancer drugs due to its inhibition by methotrexate. Its binding to methotrexate depends on its conformation, so it is very necessary that it should be present in its correctly folded form.
In the present manuscript, cellular folding of E. coli DihydrofolateReductase (DHFR), unfolding and refolding pathways, and structure activity relationship of the protein have been demonstrated with the help of experimental findings using biochemical and biophysical approaches.
2. MATERIALS AND METHODS
2.1. Reagents and Chemicals
The gene for E. coli DihydrofolateReductase (DHFR), cloned in the pET16b vector was obtained from Taguchi and UEDA group, The University of Tokyo, Japan. pET16b vector contains T7 promoter region and genes for ampicillin resistance, so specially engineered E. coli strain, BL21(DE3) was used for transformation of plasmid, expressing DHFR. BL21(DE3) cells contain the machinery for production of T7 RNA polymerase. Isopropyl β-D-1-thiogalactopyranoside (IPTG) was used as the inducer, as genes for T7 RNA polymerase were under lac promoter in BL21 DE3 strain. The ampicillin concentration used for optimum growth of the cells was 80 μg/ml. Isopropyl β-D-1-thiogalactopyranoside (IPTG), ampicillin, Luria broth media from Himedia (India), Dihydro folic acid, NaDH, Imidazole are from Sigma chemical company (USA), Hitrap chelating column from GE Health care (USA). All other reagents were of molecular Biology grade.
2.2. Over-Expression of DHFR
Competent E. coli BL21 DE3 cells were prepared according to the CaCl2 method given by Sambrook and Russell [3]. The cells were transformed with pET16b vector containing DHFR and spread on a LB agar plate containing ampicillin. The culture of the selected transformed E. coli colonies was grown at 37°C, with agitation at 200 rpm and induced with IPTG (final concentration 1 mM) at OD600 of 0.85. The cells were further incubated for 12-14 h for DHFR expression. About 200 μl of culture was centrifuged and the pellet was re-suspended in SDS loading dye [3,4], boiled at 100°C for five minutes and loaded on a 12 % SDS-PAGE for confirming DHFR expression.
BL21 (DE3) cells transformed with pDHFR plasmid were induced by 1 mM IPTG and different samples were collected after incubation of 3 hrs, 6 hrs, 9 hrs and 12hrs. The samples were denatured by boiling with SDS sample buffer and were run into SDS-PAGE and over-expression of the protein was judged from the band intensity in the gel.
2.3. In Vivo Folding of DHFR
Amount of folded protein in a cell can be estimated based on the principle that the proteins with correctly folded structure are soluble in the cytoplasm and in aqueous buffer, however, denatured proteins are insoluble and occur as aggregates [5]. Thus, to estimate the extent of correct folding of DHFR in vivo, culture broth of transformed strain expressing DHFR were harvested and resuspended in lysis buffer containing 20 mM sodium phosphate (pH 7.0), 500 mM NaCl. Normalization of the cell culture was done such that the same number of cells was taken for the analysis of each sample along with the control (un-induced cells). These cells were disrupted using ultrasonicator, followed by centrifugation at 10,000 rpm for 30 min. The supernatants and pellets were separated and were resuspended in the SDS loading dye, heated at 100°C for 5 minutes and analyzed by SDS-PAGE.
2.4. Purification of DHFR Using Immobilized Metal Ion Affinity Chromatography (IMAC)
Purification of DHFR was carried out by Immobilized Metal Ion Affinity Chromatography (IMAC) using chelating column charged with nickel ions as recombinant DHFR contained six Histidine residues on the N terminal. Plasmid pET16b containing DHFR gene was used for over-expression of DHFR. Cells were grown at 37°C and induced with 1 mM IPTG at OD600 = 0.90. After induction, further incubation was carried out at 37°C for 12 hr and the cells were harvested by centrifugation at 10,000 rpm for 30 min. Expression of DHFR was confirmed by analysis on 12% SDS-PAGE. Harvested cells were re-suspended in lysis buffer containing 20 mM sodium phosphate (pH 7.0), 500mM NaCl and 5 μl of DNAse I, PMSF (final concentration, 1 mM) and 5 μl of 0.01 M MgCl2 were added followed by incubation for 30 min on ice. The re-suspended cells were disrupted by 3 passes through French press at 13000 psi. Cell debris was removed by centrifugation in Beckman ultracentrifuge at 13,000 rpm for 40 min at 4°C. The supernatant was collected and filtered through a 0.22 micron filter. Nickel chelating column (Histrap, 5 ml, GE Health Care, USA) was cleaned and pre-treated according to the manufacturer’s instructions. The column was then equilibrated with buffer A1 (20 mM sodium phosphate (pH 7.0), 500 mM NaCl). The clear lysate was applied for chromatographic process by AKTA FPLC system (GE Health care, USA). Buffer A1 was passed through the system for three column volumes. Then the column was washed with 2% buffer B1 for two column volumes. Elution of DHFR was done by passing buffer B1 (500 mM imidazole in buffer A1). The fractions corresponding to the peaks for DHFR were analysed by SDS PAGE. These fractions were pooled and concentrated by Amicon centrifugation kit, 10 kDa cut-off membranes (Millipore). Concentrated DHFR solution was divided in aliquots, frozen in liquid nitrogen and stored at –80°C.
2.5. Protein Estimation Using Bradford’s Reagent
Protein was estimated by the Bradford’s dye binding method using bovine serum albumin as the standard protein. 500 μl of appropriately diluted protein was taken in a test tube. 4.5 ml of Bradford’s reagent was added to it. The mixture was incubated at room temperature for 10 min and the concentration of the protein was determined from the colour development, measured spectro-photometrically at 595 nm.
2.6. Enzymatic Activity Assay of DHFR
DHFR activity was determined by the fact that it catalyses the following reaction:
DHF + NADPH + H+ à THF + NADP+ [6]
where, DHF and THF are dihydrofolate and tetrahydrofolate, repectively. The decrease in NADPH was monitored by measuring its absorbance at 340 nm at 37oC. The reaction was initiated by DHFR. The standard assay mixture (1.0 ml) contained 3 M KCI in phosphate/Cit. (25 mM citrate, 25 mM phosphate titrated to pH 6 by KOH), 0.05 mM dihydrofolic acid and 0.08 mM NADPH. An enzyme unit is defined as the amount of enzyme that catalyzes the oxidation of 1 mol NADPH/min. This value was calculated from the changes with time in the optical absorption at 340 nm, using the value 12300 M-1cm-1 [7] as combined molar absorption coefficients for the oxidation of the NADPH and the subsequent reduction of the dihydrofolate.
2.7. Equilibrium Unfolding Studies by Intrinsic Tryptophan Fluorescence Spectroscopy
For equilibrium unfolding studies, intrinsic fluorescence measurements were performed using Perkin-Elmer LS 55 spectrofluorimeter using an optical cuvette of pathlength1cm. Samples were prepared by incubating DHFR (final conc. 1 µM) with different concentrations of GdnHCl (0-4 M) at 25ºC for 30 min in 10mM sodium cacodylate, 50 mM NaCl buffer, pH 7.4. The samples were excited at 295 nm and emission spectra were recorded between 310-500 nm with excitation and emission slit width 5 nm each. The quantity ‘relative fluorescence’ was calculated accordingly:
FR= (F– F0)/F0
where, F is the fluorescence intensity of the protein at various GdnHCl conc. F0 is the fluorescence intensity of the native protein. FR was plotted against GdnHCl concentration.
2.8. Equilibrium Unfolding Studies by Circular Dichroism
Far-UV CD spectra were recorded on JASCO J-810 CD polarimeter (JASCO, Japan), flashed with nitrogen gas, using an optical cuvette of pathlength 2 mm. Samples were prepared by incubating DHFR (final conc. 10 µM) with different concentrations of GdnHCl (0-4 M) at 25ºC for 30 min in 10 mM sodium cacodylate, 50 mM NaCl buffer, pH 7.4. Each spectrum was corrected for contributions from buffer solutions, containing increasing concentration of GdnHCl (0-4M). The emission spectra were recorded between 250- 205 nm for far-UV CD. The Molar Residue ellipticity (MRE) was calculated using the formula:
[θ]= (θobs in mdeg)/ (Molar conc. of the protein × path length in mm × Number of amino acids residue present in the protein) [8].
2.9. Equilibrium Unfolding Studies by Extrinsic Fluorophore ANS
Protein bound ANS spectra were recorded on luminescence spectrometer LS 55 (Perkeinelmer Life sciences, USA), using an optical cuvette of pathlength 1 cm. Samples were prepared by incubating DHFR (final conc. 1 µM) and ANS (final concentration 40 µM) with different concentrations of GdnHCl (0-4 M) at 25ºC for 30 min in 10 mM sodium cacodylate, 50 mM NaCl buffer, pH 7.4. Each spectrum was corrected for contributions from buffer solutions, containing increasing concentration of GdnHCl (0-4 M) and constant concentration of ANS (40 µM). The samples were excited at 370 nm and emission spectra were recorded in the wavelength range of 400-600 nm with excitation and emission slit width of 5 nm each.
2.10. Equilibrium Unfolding Studies by Enzymatic Assay
Activity of DHFR samples (final protein concentration 10 µM) containing different concentrations of GdnHCl (0-4 M) in 10 mM sodium cacodylate, 50 mM NaCl buffer, pH 7.4 was measured according to the method described in Subsection 2.6. The activity of the enzyme was then analyzed against the concentration of GdnCl.
2.11. Spontaneous Refolding Studies on DHFR by Intrinsic Tryptophan Fluorescence Spectroscopy
DHFR (40 μM) was unfolded with 3 M concentration of GdnHCl at 25°C for 1 hr. Denaturation was confirmed by the loss of enzymatic activity as well as change of conformational parameters. The denatured protein was diluted to different concentrations of GdnHCl (2 M, 1 M, 0.5 M, 0.25 M, 0.1 M and 0.01 M) with refolding buffer, 10 mM sodium Cacodylate, 50 mM NaCl, pH 7.4 and allowed to refold at 25°C for 2 hrs. Intrinsic fluorescence was measured for all the samples according to the method mentioned in Subsection 2.7.
2.12. Spontaneous Refolding Studies on DHFR by Enzymatic Assay
DHFR (40 μM) was unfolded with 3 M concentration of GdnHCl at 25°C for 1 hr. Denaturation was confirmed by the loss of enzymatic activity as well as change of conformational parameters. The denatured protein was diluted to different concentrations of GdnHCl (2 M, 1 M, 0.5 M, 0.25 M, 0.1 M and 0.01 M) with refolding buffer, 10 mM sodium Cacodylate, 50 mMNaCl, pH 7.4 and allowed to refold at 25°C for 2 hrs. Activity was checked for all the samples by performing assay for the enzyme according to the method described in Subsection 2.6.
3. RESULTS
3.1. Optimization of Time for Over-Expression of DHFR
BL21 DE3 E. coli cells were transformed with pET16b vector containing DHFR plasmid and induced with IPTG to its final concentration of 1mM and kept for incubation at 37°C. Maximum expression for DHFR was obtained after incubating the culture for 12 hrs (Figure 1).
3.2. In Vivo Folding of DHFR
When the induced cells were sonicated, centrifuged and pellet & supernatant were separated and analyzed on 12% SDS PAGE against un-induced cells and nontransformed cells, the result showed that DHFR was expressed only after induction and most of the protein was in the supernatant only (Figure 2). However pellet also contained some of the protein but the amount was very less as compared to the supernatant part.
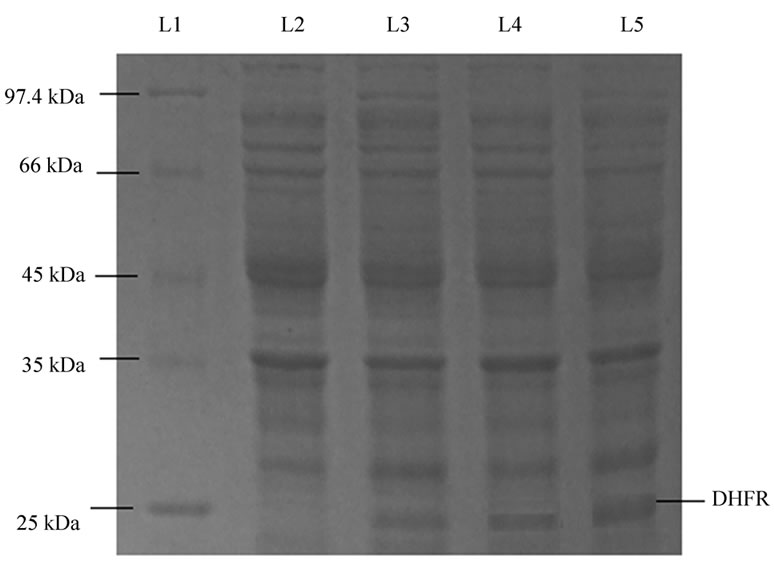
Figure 1. SDS-PAGE shows optimization of time for DHFR expression. Lane L1, marker; lane L2, sample after 3 hr incubation; lane L3 sample after 6 hr incubation; lane L4 sample after 9 hr incubation; lane L5 sample after 12 hr incubation.
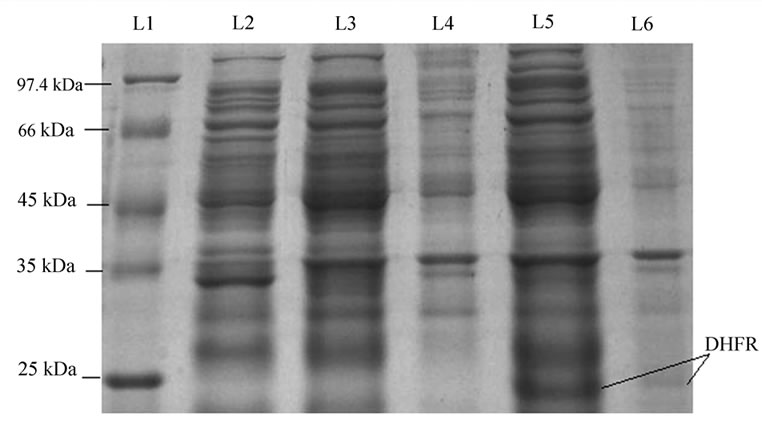
Figure 2. SDS-PAGE shows in-vivo folding of DHFR. Lane L1, marker; lane L2, non-transformed cells; lane L3, supernatant of control (un-induced sample); lane L4, pellet of control (un-induced sample); lane L5, supernatant of induced sample; lane L6, pellet of induced sample. The result shows that most of the protein is in folded form.
3.3. Purification of DHFR Using Immobilized Metal Ion Affinity Chromatography (IMAC)
The elution profile of immobilized metal affinity chromatography showed three distinct peaks (data not shown).The third peak appeared during the elution with higher concentration of imidazole, about 225 mM. Fractions corresponding to peak 3 was analysed through 12% SDS PAGE. Dense band at the position of 24 kDa corresponding to DHFR was observed, indicating the presence of DHFR in the solution. No other band in the gel indicated that the solution contained purified DHFR and no other proteins were present in that solution (Figure 3). Fractions corresponding to peak 3 were pooled together,
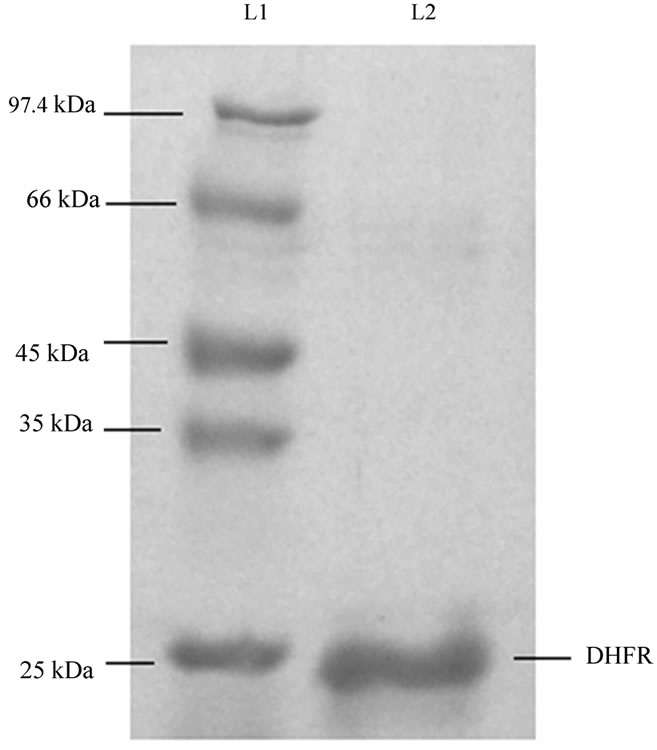
Figure 3. SDS-PAGE shows purified protein in the fraction collected during purification of DHFR corresponding to peak 3 in the chromatogram (not shown). Lane L1, marker; lane L2, fraction corresponding to peak 3 in the chromatogram.
concentrated and stored at 4°C for further in vitro studies.
The concentration of imidazole in the protein solution was reduced to as low as 0.8 mM by buffer exchange method using Amicon centrifugation kit, using 10 kDa molecular weight cut-off (Millipore) membranes. The concentration of the protein in the concentrated solution was determined through Bradford protein estimation method using BSA as a standard. Pure DHFR concentration was found to be 1 mg/ml (40 μM). Substantial activity of the purified protein was observed according to the protocol discussed in Subsection 2.6. This suggested that good amount of protein was present in its active conformation.
3.4. Equilibrium Unfolding and Refolding Studies on DHFR by Intrinsic Tryptophan Fluorescence Spectroscopy
The results obtained for GdnHCl induced conformational transitions of DHFR in 10mM Sodium Cacodylate, 50 mM NaCl, at pH 7.4 and 25°C, studied by intrinsic tryptophan fluorescence are shown in Figure 4 (shown by dots). It is quite evident from the Figure 4, that up to 0.75 M of GdnHCl concentration, emission intensity is almost constant. There is not much change in the intrinsic fluorescence. Thereafter, the emission intensity decreased gradually from 1 M to 2.5 M of GdnHCl concentration, from where it became flat. During the refolding studies of denatured DHFR by dilution method, monitored by intrinsic tryptophan fluorescence (shown in Figure 4 by triangles), it was clear that almost all of the protein had refolded by itself on removal of the denaturant. When the sample was diluted to final GdnHCl concentration of 0.01 M, the relative fluorescence intensity of the protein sample was measured to be 0.96. This showed that protein had refolded almost completely upon removal of GdnHCl.
3.5. Equilibrium Unfolding Studies Monitored By Circular Dichroism
Changes in secondary structure of DHFR, induced by GdnHCl (0-4 M) was monitored by far-UV CD spectroscopy. Figure 5 shows the unfolding transition curve for the series of GdnHCl concentration, measured by CD ellipticities at 222 nm, expressed by molar residual ellipticities (deg cm2 dmol-1). No appreciable change was observed in ellipticity until a concentration of 1 M GdnHCl. This suggests that there is not much loss of secondary structure up till this concentration of GdnHCl. Beyond 1M concentration of GdnHCl, there was gradual decrease in the ellipticity upto 3 M concentration and then it got flattened. This study showed that the protein got completely unfolded at about 3 M concentration of GdnHCl.
3.6. Equilibrium Unfolding and Refolding Studies Monitored by Enzymatic Assay
Unfolding and refolding of DHFR was studied by per-
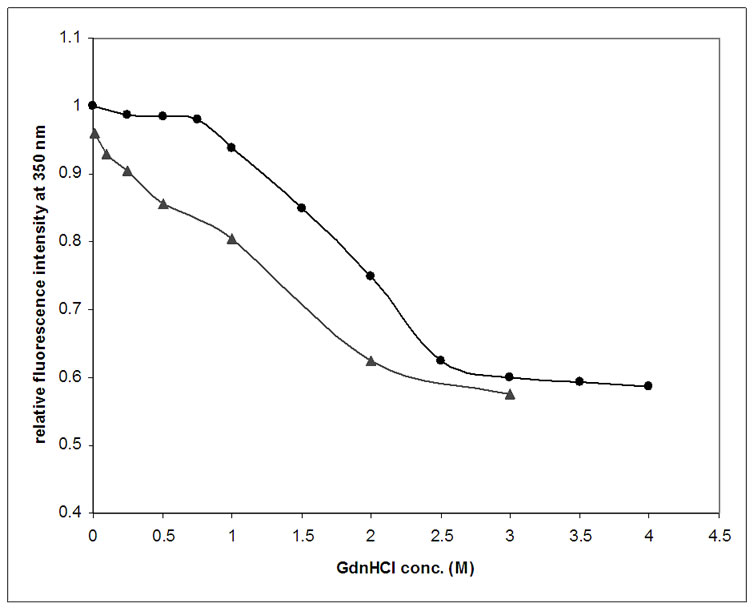
Figure 4. Intrinsic trytophan fluorescence: Effect of GdnHCl on equilibrium unfolding of DHFR. Change in tryptophan fluorescence at 350 nm for 1 μM of native protein (pH 7.4, 25°C) denatured by increasing concentration of GdnHCl (0-4 M). It is observed that the Relative fluorescence intensity value ( ) becomes nearly constant after 3 M of GdnHCl concentration. (
 ) shows spontaneous refolding of DHFR when the completely unfolded protein sample is diluted to different concentrations of GdnHCl (2-0.01 M).
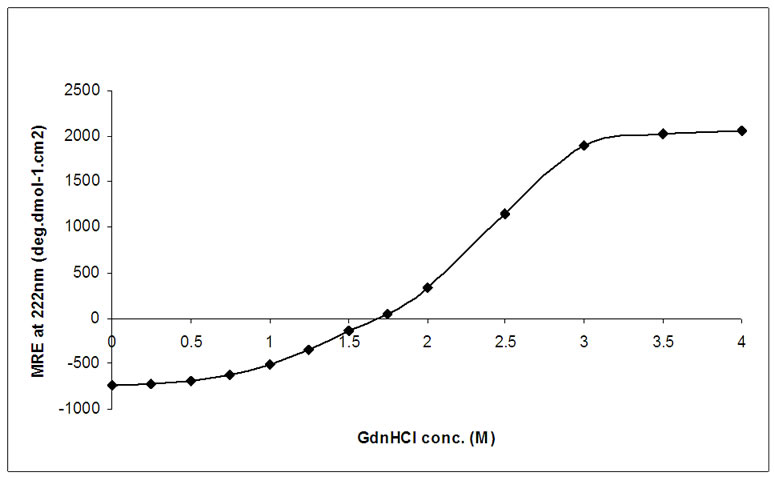
Figure 5. Equilibrium unfolding transition of DHFR monitored by Far-UV CD. Molar residue ellipticity at 222 nm, for 10 µM of native protein, denatured by increasing concentration of GdnHCl, is plotted against GdnHCl conc. (0-4 M). It is observed that MRE value becomes nearly constant after 3 M of GdnHCl concentration.
forming the functional assay for the denatured enzyme and the percentage activity of the denatured enzyme (calculated as compared to activity of native enzyme) was plotted against the GdnHCl concentration as shown in Figure 6. During the unfolding process (shown by filled squares in the figure), the activity of the enzyme was lost at 3 M of GdnHCl concentration. On diluting the sample to reduce GdnHCl concentration, the activity of the enzyme was regained. At 0.01 M GdnHCl, almost 95% of the enzymatic activity was regained (filled triangle). This showed that the enzyme had come to its active form after removal of denaturant, confirming its spontaneous refolding.
3.7. Equilibrium Unfolding Studies Monitored by Extrinsic Fluorescence Spectroscopy Using ANS as External Fluorescent Probe
Conformational changes in DHFR, induced by GdnHCl, have also been studied by binding of external fluorescence probe ANS, as shown in Figure 7. A steep increase in fluorescence intensity was observed between 0.1-0.3 M of GdnHCl concentration. Maximum fluorescence intensity was observed at 0.3M and it finally decreased to minimum at 3.5 M of GdnHCl, where free ANS molecules are quenched by water and other polar molecules. From our observation, it is quite clear that at 0.3 M of GdnHCl concentration the protein achieved such a conformation, where hydrophobic patches are exposed on the surface much more than native and denatured state. This signifies towards a formation of intermediate at this concentration of GdnHCl.
4. DISCUSSION
In the present study, the pET16b vector containing
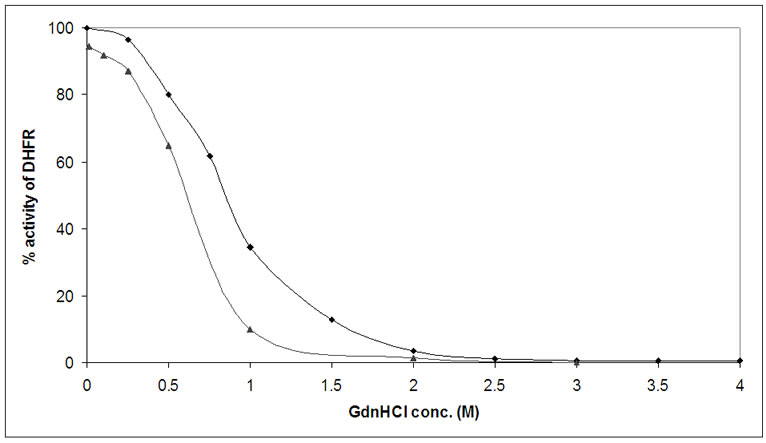
Figure 6. Equilibrium unfolding and refolding of DHFR monitored by change of enzyme activity. ( ) shows equilibrium unfolding and refolding of DHFR (protein conc. 1 µM) for increasing GdnHCl (0-4 M). It is clear that the enzyme loses its activity after 2.5 M of GdnHCl. (
 ) shows refolding of completely unfolded enzyme by diluting it to different concentrations of GdnHCl (0.01-2 M). It is clear that enzyme regains 95% of its activity on diluting GdnHCl to 0.01 M.
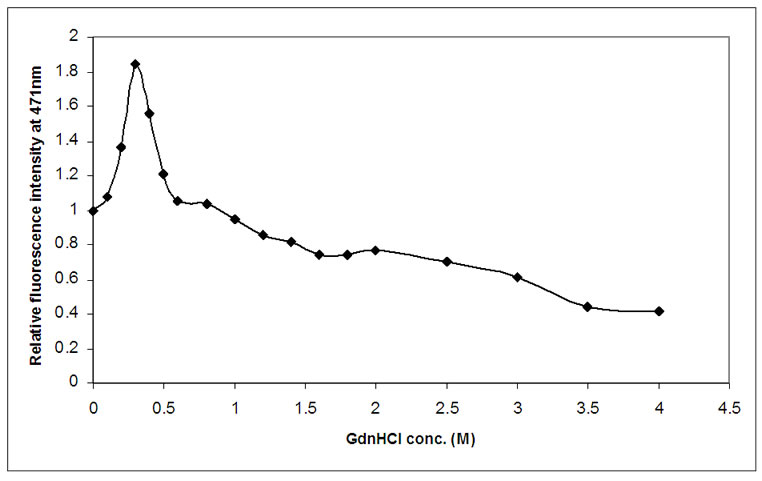
Figure 7. Effect of GdnHCl on extrinsic protein bound ANS fluorescence. Change in ANS fluorescence at 471 nm for 1 μm of native protein and 40μM of ANS, denatured by increasing concentration of GdnHCl (0-4 M). It is observed that the relative fluorescence intensity value becomes maximum at 0.3 M, signifying maximum hydrophobicity at this concentration of GdnHCl.
DHFR gene under control of T7 promoter, was used for over-expression of DHFR in E. coli strain that has machinery for T7 RNA polymerase under control of Lac promoter. The chemical induction of the Lac promoter was accomplished by the addition of the non-hydrolysable analogue of lactose, IPTG. While larger biomass content before induction is necessary for enhanced expression of the recombinant protein, the cells over-producing recombinant protein should also be sufficiently active at the time of induction. Thus, pre-induction cell concentration (OD600) plays a crucial role for over-expression of recombinant proteins. Expression of DHFR was obtained when induction was carried out in the mid-exponential phase. The protein was purified from soluble fraction of the over expressed protein, using IMAC Ni+2-chelating chromatography.
The spectroscopy based studies of the unfolding of DHFR with varying concentrations of denaturant gives a close insight into the change in secondary and tertiary structural elements upon denaturation. The equilibrium unfolding studies of E.coli DHFR showed that DHFR was completely unfolded above 3M concentration of GdnHCl. The refolding studies monitored by intrinsic tryptophan fluorescence spectroscopy and enzymatic assay of DHFR showed that almost all of the protein folded by itself, without any external assistance.
The tryptophan fluorescence emission intensity gives the clue about the changes in the tertiary structure of the protein. Figure 4 shows that there was not much change in intrinsic tryptophan fluorescence intensity of the protein up to 0.75 M concentration of GdnHCl. Beyond this concentration there is a sharp fall in intensity until it attains almost constant value and also the λmax shifts to higher wavelengths. This suggests a considerable loss in tertiary structure with increasing concentration of denaturant.
In far-UV CD spectrum also MRE values at 222 nm remain constant up to 0.5 M GdnHCl concentration, and then there is a sharp decrease in the value of ellipticity beyond this concentration of denaturant which continues up to about 3M after which it remains almost constant (Figure 5). This trend in the change of ellipticity of DHFR with gradually increasing concentration of denaturant suggests that complete denaturation of the protein took place at about 3 M GdnHCl concentration and the protein lost its secondary structural elements. Similar results were observed when the denaturation was monitored by assaying the enzymatic activity as well as through measuring ANS-bound extrinsic fluorescence intensity of the protein (Figures 6 & 7).
However, when the equilibrium unfolding process of DHFR was monitored by extrinsic fluorescence spectroscopy using ANS as the fluorescent probe, distinct intermediate species were observed. It was seen from Figure 7 that, with increasing denaturant concentration, protein bound ANS fluorescence increased rapidly up to 0.3 M GdnHCl concentration range, which signified the exposure of hydrophobic pockets of DHFR molecule that were otherwise buried inside the core of the native molecule. This phenomenon typically revealed the presence of stable intermediates during the equilibrium unfolding of DHFR. The possibility of salt induced conformational changes of DHFR was nullified by recording ANS-bound DHFR fluorescence emission in presence of gradually higher concentration of NaCl (data not shown). The characteristic features of the equilibrium unfolding intermediate were determined from farUV CD, intrinsic tryptophan fluorescence spectroscopy, and enzymatic assay. It was observed that the intermediate contains almost identical secondary structural elements, conformation around tryptophan residues were the same and having almost unchanged enzymatic activity. It may resemble a molten-globule like intermediate species in the unfolding pathway of E. coli DHFR.
5. CONCLUSIONS
In the present study we have reported that Gdn-HCl denatured E.coli DHFR refolded spontaneously after removal of the denaturant through dilution. Hence, the protein does not require any assistance from chaperones for its correct folding. DHFR forms equilibrium unfolding intermediates at around 0.3 M concentration of GdnHCl. The intermediates are having higher exposed surface hydrophobicity, although there were no substantial changes in secondary structural elements and enzymatic activity of the protein. It is worthwhile to study the role of chaperonin GroEL/GroES in accelerating or slowing down the rate of refolding. The reported information also paves the way for designing drugs against the non-native intermediates of DHFR molecules.
6. ACKNOWLEDGEMENTS
The authors acknowledge the financial assistance from Amity Institute of Biotechnology, Amity University, India, and Indian Institute of Technology Delhi, India. One of the authors, TKC, acknowledges the financial assistance from CSIR, Government of India.
REFERENCES
- Dobson, C.M. (2001) The structural basis of protein folding and its links with human disease. Philosophical Transactions of the Royal Society of London, Series B, Biological Sciences, 356(1406), 133-145.
- Aiso, K., Nozaki, T., Shimoda, M. and Kokue, E. (1999) Assay of dihydrofolate reductase activity by monitoring tetrahydrofolate using high-performance liquid chromatography with electrochemical detection. Analytical Biochemistry, 272(2), 143-148.
- Sambrook, J. and Russell, D. (2001) Molecular cloning: A laboratory manual. 3rd Edition, Cold Spring Harbor Laboratory Press, New York, A8, 1-55.
- Laemmli, U.K. (1970) Cleavage of structural proteins during the assembly of the head of bacteriophage T4. Nature, 227(5259), 680-685.
- Chaudhuri, T.K., Farr, G.W., Fenton, W.A., Rospert, S. and Horwich, A.L. (2001) GroEL/GroES-mediated folding of a protein too large to be encapsulated. Cell, 107(2), 235-246.
- Rao, K.N. and Venkatachalam, S.R. (2000) Inhibition of dihydrofolate reductase and cell growth activity by the phenanthroindolizidine alkaloids pergularinine and tylophorinidine: The in vitro cytotoxicity of these plant alkaloids and their potential as antimicrobial and anticancer agents. Toxicology in Vitro, 14(1), 53-59.
- Hillcoat, B.L., Nixon, P.F. and Blakley, R.L. (1967) Effect of substrate decomposition on the spectrophotometric assay of dihydrofolate reductase. Analytical Biochemistry, 21(2), 178-189.
- Yang, J.T., Wu, C.-S.C. and Martinez, H.M. (1986) Calculation of protein conformation from circular dichroism. Methods in Enzymology, 130, 208-269.