J. R. Cháves et al.
has poor neighborhoods that have origins in the industrialization era. Indeed, in the middle of the 20th century,
Costa Rica, like the others countries of Central America, entered into the era of industrialization after facing a
very critical per iod for the international sale of t he monoculture product coffee, who’s price was devalued since
the crises of 1929 and World War II. The two economic crises produced a large loss of wages within of coffee-
producing areas, mainly located in the Central Valley of Costa Rica. When Costa Rica started this process of
crop substitution and establishment of manu fact urin g ind ustr ies, the p op ulatio n be gan t o m igra te fr om t he co un -
tryside to the cities a nd it is in this conte xt t hat a numbe r o f sl ums and marg ina l urb a n ar e as i n the c a nt on s i n t he
central of the country such as Monte Carmelo. In addition to the arrival of many rural families in urban areas,
new manufacturing businesses were established in the country like in much of Central America as part of the
Central American Common Market which was created with the stated purpose of sending farmers to factory
jobs.
In 1960, the North-West border of Santo Domingo had a large and very poor neighborhood of native families
who had no homes and could not afford rent on homes therefore, built slums and lived without electricity and
drinking water along with other problems at that time. In this environment there was constant violence, drugs,
and abuses of all kinds. The image that was projected to the rest of the community was not very exemplary in
addition to the typecasting of these marginal groups.
In the early 1970’s the “Damas Israelitas (Israeli Ladies)”, a group of Israeli women residing in Costa Rica,
became concerned with the condition of these families and started very commendable work for the eradication
of this precarious neighborhood involving participation of community organizations and local government. Ex-
isting dwellings with some exceptions were rebuilt four decades ago so many of these families are able to have
better housi ng condit i ons, althoug h the problems of slums still persist.
Previous studies have provided evidence for the presence of vulnerabilities in Santo Domingo. Fernández et
al. [4] investigated the floods generated by overflows of the Rio Bermudez and reported that several communi-
ties of Santo Domingo were severely affected by floods in 1999 and 2010. In 2012, the study called “Determina-
tion of the ri sk of disaster in Santo Domingo de Heredia” began. Conducted between 2012 and 2014, this study
led to a comprehensive analysis of the vulnerability in the canton. Two important works related to the vulnera-
bility of the population of Santo Domingo came from this project. One of them is Reyes and Fernández [5] in
which they presented the results of an analysis of maximum human vulnerability in the canton and shown that
such vulnerability is greatest in the areas where the proximity of the threat and poverty are combined. Another
impo rtant wor k is t hat of Re ye s et al. [6] whic h con sist s of a co mpre hens ive stud y of t he r isk o f di saste r i nclud -
ing natural and anthropogenic threats as well as a comprehensive anal ysis of vul nerability. Twenty five indica-
tor s of vulne rabilit y were a nalyze d in thi s stud y and a map of vulne rability for the entire canton was prod uced.
That map shows that there is increased hazard vulnerability in the south and west areas of the canton.
3. Methology
For every Minimum Geostatistics Unit (MGU) of Santo Domingo (140 in total) we measured 2 indicators of
Physical Vul nerabilit y as sho wn in Ta ble 1 . Field studies and data from the 2000 Census [7] were used to create
a score of value between 0 and 1, with a higher value indicating greater vulnerability.
Once the index values were calculated, they were summed , re-indexed on a new scale of 0 to 1.00, assigned to
each of the UGM and imported to a system of geographic information (GIS) as a data layer. These values were
then stratified using the method of natural breakings and displayed on maps. A comprehensive vulnerabilit y in-
dex score was created on surface through the UGM to inhance the display.
4. Results
4.1. Human Settlements in High Risk Zones
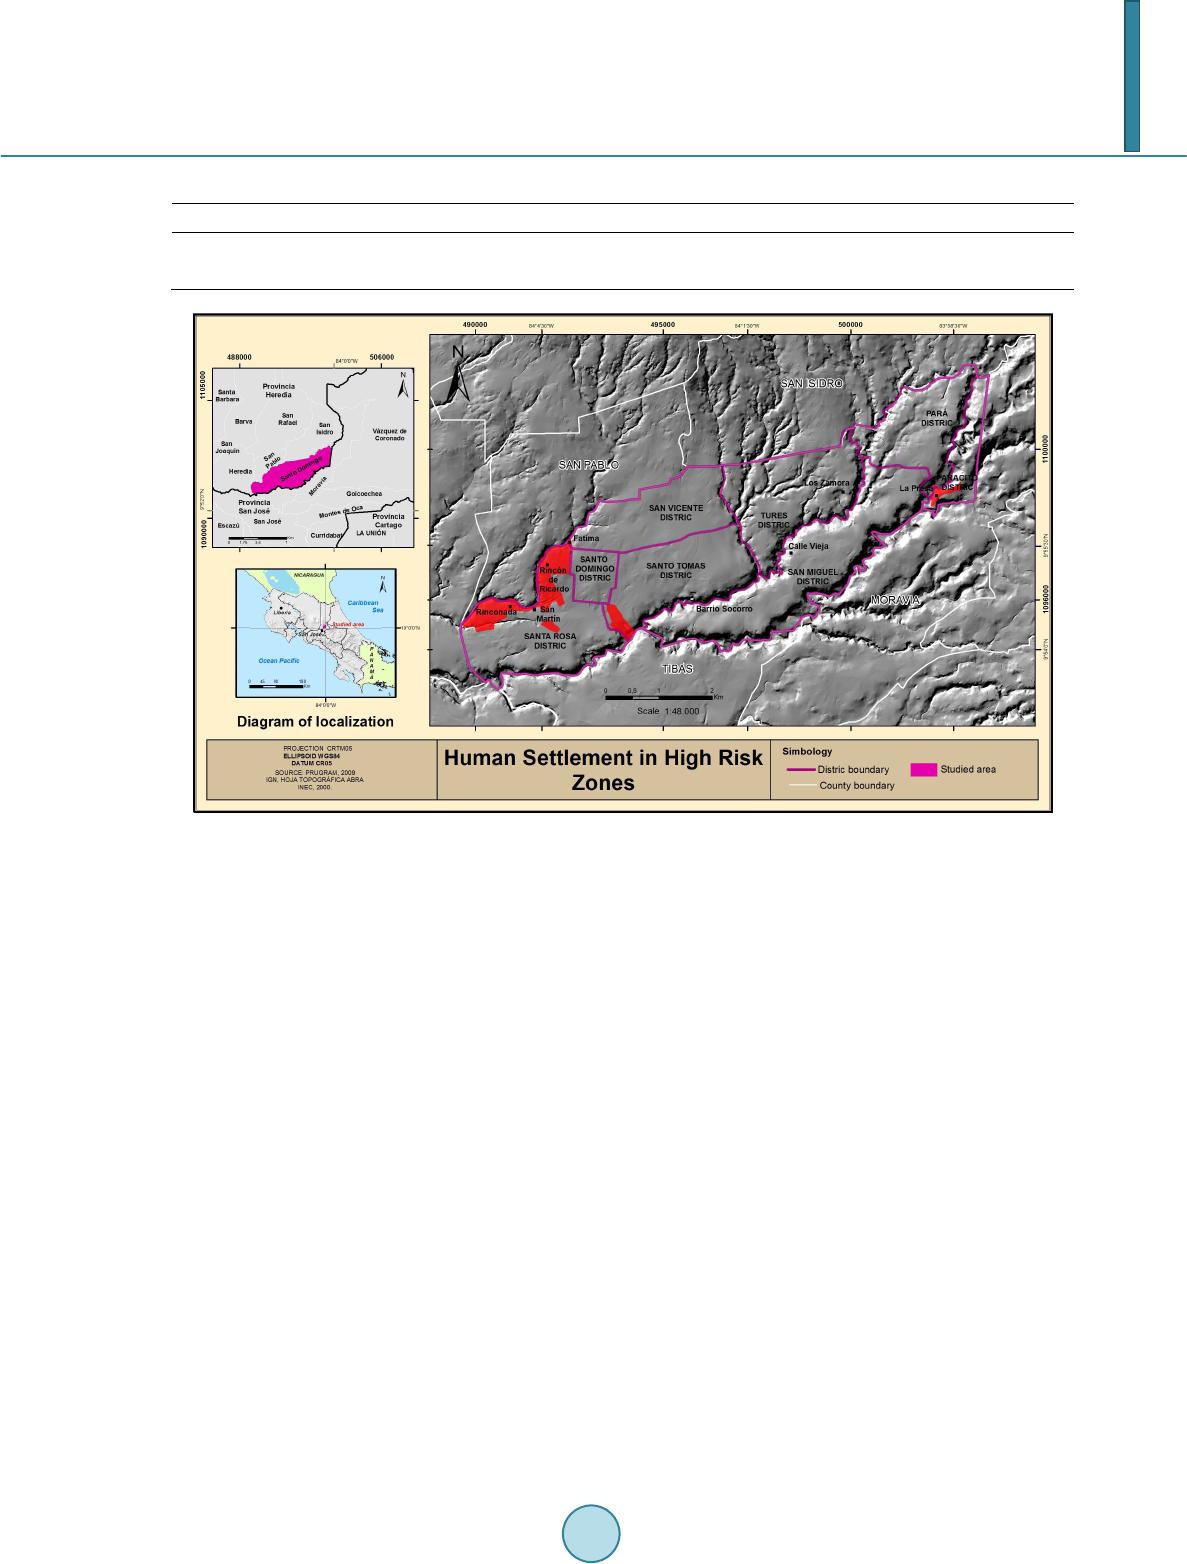
The distrib ution of human set tlements located in are as of risk in San to Domingo is sho wn in Figure 2. Critical
sites are the neighborhoods Fatima, La Rinconada, San Martín, RIncón de Ricardo, the extreme southwest of
Santo Tomás, and La Presa in the district Paracito.
Fatima and Monte Carmelo (next to Fátima) communities are located on the southern slope of the Río Ber-
múdez , wh ic h is the bo und ar y bet ween t he c anto ns San P abl o a nd Sa nto Do mi ngo. For man y year s t hese nei gh-
borhoods did not suffer flooding because the river flow was small but with the increase of the urbanization
process and the consequent increase of the waterproofing of soils, the once insignificant River now floods fre-