 World Journal of Engineering and Technology, 2014, 2, 14-19 Published Online September 2014 in SciRes. http://www.scirp.org/journal/wjet http://dx.doi.org/10.4236/wjet.2014.23B003 How to cite this paper: Wu, X.P., Deng, S., Du, X.H. and Ma, J. (2014) Green-Wave Traffic Theory Optimization and Analysis. World Journal of Engineering and Technology, 2, 14-19. http://dx.doi.org/10.4236/wjet.2014.23B003 Green-Wave Traffic Theory Optimization and Analysis Xiaoping Wu1, Shuai Deng1, Xiaohong Du2, Jing Ma1 1School of Civil Engineering & Mechanics, Huazhong University of Science and Technology, Wuhan, China 2China Huaxi Engineering Design & Construction CO., LTD Wuhan Branch, Wuhan, China Email: 652485344@qq.com Received May 2014 Abstract This paper analyzed the applicable conditions of the Gre e n-Wave traffic theory, used two-phase signal control concept to optimize the Green-Wave traffic theory, put forward specific program for cross intersections and T-intersections. The analysis concluded that the optimized Green-Wave traffic theory is favorable to improve road safety and reduce vehicle fuel consumption and reduce vehicle emissions and other aspects. Keywords Green-Wave Traffic, Two-Phase Signal Control, Road Safety, Energy Conservation and Emission Reduction, Intersection 1. Introduction With traffic mechanization, more and more problems are exposed in traditional road traffic design methods. According to the statistics, in 2013, a total of 667,507 road traffic accidents occurred in China, 494,174 people injured, the death toll reached 104,342. In terms of energy consumption, in the United States, the tra nsportation system consumed 60% of the total fuel, of which 73% were consumed by motor transport [1]; cur rently, tr ans- portation system energy consumption accounted for about 20% of China’s total ener gy consumption [2]. I n ad- dition, vehicle e xhaust emission of the road tr a nsport syste m is an important so ur ce of air p ollution. Green-Wave traffic is an overal l traffic control concept, the whole road’s intersections are coordinated and controlled by signal lights to ensure road safety and traffic efficiency. In this paper, two-phase traffic signal control is used to optimize the Green-Wave traffic theory, so as to provide better travel environment for pede- strians and vehicles. For safety, energy conservation and emission reduction, this paper compared road traffic signal design before and after optimization, and the results showed that the Green-Wa ve traffic optimized by two-phase signal con- trol concept is more conducive to road safety and energy-saving and emiss ion reduction. 2. Green-Wave Traffic Theory Optimization 2.1. Green-Wave Traffic “Green-Wa ve ” refers to signal multi-point control technique, namely, implement uniform signal lights control  X. P. Wu et al. within a traffic area or along a traf fic route, all signal lights withi n the con tro l range will be incorp orated into the computer contro l s yste m. Seeing from color of the signal l ights at each intersection alo ng t he controlle d ar terials, the green lights are rolling forward like waves, so it is vividly called “Green-Wave” [3]. The vast majority of vehicles that Green-Wave serves will e ncounter the green light when arriving at the intersections. 2.2. Green-Wave Traffic Applicable Conditions Reasonable implementation of the Green-Wave traffic will improve traffic efficiency, but in some cases, the re- sult may be counterproductive—reducing traffic efficiency, causing traffic hazards. The suitability of Green- Wave traffic generally needs to consider several governing factors [3]: 1) Vehicle arrival characteristics. Compared to the uniform traffic, the i mpulse -type traffic is more i ncli ned to form vehicle queue at intersections, which is more suitable for the implementation of the Green-Wave traffic. 2) Traffic organization. The simple r form of traffic organization is bette r, for example, one-way traffi c or gani- zation is more conducive to the i mplementation o f Green -Wave traffic. Meanwhile, the fewer tr affic flo w direc- tions or bigger d ifference in traffic flo w distributio n of each direction is more suitable for the i mplementatio n of the Green-Wave traffic. 3) Adjacent intersection spacing. Proper spacing between adjacent intersections is conducive to intersection signa ls coordination. In general, the larger distance between intersections, the worse line control effects. How- ever, spacing between intersections should not be too small, because small er intersection spacing is easier to form a u niform traffi c. 4) S ignal p hase setting condition. Signal phase has a great i mpact on the i mplementatio n of Green-Wave traf- fic. The fewer signal phase s, the better implementation of the Green-Wa ve tra ffic, and the greater bandwidth of Green-Wave b and. 2.3. Green -Wav e Traffic Theory Optimization According to the above analysis, implementation of the Green-Wave traffic needs to consider vehicle arrival characteristic s, traffic or ganizatio n conditio n, intersectio n sp aci ng, s ignal p hase se tting condition. As vehicle ar- rival characteristics belongs to tr a ffic flow study field, it will not b e discussed in this pa per. 1) Use two-phase signal control concept to improve traffic organization. Adopt two-pha se s ignal control, pro- hibit left turn at intersections (traffic volume is small), only straight traffic (main traffic direction) is re- mained, to reduce the traffic flow direction within the intersection, other traffics are achieved by bypassing and U-turn. Such simplified traffic organization mode is more suitable for the implementation of the Green-Wave traffic. 2) Use two-phase signal control concept to adjust the intersection spacing. In order to meet requirements of intersection spacing and its uniformity for Green-Wave traffic, the two-phase method takes sig na l s spacing as the main parameter, intersection spacing is adjusted from the point of signal settin g, i. e . , on the basis of current road intersections, set signal phase appropriately, combined with left turn forbidding, so that distance between each control si gnal is mai ntai ned at an ap pro priate level to facilita te t he imple mentatio n of the Green -Wave traf- fic. 3) Use two -phase signal control to simplify the signal phase. Only two phases are retained along the whole road, to simpli fy pha se set up. There is two-phrase decreasing of cross intersectio n, and one phase decreasing of T-intersection, which facilita tes the implementation o f the Green-Wave traffic. According to the previous analysis, specific organization solutions of T-intersection and cross t intersection are designed, as shown in Figure 1 and Figure 2. 2.4. Advantages and Disadvantages of the Prog ram 2.4.1. The Above Program Has the Following Advantages 1) People-oriented Traditional designs are often vehicle-or iented, and vehicle running is taken as a controlling factor in the de- sign of intersection, while ignoring the safety factor of pedestrian crossing, so the phenomenon of pedestrian runni ng ac ros s the str eet i s o ften seen, especially for the elderl y, children and other vulnerable groups, there is a serious safety hazard whi le wa lki ng across the street.  X. P. Wu et al. Figure 1 . Optimized Green-Wave traffic phase diagram (T-type inters ection ). Figure 2. Optimized Green-Wave traffic p hase diagr am (cross intersection). Optimized Green-Wave traffic theory is people-oriented, taking p edestrian and vehicles into equal considera- tion. As shown i n Figure 3, p e d est ri an c ro ss i ng a nd ve hic les U -turn are achieved in the same p ha se, a nd enough distance is set between crosswalk and track of vehicle U-turn. By the dislocation setting of crosswalk and setting t wo-step crossing safety i sland, and expanding stand sto ne space (road side) to shorten the crossing time of pe- destrians, the optimized system is safer. 2) Safer for car The intersection is a traffic hazard place and accident-prone location. View from macro perspective, around the world, about 30% to 50% of road traffic accidents occur at intersections [4]. From the microscopic point of view, the proportion of accidents happened in each flow direction at intersections is diffe rent. As sho wn in Fig- ure 4, taking T-intersection for example, according to statistical data collected by the US Federal High way Ad- ministratio n in 2006 , within t he T -intersections, the number of accidents happened at six traffic flo ws directions is very different, of whic h, the accident rate of two straight traffic flows on the main road is small, and for the remaining four flows, left turn at the main road is of the largest traffic accident rate, accounting for 47%, fol- lo wed b y left tur n on the se condar y road, accounting for 27%. Rig ht turn o n the main r oad a nd second ary ro ad accounted for 16% and 10% respectively. Therefore, probability proportion of car accident of left turn, right turn and st raight vehicle in the T-intersec tions can be concluded: left turn > right turn > straight. In optimized Green-Wave traffic theory, according to probability difference of accidents occurred in d iffe rent steering be ha viors, t wo-p hase signal co ntrol the ory is used for intersection phase further op timization. T urn left at the secondary road is not a chieved at the current intersection, but transferred to the road or adjacent intersec- tion, achieved through a dedicated U-turn signal pha se, at the same time providing sufficient turning radius for vehicles U-turn, in theory, can eliminate accidents of U-turn. Thus, only remain the straight flow and U-turn phase along the whole road. According to the steering accident probability data, ve hi c l es’ left turn behavi or is very unfavorable for road safety. In the optimized Green-Wave traffic theory, to meet the needs of vehicle left turn by means of “go straight first and then make U-turn”, ha s largely improved road safety. 2.4.2. Program “Defects” This program forces left-turning vehicles to make detour, which see ms to increase fuel consumption and emis- 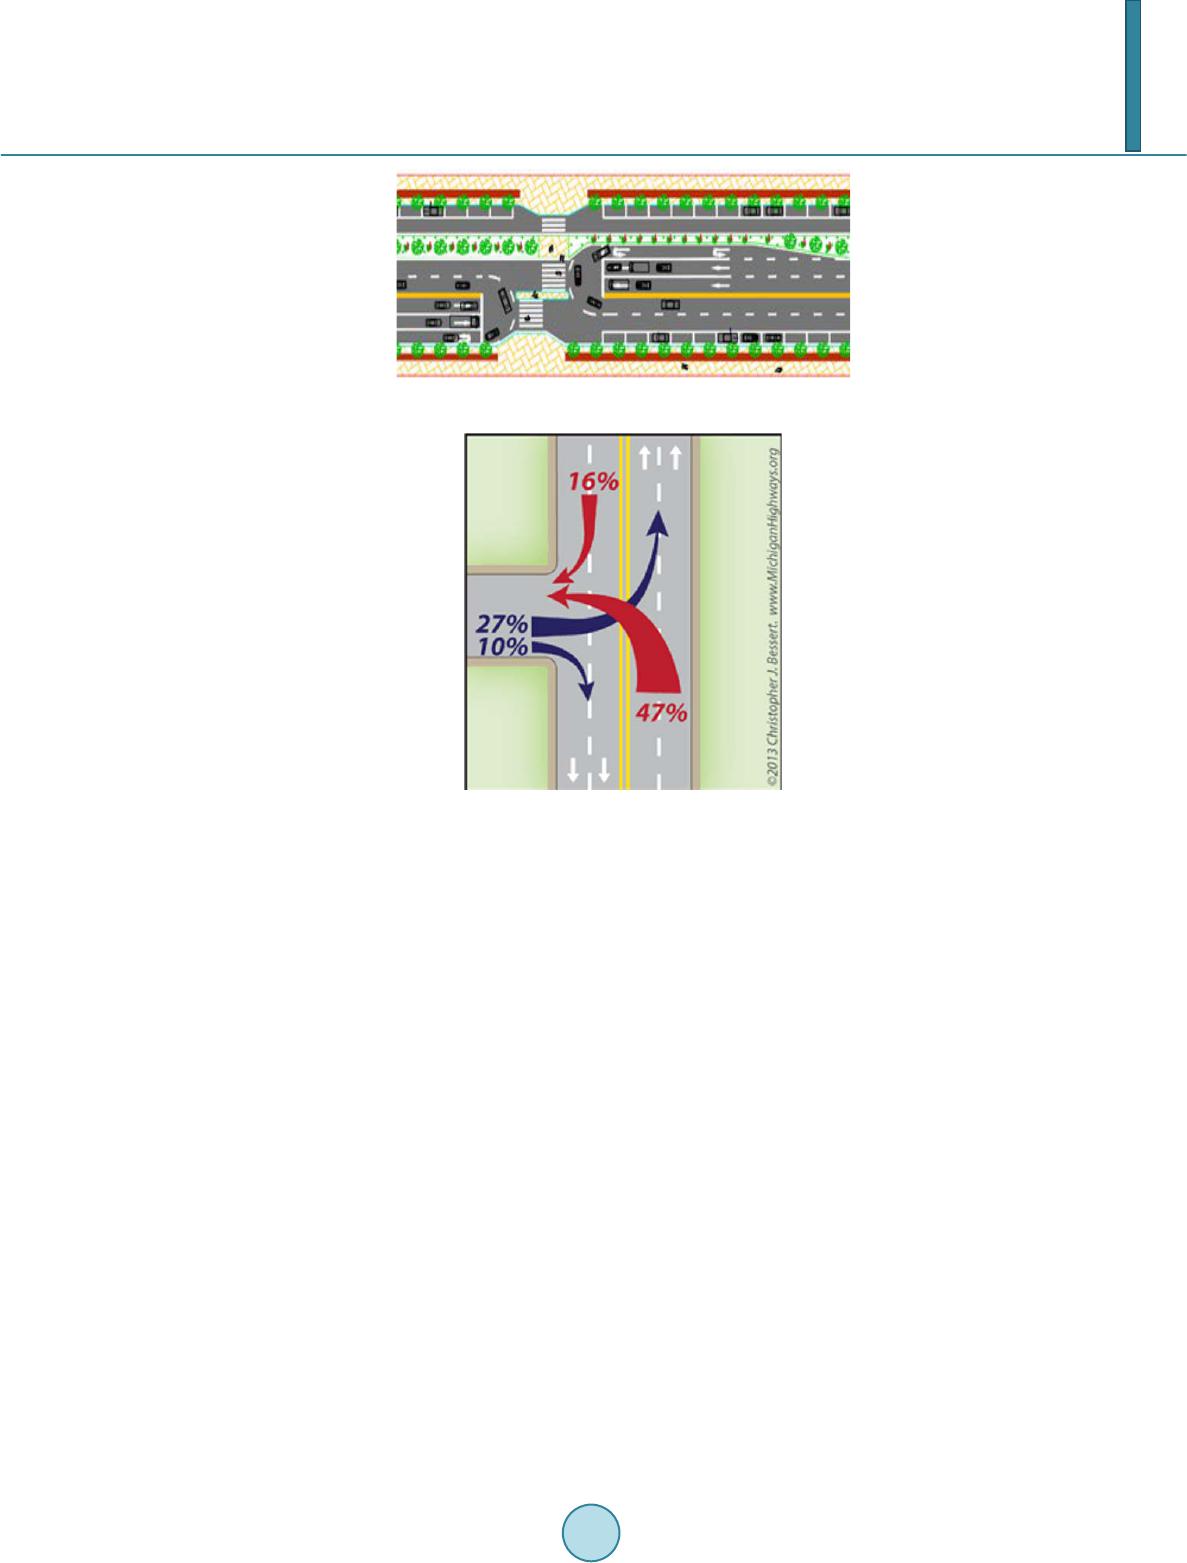 X. P. Wu et al. Figure 3 . Pedestrian crossing diagram. Figure 4. T-type intersection accidents dis- tribution. sions of left-turning vehicles, thu s i ncreasi ng t he operating cost of the entire transport system. 3. Traffic Transportation Efficiency Analysis For the concept of traffic transportation efficiency, Cai Jun [5] de fines it as the effective transport tasks com- pleted in per unit area of road, within a certain range of time-consuming. I n a broad sense, it can be interpreted as effective transpo rt tasks completed at the cost of the actual unit cost, time, energy consumption and economic depletion and damag e to t he enviro nment, etc. is collectively defined as the cost. Since the implementation of the Green-Wave tra ffic will force part of vehicles to detour, it will increase fuel consu mptio n and e xhaust emissio ns, r educe efficie ncy superficially, b ut in fact , the use of the optimized Green- Wave tra ffic theory is cond ucive to transportation ene rgy saving a nd emission reduc tion. 3.1. Vehicle Fuel Consumption Analysis Vehicle fuel consumption is one of the most typical tra nsportation co sts. Reduci ng ve hicl e fuel cons ump tio n, on the one hand, can save individuals’ travel costs; from macro perspective, it is also beneficial for worldwide energy conservation. Factors affecting motor ve hicles fuel consumption, include a ge, mileage, e mission s contro l technology, driving conditions, outside temperature and altitude, etc. [6]. Fuel consumpti on analysi s in this pa- per mainly targets for the following two questions: 1) relationship between vehicle fuel consumption and its driving state; 2) relationship between vehicle fuel consumption and its speed. Based on these questions, collect data on the Internet and organize them into Table 1, the unit is constant fuel consumption per hundred kilome- ters. Table 2 is obtained after treatment of Table 1 , the unit is fuel consumption per hour. For Questions 1: after analysis of data in Table 2, it shows that the fuel consumption in the idling state may be much higher than that of the constant speed state, for example, Civic series cars, in fact, idling fuel consump-  X. P. Wu et al. Table 1. Several cars’ idlin g fuel consumption and constant speed fuel consumption (collect from the Internet). Car idling fuel consum pt ion (L/ h) constant speed fuel consumption (L/100km) at corresponding speed (km/h ) 40 50 60 70 80 90 100 110 120 Civic 4.35 5.31 4.73 4.41 4.53 4.84 5.21 5.87 6.42 7.15 Sagitar 2.72 6.07 5.47 5.88 5.71 6.37 6.93 7.78 8.42 9.12 Camry 3.0 5.65 5.8 5.89 6.03 5.57 6.15 6.14 6.97 7.69 Table 2. Several cars’ idling fuel consumption and constant speed fuel consumption (L/h). Car idling fuel consum pt ion (L/ h) constant speed fuel consumption (L/100km) at corresponding speed (km/h ) 40 50 60 70 80 90 100 110 120 Civic 4.35 2.12 2.37 2.65 3.17 3.87 4.69 5.87 7.06 8.58 Sagitar 2.72 2.43 2.74 3.53 4.00 5.10 6.24 7.78 9.26 10.94 Camry 3 2.26 2.32 2.36 2.41 2.23 2.46 2.46 2.79 3.08 tion is measured at 4.35 L/h, a nd when it whe n driving at 40 km/h co nsta nt speed , the fuel consumption is only 2.12 L/h, less than half of the id ling fuel consumpt ion. For Questions 2: JIA Hong-fei et al. [7] study found, a fuel-speed model is built for the highway fuel con- sumption, this article will apply it to urban ro a d. In this model, the car’s fuel consumption is a quadratic function of speed, namely: (1) where: F is the b a sic a utomotive f uel L/100km; v is vehicle speed, km/h; a, b, c are regression coefficients. According to the above expression, when running at a certain constant speed, the basic fuel consumption is at minimum, then the speed is t h e vehicle’s eco no mic ru nning speed, in fact, from the ener g y point of view, it may be referred to as energy-savin g speed. According to analyzes obtained from Table 1, different vehicle models have different economic speed, keep the speed at the vicinity of the economic speed, is advantageous to reduce fuel consumption. 3.2. Vehicle Emission Analysis Vehicle exhaust emissions analysis usually takes CO, HC, NOx as the main indicator. Different vehicles have different exha ust emissions, and there are also emission differences in the same vehicle unde r differe nt driving conditions. Veh icle running situations are actually a combination o f different prop ortions of idling, accelera tion, deceleration and constant speed state. Ma Dong et al. [8] conducted experiment and got relevant conclusion: When the car traveling at a low speed, emission factors are generally high, when the average speed increases, factors will decline. When idling and deceleration driving conditions are of high proportions, emission factors are relatively high; whe n co nsta nt spe ed d riving conditio n is of higher proportion the emission factor is relative- ly low. 3.3. Significance of Optimized Green-Wave Traffic Theory for Energy Conservation and Emission Reduction Encountering the red traffic light, vehicles will slow down and stop before the stop line, and then remain idle waiting for the green signal, finally accelerate to leave the intersection after the traffic light turns green, the whole process involves vehicle states of acceleration, idling, deceleration. According to the above analysis, in such drivi ng co nditio ns, constant speed state is of small pro portion, which i s not co nduc ive to energ y conse rva- tion and emission reduction. In order to avoid the above situation, UPS (United Parcel Service) prohibitsits transport vehicle t urnin g left at intersection s, a nd de to ur ing to achieve the purpose of left turn, then the company saved a tota l of ten millio n gal lo ns of gasoli ne fro m 2004 to 2009, reduced one hu nd re d tho usand t o ns of carbon emissions, equivalent to emissions of 5300 cars a year. The practical results of UPS coincide with optimized Green-Wave traffic theory. At traditional three-phase  X. P. Wu et al. T-intersection s with signals, the p robab ility of vehicle stop is 2/3, according to the theor y of probability and sta - tistics, abo ut 2/3 o f al l vehicle s pa ssing thro ugh t hi s i nte r sectio n will sto p dr ivin g, which will reduce the propor- tion of constant speed state. While in t wo-pha se signal c ontrol theory, intersections along the whole section are provided with o nly two p hases, reduce the probability of vehicle s top to 1/2, while green light ratio will be im- proved, reducing the probability of stopping, thereby proportion of vehicles a t co nsta nt sp eed dr iving co nditi o ns under two -phase signal co ntr olling increases, so a s to ac hieve t he pur p os e o f ene rg y savi ng and e miss io n r e duc - tion. Therefore, the optimized Green-Wave traffic theory is effective. 4. Conclusion After analysis and demonstration, compared to the traditional signal phase design, the Green-Wave traffic theory optimized by two-phase signal control is more rational design, and more favorable for reducing vehicle operat- ing f uel consumpti on, reducing emissions, and improving the safety of all road intersections. References [1] Zhang, W.H., Wan g, W. and Hu, G. (2003) Low Transport Energy Consumption-Based Urban Develo pment Strateg y. Highway and Transportation Research, 2, 80-84. [2] Wang, W., et al. (20 03) Urban Transport System Energy Consumption and Environmental Impact Analysis Method. Science Press, Beijing, 70-74. [3] Xu, B.Y. (2012) Applicability Study of Urban Main Road Green Wave Band Control. Nanjing Forestry University. [4] Pan, F.Q., Zhang, L.X., Lu, J. and Wa ng, F.Y. (2013) Computation Module of Vehicle Conflict Points at No Signal- Controlled Intersections. Journal of Shanghai Jiao Tong University, 2. [5] Cai, J. (2013) Urban Road Network System Planning. Chinese Building Industry Press. [6] Wang, N.N. (2012) Urban Road Driving Conditions Building and Fuel Consumption Research. Hefei University of Technology. [7] Jia, H.F., Juan , Z.-C., Zhang, X.X., and Nian, A.N. (2004) Highway Fuel Consumption Evaluation Indicators Identifi- cation and Comparison. [8] Ma, D., Zhao, Y. and Liang, B. (2010) Study of Lightweight Vehicle Emission Characteristics under Different Driving Conditions. Beijing Automotive, 4.
|