Journal of Power and Energy Engineering, 2014, 2, 176-181
Published Online September 2014 in SciRes. http://www.scirp.org/journal/jpee
http://dx.doi.org/10.4236/jpee.2014.29025
How to cite this paper: Xia, C.J., Lan, H.W., Men, K. and Liang, G.K. (2014) Research on the Transient Power Characteristics
of the Inverter for Yun-Guang UHVDC. Journal of Power and Energy Engineering, 2, 176-181.
http://dx.doi.org/10.4236/jpee.2014.29025
Research on the Transient Power
Characteristics of the Inverter for
Yun-Guang UHVDC
Cheng jun Xi a1, Haiwen Lan1, Kun Men2, Guokai Li an g1
1School of Electric Power, South China University of Technology, Guangzhou, China
2Electric Power Research Institute of CSG, China Southern Power Grid, Guangzhou, China
Email: 1037424860@qq.com
Received June 2014
Abstract
During the transient period of large-disturbance of the received power grid, the power f ea ture s of
the inverter are of great important for the security and stability of the system. The research before
is defective in that the constant control mode assumption and the rough HVDC simulation model.
The paper establishes the PSCAD/EMTDC model for Yun-Guang EHVDC system, and analysis the
transient real power and the reactive power of the inverter. With the analysis of logic for control
mode, the author also introduces the physical processes of the peak of the reactive power. At last,
the paper puts forward several strategies for suppressing the peak of the dynamic reactive power
and real power recovery acceleration.
Keywords
UHVDC, Inve rter, Transient Power Fe atur e s
1. Introduction
HVDC has huge transmission capacity and is a typical controlled system. HVDC is very sensitive to the fault of
the inverter-side AC system. During the transient period of fault and recovery of the received power grid, the
volta ge disturbance of the inverter station may cause commutation failure in HVDC and lead to dynamic
changes of reactive power and active power, while the power features of the inverter is of great important both
for the rotor angle stability and voltage stabilit y of the received system [1]-[4]. It’s an economic strategy to op-
timize HVDC control system to accelerate the recovery of the dynamic real power, suppress the dynamic reac-
tive power demand and even provide emergency power support [5] [6]. However, the existed studies on power
characteristic of inverte r are rare and have some shortcomings: firstly, the simulation models of inverter and
HVDC control system adopted are not precise enough and most of the researches are done based on the ele c-
tro mec ha nic al transient process; secondly, the analyses involving the exchange of inverter power are based on
the constant control mode assumption. In fact, the lar ge -dis turb a nce will cause the drop of commutation voltage
and may lead to a commutation failure in the inverter. The control mode switches to limit the DC current and
C. J. Xia et al.
177
may recover the commutation during the fault, maintaining a certain power transmission. As the fault is cleared,
the AC voltage recovers, the irrational control system parameters may result in high dynamic reactive power
demand and even lead to a subsequent commutation failure. During the transient period, the power features of
the inverter, especially the dynamic reactive power feature is very complicated and must be studied combining
with the analysis of its control dynamic behaviours.
This passage will firstly build the PSCAD/EMTDC model of Yun-Guang HVDC to anal ys e the power feature
of the inverter during the transient period of fault and recovery and discuss its impact on the rotor angle stability
and voltage stability of the received s yste m. Lastly, this passage will set forth the physical process related to the
peak of dynamic reactive power of the inverter combining with the switch logic of DC control mode and put
forward several strategies for suppressing the peak of the dynamic reactive power and real power recovery ac-
celeration.
2. Simulation Study
Firstly, we build the detailed model of Yun-Guang HVDC by means of PSCAD/EMTDC, whose main circuit
parameters and control/protect models are consistent with the practical engineering. As we focus on the external
characteristic of the converter, the AC system is represented as a Thevenin equivalent source (As it takes a long
time for AC network regulating device to response, this power model is precise enough for the study on the
transient process within 500 ms [7]). The simulation model is shown in Figure 1.
In order to make the simulation results more practical, the raw data is obtained from China Southern Power
Grid under large power flow in some year, while Yun-G uang HVDC operates in bipolar mode with 5000 MW
rated power and 2914MVar reactive power consumptio n of inverter in steady-state. The AC parameters can be
achieved through multi-port Thevenin equivalent of sending and receiving end. The ESCRs of rectifier and in-
verter are calculated as 5.6 and 8.9 respectively, which indicates that the receiving system is strong enough to
meet the reactive power demand of inverter during the transient dynamic process.
The simulation was taken in the DC system shown in Figure 1. A three-phase short circuit which lasted for
100 ms was set on the commutation bus of inverter. The different electrical distances between fault and commu-
tation station were simulated by changing the ground impedance to obtain voltage drops in diffe r e n t degrees
during the fault.
For the lack of space, only the Q-P transient feature will be explained here. In Figures 2(a) -(f), the horizontal
axis represents the real power P transmitted by inverter, while the vertical axis represents the reactive power Q
consumed by the inverter. P and Q are per-unit value (the rated power 500 MW is the base value). The key
turning points, their coordinates and also the moment when the working point arrives at them are marked in the
figures above. Supposing that the system is working at point O when the fault occurs (0 ms), during the transient
period, it moves from O to A to B to C… and finally back to point O (real power has been recovered com-
pletely). Some conclusions are found through the figures above:
1) When the commutation failure doesnt occur, the fluctuation of the inverter power is small and the real
power recovers fast (270 ms). Under critical condition(commutation failure doesnt occur exactly), the maxi-
mum real power loss is 0.1 p.u., while the peak reactive power demand which always appears during the fault is
0.08 p.u. more than the demand in steady-state.
2) When the commutation bus voltage drops to the range of 0.85 to 0.29 p.u. due to the disturbance of AC
system, the power of inverter exhibits similar feature:
a) The feature of real power: (the fault occurs) the real power decreases quickly at first but decreases slowly
later → the real power decreases to 0.4 p.u., the oscillation occurs and may cause reverse transfer power (de-
pending on the severit y of the voltage drop) the real power stabilizes to a low value at 85 ms - 90 ms (de-
pending on the severit y of the voltage drop) (the fault is cleared) the real power increases quickly at first but
increases slowly later, recovering overdampedly to the power value before the fault.
F
C
F
C
Figure 1. Diagram of the simulation model.
C. J. Xia et al.
178
O0.95, 0.58
0MS & 270MS
A
(0.94, 0.55)
5MS
B0.93 0.66
26MS
C0.85 0.53
85MS
D(0.88 0.54)
115MS
(0.86 0.58)
130MS
E
O0.95, 0.58
0MS & 430MS
A0.98 0.66
11MS
C0.39 0.90
50MS
E0.74 0.78
210MS
B(0.57 0.39)
22MS
D(0.11 0.28)
85MS
(a) (b)
O0.95, 0.58
0MS & 420MS
A0.46 0.29
12MS
B0.26 0.55
18MS
C0.1 0.62
39MS
D
-0.04 0.51
46MS
E0.01 0.05
89MS
F0.73 0.79
185MS
O0.95, 0.58
0MS & 415MS
A0.46 0.25
13MS
B0.25 0.42
20MS
0.09 0.42
29MS
C
D
-0.02 0.30
47MS
E0.02 0.04
85MS
F0.73 0.77
190MS
(c) (d)
(e) (f)
Fig ure 2. P-Q transient feature of inverter under different AC voltage drops. (a) Commutation bus voltage dropped to 0.91
p.u during the fault (commutation failure doesnt occur exactly); (b) Commutation bus voltage dropped to 0.85 p .u. during
the fault (commutation failure occurs); (c) Commutation bus voltage dropped to 0.65 p.u . during the fault (commutation fail-
ure occurs); (d) Commutation bus voltage dropped to 0.48 p.u. during the fault (commutation failure occurs); (e) Commut a-
tion bus voltage dropped to 0.29 p.u. during the fault (commutation failure occurs); (f) A metallic short circuit occu rred on
the commutation bus (commutation failure).
b) The feature of reactive power: (the fault occurs) the reactive power decreases to the minimum value the
reactive power increases to the maximum value and may cause oscillation but the reactive power will never be
transmitted reversely the reactive power stabilizes to a low value (the fault is cleared) when the real power
recovers to about 0.74 p.u., the reactive power reaches to the peak value, and then decreases to the value before
C. J. Xia et al.
179
the fault.
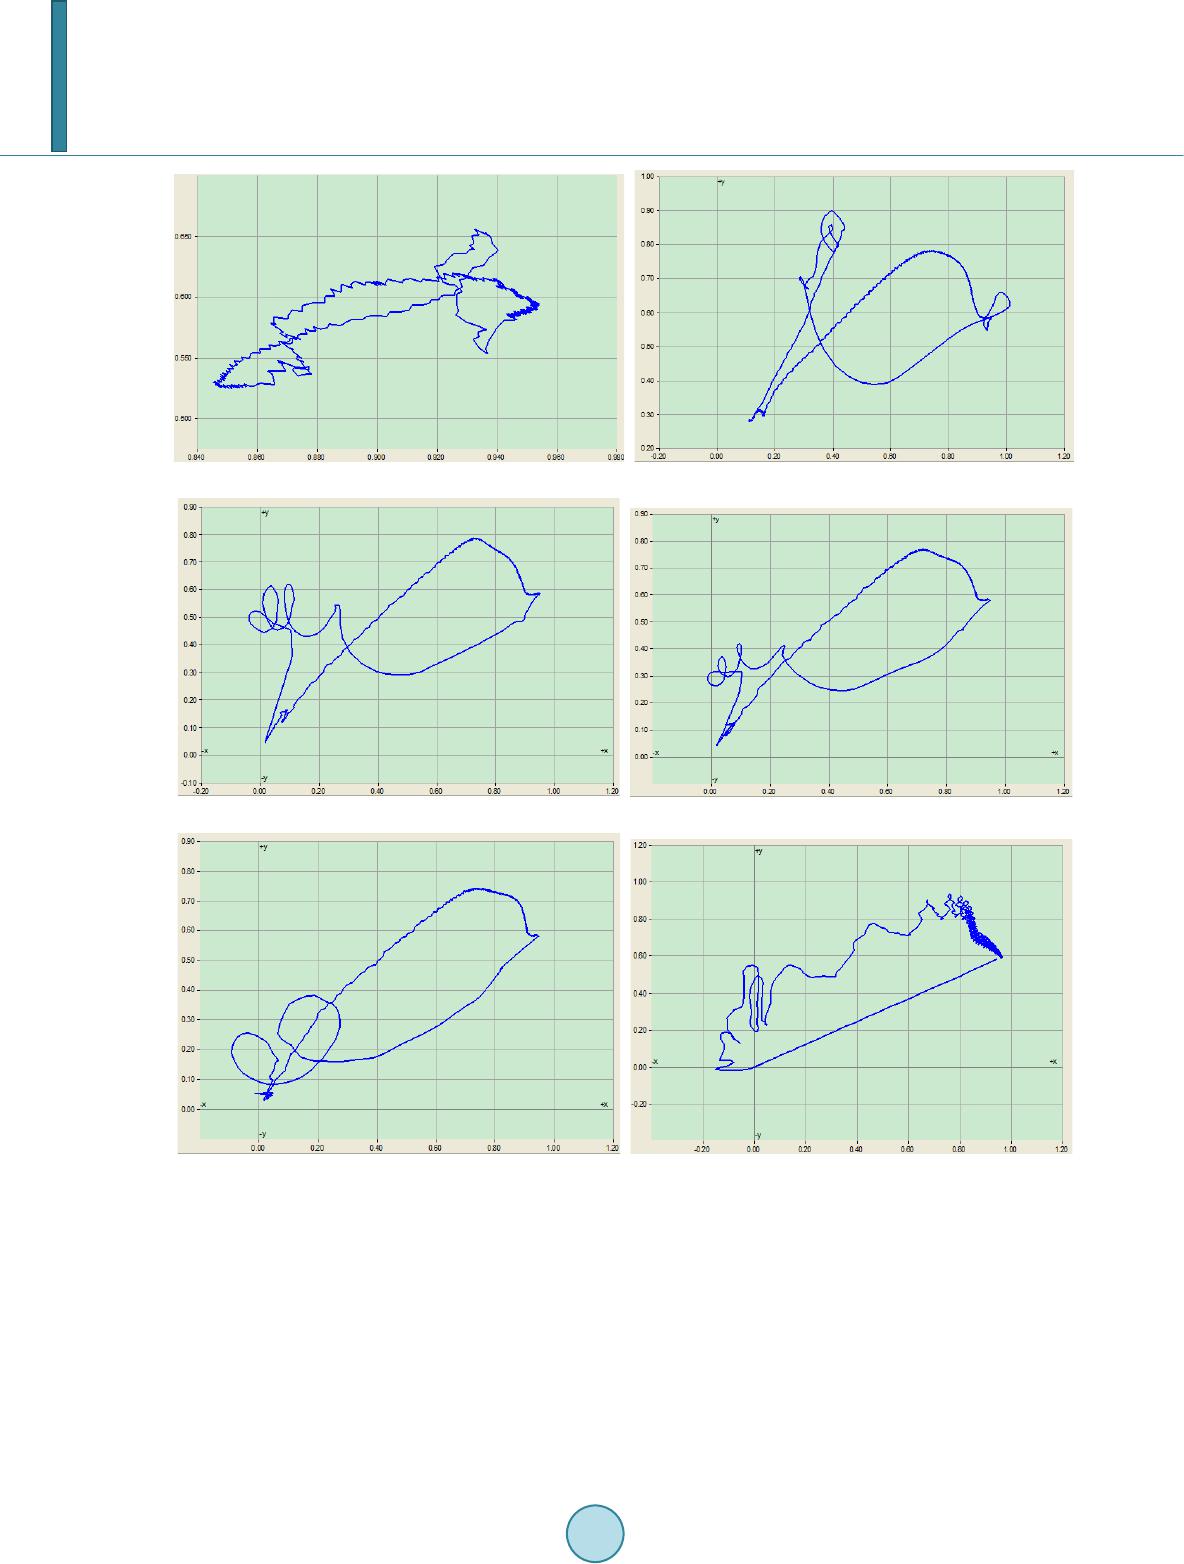
c) The relationship between real power and reactive power: the real power and the reactive power have stabi-
lized to a small range within 90 ms since the fault o ccurred and the power factor is relatively low. In the later
recovery stage, reactive power becomes an important factor which restrict s the recovery of real power. It can be
confirmed by this p he no me no n: as the reactive power nearly reaches to the peak value, the real power decreases
quickly.
3) When a three-phase metallic short circuit occurs on the commutation bus, P and Q will drop to zero and
never cause oscillation. When the fault is cleared, great real power may be transferred reversely and the reactive
power increases with oscillation. As the commutation recover, the real power increases continuously, while the
reactive power still oscillates. When the real power recovers to about 0.74 p.u., the reactive power reaches to the
peak value of 0.94 p.u. and the restoration of DC power will be significantly decelerated.
In order to make the DC system have better operating performance, its hoped that the real power of HVDC
will recover as soon as possible in engineering to maintain the rotor angle stability between sending and receiv-
ing system and the reactive power will be consumed as little as possible to prevent the voltage instabilit y of the
receiving power grid. According to the analysis above, we can find that: P and Q are relevant to the dynamic
feature of converter: the reactive power demand may reaches to two peak values. The peak value appears during
the fault has great impact on the voltage stability of the AC grid, while the reactive power that capacitors of the
converter station provide decreases because of the voltage drop, which means the convertors will consume great
reactive power from the AC grid and drag the voltage down, leading to a vicious circle. During the recovery, the
restoration of real power is restricted by the reactive power. The former 100 ms since the fault was cleared, the
real power has increased quickly because of the abundant reactive power, while as the reactive power nearly
reached to the peak (about 0.75 p.u.), the real power increased slowly. The following passage will focus on the
physical process analysis related to the two peaks of dynamic reactive power, and put forward several strategies
for suppressing the peak of the dynamic reactive power and real power recovery acceleration.
3. Physical Process Analysis Related to the Peak of Dynamic Reactive Power
The control system plays an important part in the operation of HVDC which influences the power and voltage
[8]. T he control mode will usually be switched many times during the faul t and its recovery, so its not appro-
priate to anal yze based on a constant control mode assumption. The following passage will analyze the physical
process related to dynamic reactive power peak combining with the switch logic of control system.
Though many new features are added to HVDC control system as the development of mordent control theory,
the typical control feature is still be used in Yun-Guang HVDC control system because of the conservatism of
power industry. The control mode of the rectifier includes constant current control (including VDCOL) and con-
stant αmin control while the control mode of the inverter includes constant voltage control, constant γ co ntr o l,
constant current control (including VDCOL) and constant αmin control. The control instructions of control layers
above pole control such as power modulation are not considered for the following two reasons: 1) the time con-
stant of pole control instruction is high; 2) the minimum current value is chosen from all current instructions in
pole control. The current value set by the power control instruction won’t be chosen since it is high. Though the
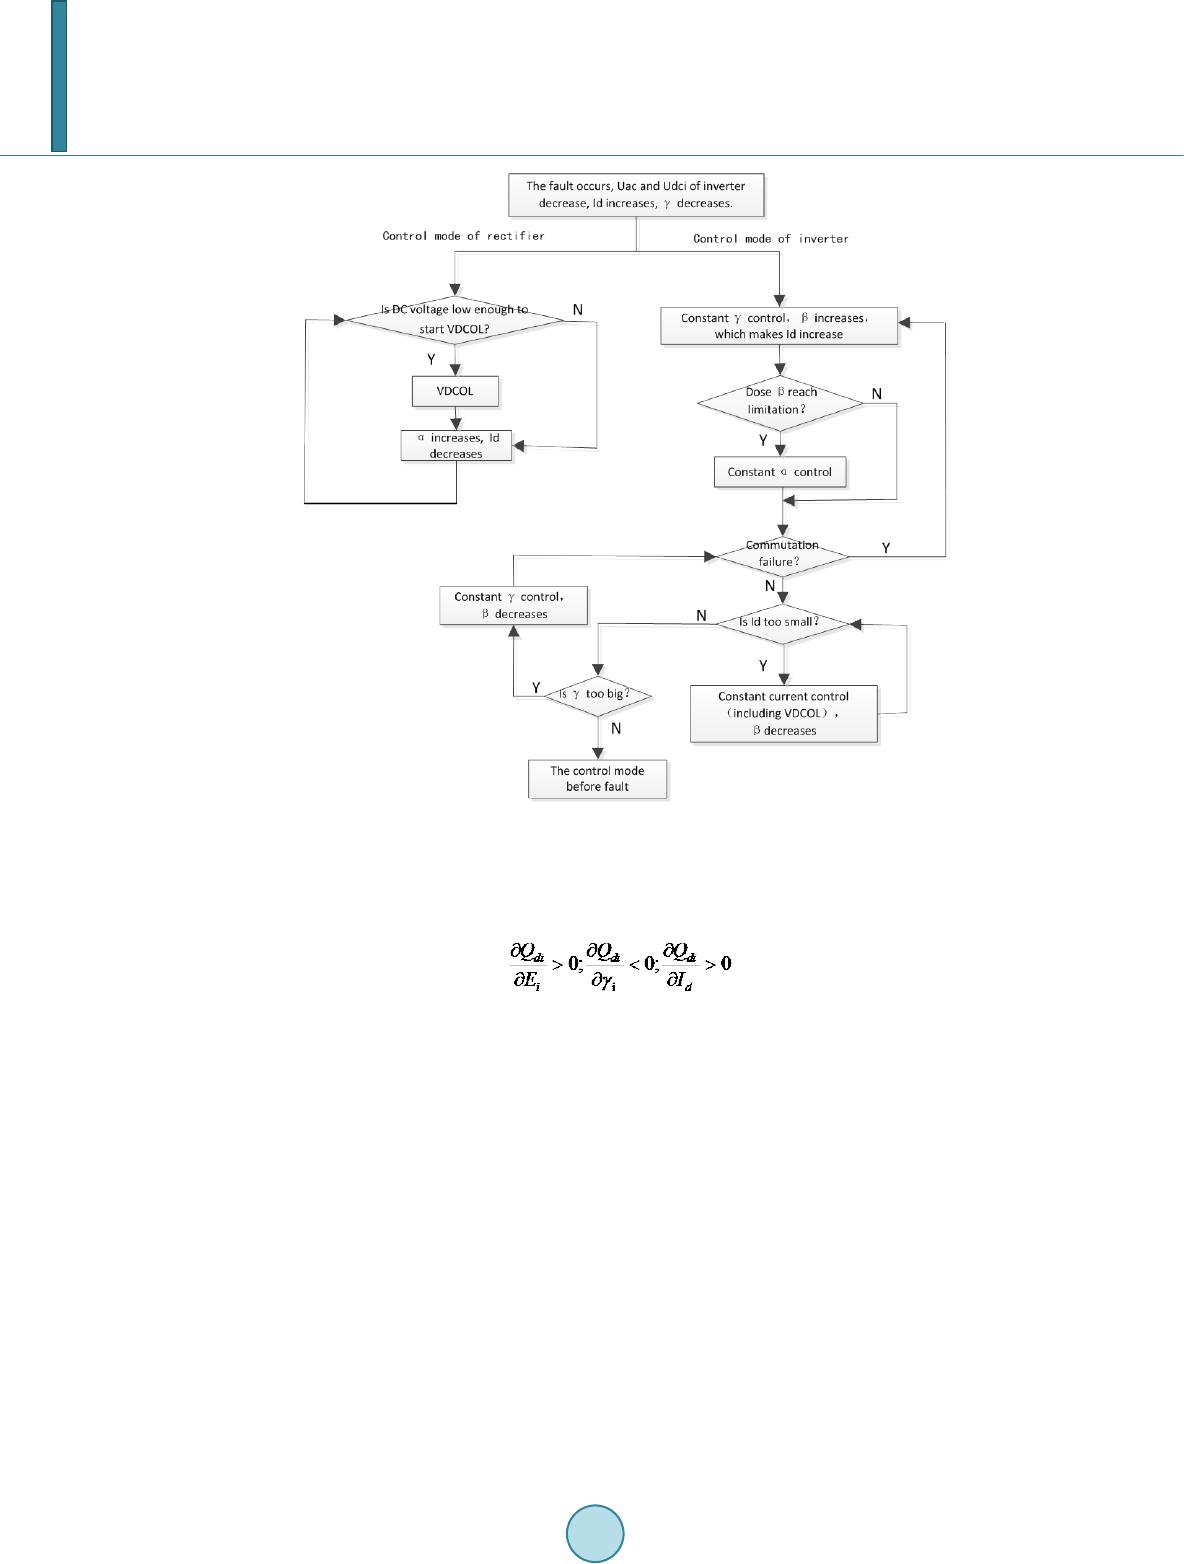
control mode is chosen automatically in valve control layer (rectifier chooses the minimum value, while inverter
chooses the maximum value), the control mode switch logic during the transient period of large-di st ur ba nce is
shown in Figure 3 according to a lot of simulation results. The inverter power expression is derived below:
i
22 22
( cos)
()()(cos )
didi dmici dd
did midid mimiicid
PUIKERI I
QI KEUIKEKERI
γ
γ
= =−
=−=− −
(1)
Pdi and Qdi are respectively the real power the converters transmit and reactive power the converters consume.
Ei, Udi, Id, γi are respectively the AC voltage, DC voltage, DC current and extinction angle of inverter. Km and Rci
are constant values.
3.1. The First Peak of Dynamic Reactive Power
The fault may cause an inverter commutation failure which leads to the decrease of Udc in inverter and the in-
crease of Id. It can be found in Figure 3 that inverter will choose the constant γ control mode which will increase
β rapidly. Since the voltage of commutation bus doesn’t drop to zero during the fault, the inverter will recover
C. J. Xia et al.
180
Fig ure 3. The control mode switch logic during the transient period of large-disturbance.
commutation rapidly. As γ usually overshoots to a high value because of the inherent characteristic of PI con-
troller and the current value is high this time, the first peak value appears according to expression (1).
Here is the corresponding control strategy. It’s easy to found that:
(2)
During the fault, AC voltage Ei is small, which is benefit to the suppression of the peak value of the dynamic
reactive power, but it depends on the severity of the fault. Though the decrease of γ will lead to the decrease of
reactive power, the high γ value during the commutation recovery caused by the overshoot of control system is
not suitable to be altered, or may increase the duration of commutation failure. It’s suitable to decrease the DC
current Id by alter the parameters of VDCOL, whose parameters play an important in dynamic power [9].
3.2. The Second Peak of Dynamic Reactive Power
The second peak value appears in the period of recovery of DC system and it’s supposed that commutation fail-
ure won’t occur. When the fault is cleared, the DC voltage increases as the AC voltage increases. According to
Figure 3, we can find that the inverter chooses constant γ control at this time to decrease the high γ caused by
overshoot. So the change of voltage Ei, DC current Id and γ during the recovery are benefit to the increase of re-
active power. Since the voltage recovers more quickly than the current because of the delay link of VDCOL, the
peak value of the reactive power will appears at the moment when the current reaches to the peak. In addition,
according to the analysis of control system, we can find that Yun-Guang HVDC control system has adopted
such a strategy to avoid commutation failure: regulating β rapidly if γ is small, regulating β slowly if γ is big.
This is why the reactive power increases slowly during the later period of recovery.
Here is the corresponding control strategy. In order to suppress the peak of the reactive power, we can take
measures to suppress the overshoot of current and increase the drop rate of γ. The latter is also benefit to the re-
C. J. Xia et al.
181
covery of real power, but may increase the risk of commutation failure, so it must be carefully considered. The
former can be achieved through optimizing the parameters of VDCOL. When the VDCOL control starts, we can
find the following equation:
cos
miici dd
K
ER IKIB
γ
−=+
(3)
The left side of the equation depends on the converter, while the right side depends on the VDCOL curve. K
is the slope, B is the intercept. The value of Id can be solved as below:
1( cos)
dmi i
ci
IKE B
RK
γ
= −
+
(4)
We can find that the current is not only relevant to AC voltage Ei but also VDCOL parameters K and B. The
transient power feature optimization can usually be achieved by altering these two parameters.
4. Conclusions
When the distur ba nce of the AC system is not large enough to cause commutation failure, the fluctuation of the
real power is small and the real power recovers fast.
When the disturbance of the AC system is large enough to cause commutation failure, the P-Q transient
curves of inverter under different AC voltage drops are similar. P and Q stabilize to a low value at 85 ms - 90 ms
after the fault occurs. The reactive power reaches to the peak value (about 0.74 p.u.) at about 100 ms after the
fault is cleared. Later, the real power increases si gni ficantly sl owly.
The study on power features of the inverter is benefit both to the rotor angle stability and voltage stability of
the received syst e m. In most cases, the peak demand of dynamic reactive power of inverter usually appears re-
spectively during the period of fault and recovery. According to the theoretical analysis, the peak suppression of
the dynamic reactive power and the real power recovery acceleration can be achieved by optimizing the
VDCOL link, PI controller and constant γ control.
Acknowledgem e nts
This work was financially supported by National High Technology Research and Development Program of
China (2012AA050209).
References
[1] Zhang, J.S., Zhang, Y., Zhang, Z.C. and Wu, Z.G. (2 00 5) Influence of DC System Control Modes on Voltage and
Power Recovery after Large Disturbance in Hybrid AC/DC System. Power System Technology, 20, 20-24.
[2] Yang, W.D., Xue, Y.S., Jing, Y., Chao, J., Huang, W.L., Hang, C. and Yang, B.B. (2003) A Coordinated Recovery
Strategy for 3 HVDC System Involved in the South China Power Grid. Automation of Electric Power Systems, 27, 67-
70.
[3] Ch en, X.Y., Han, M.X. and Liu , C.R. (20 12 ) A Coordinate Rotational Transformation Based Virtual Power V/f Droop
Control Method for Low Voltage Microgrid. Automation of Electric Power Systems, 36, 58 -63.
[4] Zhang, Y.D. (2013 ) Research on Dynamic Reactive Power Demand Characteristics and Counter-Measures of Received
Power Grid in AC/DC Hybrid Power System.
[5] Chen W.-B., Zhang, Y. and Xie, H.-F. (2010) Study on Emergency DC Power Support for UHVDC Fault. Proceedings
of the CSU-EPSA , 22, 113-118.
[6] Gu o, Q.W. (2012) Study on the Dynamic Characteristic of ±660 kV Yidong HVDC System.
[7] CIGRE WG 14.07, IEEE WG 15.05 (19 97 ) Guide for Planning DC Links Terminating at AC Locations Having Low
Short-Circuit Capacities. 120 -121.
[8] Li u , X.M. (2011) Influence of DC System Control Mode on Voltage Stability of Receiving-End Power Grid. Electric
Power Automation Equipment, 31, 69-77.
[9] Wan g, K. (2007) Study of VDCOL Control Strategies for Coordinated Recovery of Multi-feed-in HVDC System. Ji-
angsu Electrical Engineering, 26, 1-4.