 Journal of Power and Energy Engineering, 2014, 2, 74-80 Published Online September 2014 in SciRes. http://www.scirp.org/journal/jpee http://dx.doi.org/10.4236/jpee.2014.29011 How to cite this paper: Kim, H.T., Rhee, B.W. and Choi, H.-L. (2014) PIV Measurement of Velocity Distribution in the Mod- erator Circulation Test (MCT). Journal of Power and Energy Engineering, 2, 74-80. http://dx.doi.org/10.4236/jpee.2014.29011 PIV Measurement of Velocity Distribution in the Moderator Circulation Test (MCT) Hyoung Tae Kim, Bo Wook Rhee, Hwa-Lim Choi Severe Accident and PHWR Safety Research Division, Korea Atomic Energy Research Institute (KAERI), Daejeon, Republic of Korea Email: kht@kaeri.re.kr Received July 2014 Abstract Korea Atomic Energy Research Institute (KAERI) has been carrying out a scaled-down moderator test program to simulate the CANDU-6 moderator circulation phenomena during steady state op- eration and accident conditions. The Moderator Circulation Test (MCT) facility was designed and constructed as 1/4 scale of the prototype of CANDU-6 reactor. In the present work spatial distri- bution of two-dimensional velocity in the MCT facility under isothermal condition was measured using planar Particle Image Velocimetry (PIV) system which consists of double pulsed laser, syn- chronizer, and high speed camera. TSI’s Insight TM 4G software was used to perform PIV image capturing, PIV calculation and post processing. 10 μm sized silver-coated hollow sphere particles were used as flow tracer particles. Multiple experiments were conducted to cover large area of the MCT facility with limited field of view of a single camera. Instantaneous and averaged velocity field were analyzed for each spatial position and flow rate. This research is capable of offering valida- tion data for self-reliant CFD tools to predict moderator subcooling margin in CANDU-6 reactor. Keywords PIV, CANDU-6, Moderator Circulation Test (MCT), Moderator Subcooling 1. Introduction One of the important design features of a CANDU reactor (a pressurize heavy water reactor) is the use of mod- erator as a heat sink during some postulated accidents such as a large break Loss Of Coolant Accident (LOCA). If the moderator available subcooling at the onset of a large LOCA is greater than the subcooling requirements [1], a sustained calandria tube dryout is avoided. The subcooling requirements are determined from a set of ex- periments known as the fuel channel contact boiling experiments [2]. The difference between available sub- cooling and required subcooling is called subcooling margins. The local temperature of the moderator is a key parameter in determining the available subcooling. To predict the local temperature in the calandria, KAERI started experimental research on moderator circula- tion as one of a national R&D research programs from 2012. This research program includes the construction of the Moderator Circulation Test (MCT) facility [3], production of the validation data for self-reliant CFD tools, and development of an optical measurement system using Particle Image Velocimetry (PIV) [4] and Laser In-  H. T. Kim et al. duced Fluorescence (LIF) techniques. Small-scale 1/40 [5] and 1/8 [6] small-scale model tests were performed prior to installation of the main MCT facility to identify the potential problems of the flow visualization and measurement expected in the 1/4 scale MCT facility. In the present work the test vessel is equipped with 380 acrylic pipes instead of the heater rods and a prelimi- nary measurement of velocity field using PIV is performed under the iso-thermal test conditions. The pattern of preliminary measurement results are investigated to prepare the future plan of measurements as well as to see the feasibility of the PIV application to MCT. 2. Test Facility and PIV System 2.1. MCT Facility The MCT facility consists of the primary and secondary water circuit as the same as CANDU-6 moderator sys- tem. The primary circuit, as shown in Figure 1(a), includes a moderator tank, a circulating pump, a heat ex- changer, and intermediate pipe lines. The circulating pump enforces the cold water to enter the tank through eight nozzles, four nozzles at each side, and heated water exits from two outlet pipes at the bottom of the tank. When water flows through the heat exchanger tubes, primary hot water is cooled by the secondary side water circulating through the external cooling tower. Then cold water comes back to the inlet nozzles via a circulating pump. The inner diameter and axial length of test vessel are 1900 mm and 1500 mm, respectively. The test vessel is equipped by 380 acrylic tubes (for non-heating test) or electric heaters simulating the horizontal fuel channels (for heating test). The electric heaters are designed to provide axial and radial power profiles representative of CANDU6 power profiles. An axial power profile is a symmetric cosine profile. A radial power profile is created by arranging the heaters in two concentric power zones, with an individual heat power ratio of 1.4 between the inner and the outer zones. Tank walls with 5 mm of thickness and other support structures are made of SUS 304 stainless steel. Several transparent sections are incorporated into the vessel to facilitate flow visualization tests. The front and backward side of windows are made of one part of poly-carbonate sheet with 15 mm of thickness, which is sealed between two opposing stainless steel flanges (each 35 mm and 25 mm of thickness) with a silicone ‘o’-rings placed in-between. Eight view ports are installed to each side of the tank wall. 2.2. PIV Measurement The PIV measurement system consists of a TSI POWERVIEWTM Plus 2MP CCD camera and a Dual Nd-Yag. The double pulse laser was operated at 15 Hz with a 200 mJ/pulse. The laser beam was modified using spherical and cylindrical lens combination to form a thin light sheet on the x-y plane. 10 µm sized silver coated hollow spheres were used as a flow tracing particles. The 2MP CCD camera records scattering light from the tracer par- ticles. INSIGHTTM 4G software is used to control the image capture and perform the data analysis. (a) Overview of the primary water circuit of MCT (b) Pipe line configuration of MCT Figure 1. Geometric configuration of the MCT test facility. 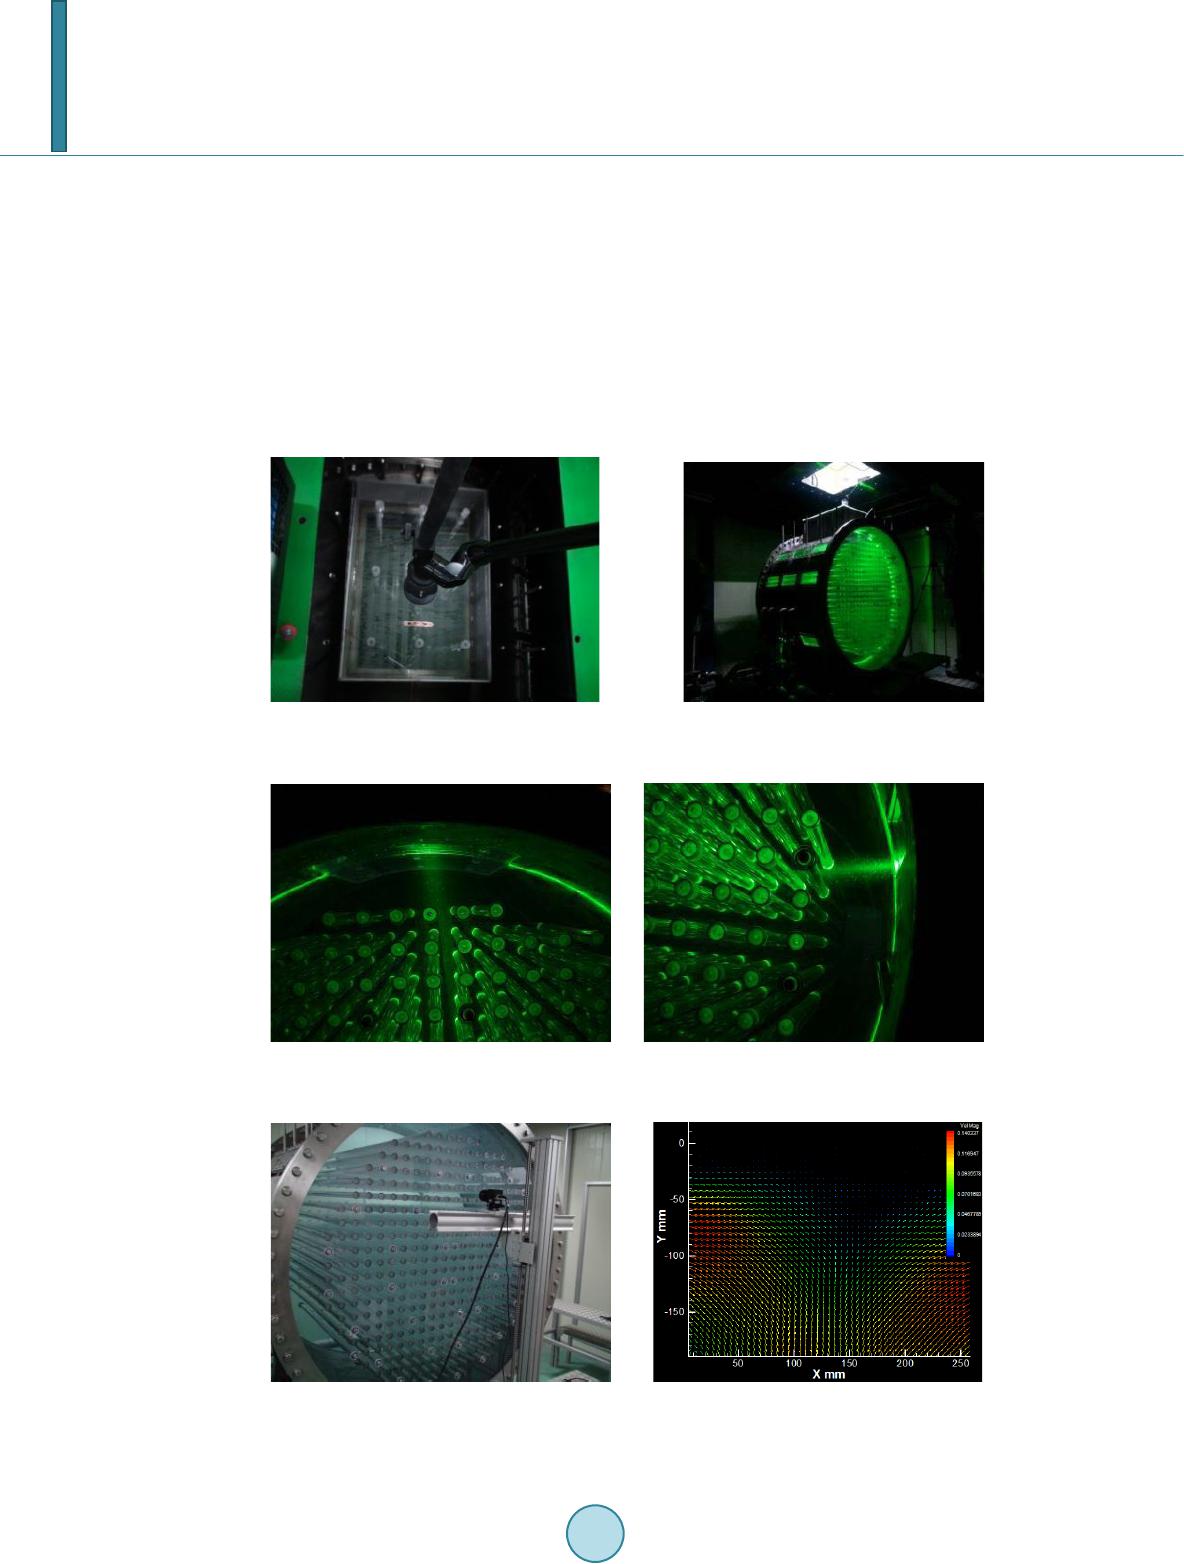 H. T. Kim et al. The PIV data analysis consists of cross-correlation to calculate the flow vectors with sequentially captured images which have discrete time difference (dt). The cross-correlation calculation was performed in each inter- rogation windows whose size is 32 × 32 pixels. Figure 2 illustrates the PIV measurement system. The laser guiding arm in Figure 2(a) was used to guide the laser beam to the target position and direction (top of the tank, downward). At the end of the guiding arm, com- binations of spherical and cylindrical lens are attached to make a thin light sheet on the x-y plane as shown in Figure 2(b). As the transparent window on top of the tank is not wide, the laser illumination from the top was limited to the center region. To overcome the restriction, additional experiments were conducted by placing the laser to side of the tank as shown in Figure 3(b). In the PIV measurement the camera views the light sheet in front of the polycarbonate plate of the tank. The camera mount with two axis (x-y) traverse systems (Figure 4(a)) ensures the target areas of the object plane in (a) Alignment of laser arm (b) Overall view of laser sheet Figure 2. Positioning of the measurement plane in the tank. (a) Downward direction (b) To one side direction Figure 3. Illumination of leaser sheet in two different directions. (a) Camera mount with two axis traverse system (b) Analysis of PIV images Figure 4. PIV image capture and vector generation. 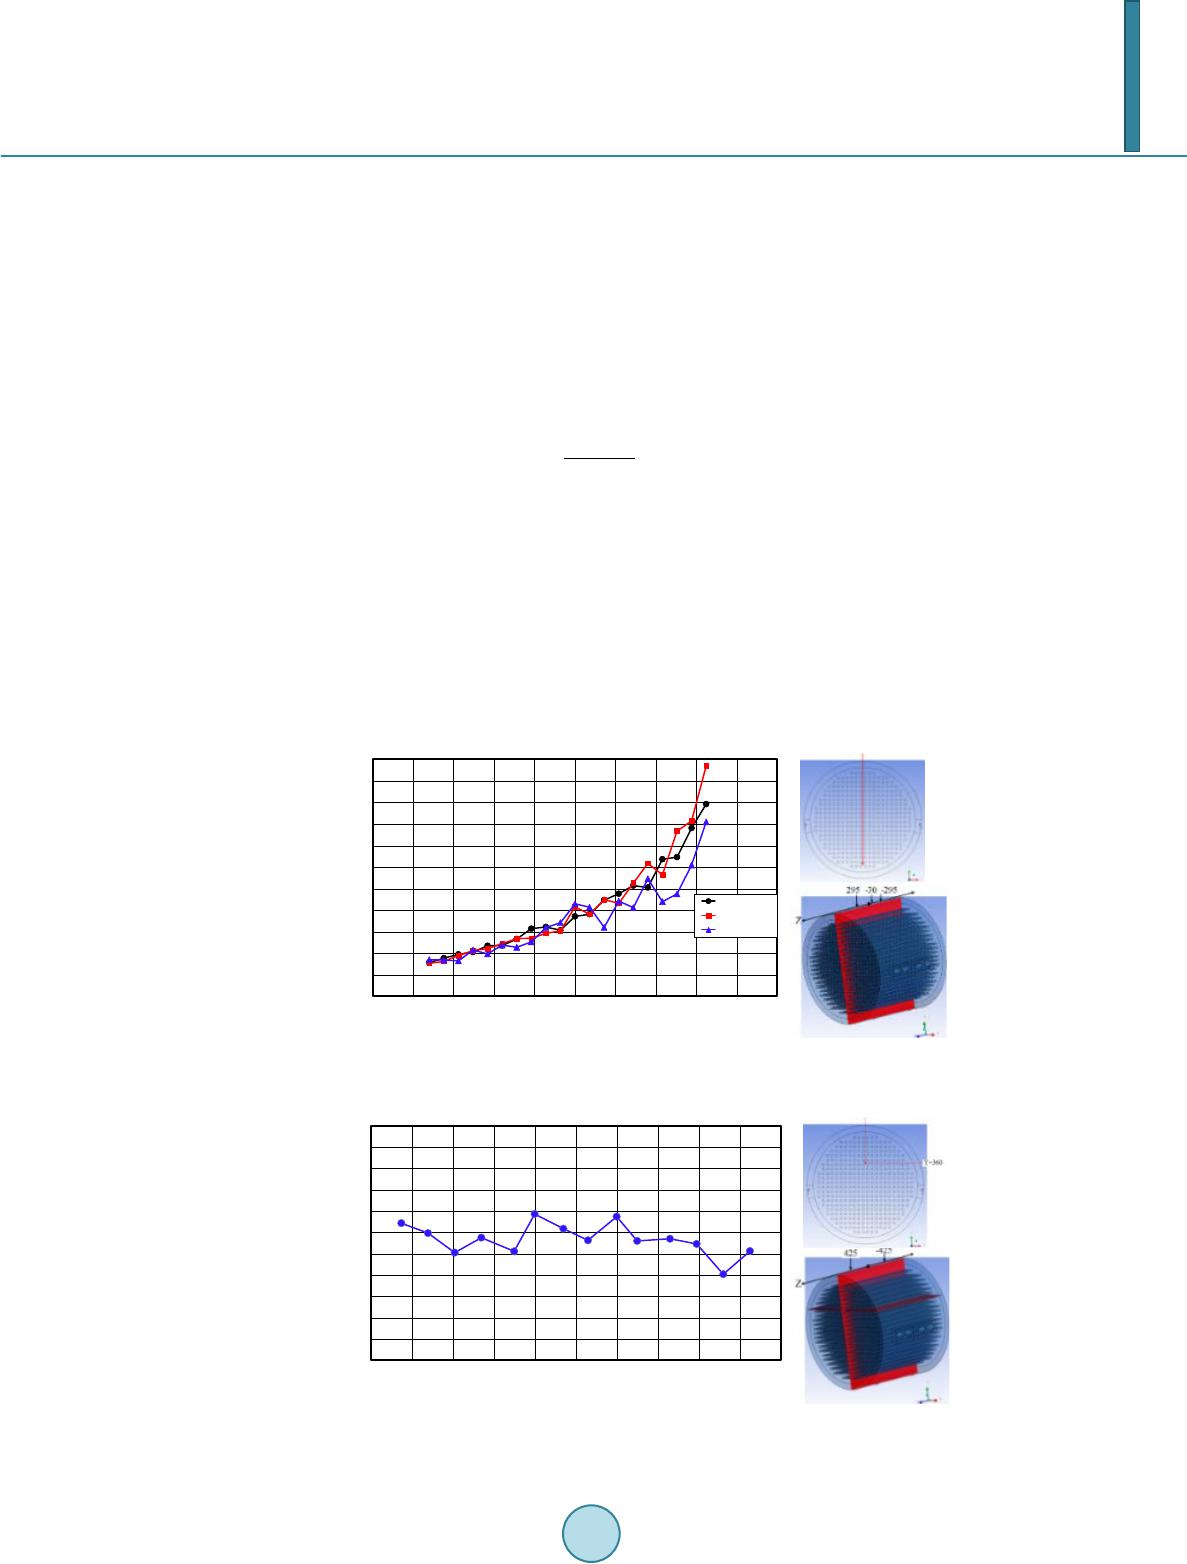 H. T. Kim et al. focus. The target images are captured by unit cell of square array while the camera is vertically traversed with a distance of pitch. Using Insight 4G, image acquisition, analysis and display software, image capture synchroni- zation is controlled. In the sequence capture mode 200 correlation images in each test condition are collected and these images are processed by cross-correlation technique (Figure 4(b)). Then the average of 200 vector files is computed by Tecplot software. Finally, complete content and organizational editing before formatting. Please take note of the following items when proofreading spelling and grammar: 3. Test Results and Analysis From the scaling analysis [7], the flow pattern inside the moderator tank is determined by the ratio of the char- acteristic buoyancy to inertia forces, the non-dimensional Archimedes number (Ar), defined as. (1 ) where, Q is a heater power, D is a tank diameter, A is an inlet nozzle area, and u is an inlet velocity. In the iso-thermal test for the present work, where the flow is momentum dominant, as shown in Figure 5, the inlet jets penetrate the top of the tank and produce a downward flow through the center of the tube columns to- ward the outlet nozzle, and the flow fields are in symmetric distributions. Downward flow vectors (-v) through the center of the tube columns are measured and the magnitude of the velocity in the center point of the unit cell is plotted in Figure 6. The velocity distributions along the center line of the tank with different axial locations (z-direction) are compared. The measurement results clearly capture the decrease of velocity as it flows down toward bottom of the tank. The differences among velocity values for z = −295 mm, −30 mm, and 295 mm are small. However the velocity values for z = 295 mm are slightly lower than BC: MASS flow = 60 m3/h Location: x = 0 mm x = 0 Figure 5. Variation of downward velocity along the center line of tank for different Z-directions. BC: Flow rate = 60 m3/h Location: 5th pitch (x,y,z, x = (0,360,z) x = 0 Figure 6. Comparison of downward velocities for different z-directions. 0.00 0.02 0.04 0.06 0.08 0.10 0.12 0.14 0.16 0.18 0.20 0.22 -1000-800 -600 -400 -2000200 400 600 8001000 Velocity (m/sec) Vertical location, y (mm) z = - 295 mm z = - 30 mm z = 295 mm 0.00 0.02 0.04 0.06 0.08 0.10 0.12 0.14 0.16 0.18 0.20 0.22 -500 -400 -300 -200 -1000100 200 300 400 500 Velocity (m/sec) Axial location, z (mm)  H. T. Kim et al. other two cases in the upper elevation (y > 0) of tank. Since the case for z = 295 mm is measured the most far away from the CCD camera, the uncertainty of PIV measurements for this case should be investigated by re- peating the test under same condition. For the same 2D location, where x = 0 mm and y = 360 mm (on the x-y plane), the downward velocities for different z-locations (axial direction) are compared in Figure 7. Most of the velocity values are similar and within 17% of difference from 0.12 m/sec. Variation of downward velocities along the vertical line for different x-directions (horizontal direction on the cross-sectional plane) is compared in Figure 8. Since the downward flow is dominant along the center of the tube columns, the velocity is rapidly decreased as the measurement location is far from the center of tank. The previous velocity measurements are performed for inlet flow rate of 30 m3/h from one side of inlet noz- zles. To see the effect of the inlet flow rate to the internal velocity, other 3 cases for lower inflow rates are con- sidered. The velocity is measured for the same location (x = 0 mm, y = 360 mm, z = −30 mm) as the inlet flow rate is reduced from the reference value (30 m3/h) by 3 m3/h. The velocities for inlet flow rate of 21, 24, 27, and 30 m3/h are compared in Figure 9. When the inlet flow rate becomes below the 27 m3/h, the velocity is clearly decreased. The 2D velocity vectors near upper part of the tank wall are plotted in Figure 9. The measurement regions are far away from the vertical center line by 3 times of pitch (Figure 9(f)). The inlet jets from both sides of nozzles flow along the curvature of the tank wall and they collide each other at the center of the tank. It is clearly shown that the magnitude of vectors become larger as the inlet flow rate is increased. The velocity vector incoming from the left side of measurement window is slightly inclined in upward direction and it becomes inclined in downward direction passing through the right side of measurement window. If the measurement window is horizontally moved to the center of the tank, the vertical downward vector can be captured. BC: MASS flow = 60 m3/h Location: z = −30 mm x = 0 Figure 7. Variation of downward velocity along the vertical line for different x-directions. Figure 8. Comparison of downward velocity for different inflow rate (half of total flow rate). 0.00 0.02 0.04 0.06 0.08 0.10 0.12 0.14 0.16 0.18 0.20 0.22 -1000-800 -600 -400 -2000200 400 600 8001000 Velocity (m/sec) Vertical location, y (mm) BC: Mass flow 60m3/hr Location: z 30 mm x = 0 mm x = 72 mm x = 144 mm x = 216 mm x = 288 mm 0.00 0.02 0.04 0.06 0.08 0.10 0.12 0.14 0.16 0.18 0.20 0.22 20 22 24 26 28 30 32 Velocity (m/sec) Volumetric flow (m 3 /hr) Location: 5th pitch (x,y,z) = (0,360,-30)  H. T. Kim et al. (a) 18 m3/h (b) 21 m3/h (c) 24 m3/h (d) 27 m3/h (e) 30 m3/h (f) Measurement location Figure 9. 2D velocity profiles near the tank wall for different inflow rate. 4. Conclusions • A 1/4 scale of the Moderator Circulation Test (MCT) facility has been installed to reproduce the moderator circulation behavior in the CANDU6 calandria tank. In the present work the test vessel is equipped with 380 acrylic pipes instead of the heater rods and a preliminary measurement of the velocity field using PIV is per- formed under the iso-thermal test conditions. • The 2D velocity is measured on the cross-sectional plane normal to the axial direction of the tank. The PIV measurement results can capture the same flow pattern as that expected in the CANDU6 calandria tank under a momentum dominant flow condition, where the inlet jets penetrate the top of the tank and produce a downward flow through the center of the tube columns toward the outlet nozzle, and the flow fields are in symmetric distributions. • The measurements of the downward velocities are performed at different locations. The velocity is shown to be axially uniform. The velocity is rapidly decreased as the measurement location is far from the center of the tank, since the downward flow is dominant along the center of the tube columns. • More experimental works for the iso-thermal conditions as well as the heating conditions will be performed  H. T. Kim et al. and the CFX model will be validated against the PIV measurement data in the future. Acknowledgements This work was supported by the National Research Foundation of Korea (NRF) grant funded by the Korea gov- ernment (Ministry of Science, ICT, and Future Planning) (No. NRF-2012M2A8A402596 4) . References [1] Fan, H.Z., Aboud, R., Neal, P. and Nitheanandan, T. (2009) Enhancement of the Moderator Subcooling Margin Using Glass-Peened Calandria Tubes in CANDU Reactors. Proceedings of 30th Annual Conference of the Canadian Nuclear Society, Calgary. [2] Gillespie, G.E. (1981) An Experimental Investigation of Heat Transfer from a Reactor Fuel Channel: To Surrounding Water. Proceedings of 2nd Annual Conference of the Canadian Nuclear Society, Ottawa. [3] Kim, H.T., Rhee, B.W., Cha, J.E. and Choi, H.L. (2013) Status of Moderator Circulation Test at Korea Atomic Energy Research Institute. Proceedings of Korea Nuclear Society Spring Meeting, Gwangju. [4] Meinhart, C.D., We rel ey, S.T. and Saniago, J.G. (2000) A Pive Algorithm for Estimating Time-Averaged Velocity Fields. Journal of Fluids Engineering, 122, 285-289. [5] Kim, H.T. (2013) Measurement of Velocity and Temperature Profiles in the Scaled-down CANDU-6 Moderator Tank. Proceedings of the 21st International Conference on Nuclear Engineering, Chengdu. [6] Kim, H.T., Se o, H. and Cha, J.E. (2013) Measurement of Velocity Profile in the 1/8 Scale CANDU-6 Moderator Tank Using Particle Image Velocimetry. Proceedings of 9th Pacific Symposium on Flow Visualization and Image Process- ing, Busan. [7] Kim, H.T., Cha, J.E., Rhee, B.W. and Choi, H.-L. (2012) Preliminary CFD Analysis of the Moderator Circulation Test. 1st International Workshop on Advanced CANDU Technology, Daejeon, 29-30 November 2012.
|