 Energy and Power En gi neering, 2011, 3, 158-166 doi:10.4236/epe.2011.32020 Published Online May 2011 (http://www.SciRP.org/journal/epe) Copyright © 2011 SciRes. EPE PEMFC Application in a Gliding Arc Plasam-Catalysis Reforming S ys te m Us in g Bi og as Mun Sup Lim, Young Nam Chun BK21 Team for Hydrogen Production, Departme nt of Env i ron me nt al En gi neering, Chosun University, Gwangju, Korea E-mail: ynchun@chosun.ac.kr Received December 27, 2010; revised March 30, 2011; accepted April 8, 2011 Abstract In this study, bio-waste gas is converted to sustainable hydrogen energy in good quality and low pollution. In addition, generated highly concentrated hydrogen is applied to fuel cell (PEMFC) to resolve environmental and energy crisis issue via gliding arc plasma system. Parameters that can affect the reforming performance of bio-gas in gliding arc plasma system were studied. Especially, the optimal operating condition in water gas shift reactor and preferential oxidation reactor for CO removal was proposed. For the parametric re- searches, change in steam feed amount and temperature change in catalyst bed in water gas shift reactor were studied. For the preferential oxidation reactor, air input flow rate change and temperature variation in catalyst bed were evaluated. The optimal operating conditions for gliding arc plasma reforming system are proposed as 6 : 4 of biogas component ratio (i.e., CH4 : CO), 3 of steam/carbon ratio, 16 L/min of total gas flow rate, and 2.4 kW of input electric power. Where, the concentration of biogas that passed each reactor shows 57.5% of H2, 7 ppm of CO, 9.2% of CO2, and 3.4% of CH4. Therefore, less than 10 ppm of CO is achieved, and this system can be applicable for PEMFC. Keywords: H2 Concentration, CO Removal, Water Gas Shift, Preferential Oxidation, Biogas Reforming 1. Introduction Recent depletion of fossil-based fuel has brought the significant issues, such as energy crisis, global warming, and environmental hazards. For the countermeasure, re- newable energies have been focused. Among the renewable energy sources, bio-waste gas is created from landfills, waste water disposal plant, and anaerobic metabolism of organic material. Biogas shows the different component ratio by types, but about 55% - 70% of CH4, 27% - 40% of CO2, less than 1% of hydro- gen, and 3% of H2S, etc are consisted. By reforming this bio energy to hydrogen energy, the environment-friendly system can be established. In addition, biogas reforming for fuel cell application exhibits high energy efficiency and good environment friendliness [1]. Polymer electrolyte membrane fuel cell can be used with not only pure hydrogen but also mixed gases of highly pure hydrogen. Direct application of hydrogen faces the danger to fire, and hydrogen reforming is widely adopted. For the reforming methods, steam re- forming, partial oxidation, autothermal reforming, etc. are used to generate synthetic gas. Where, synthetic gas is composed of hydrogen, carbon dioxide, steam, and carbon monoxide. However, carbon monoxide can bring critical impact on the reliability of fuel cell. Therefore, water gas shift reaction and preferential oxidation are used to reduce the concentration of carbon monoxide less than 10 ppm for the application on fuel cell [2,3]. Many techniques have been developed, and gas phase plasma refers the state of separation with electron and cationic ion at high temperature. Plasma means a neutral gas with same number of positive and negative charges even for the high separation of electrical charges. Gener- ally, plasma is classified as thermal plasma (high pres- sure or equilibrium plasma) and non-thermal plasma (low pressure or non-equilibrium plasma) [4]. Especially, gliding arc discharge (low plasma) can control the reac- tion state in low pressure, and features high conversion rate and energy efficiency. It has been noticed as new and environment-friendly alternative [5]. Gliding arc plasma reforming system, which is pre- pared laboratory space, has quick response type, and can be applicable to various types of fuel and biogases. In 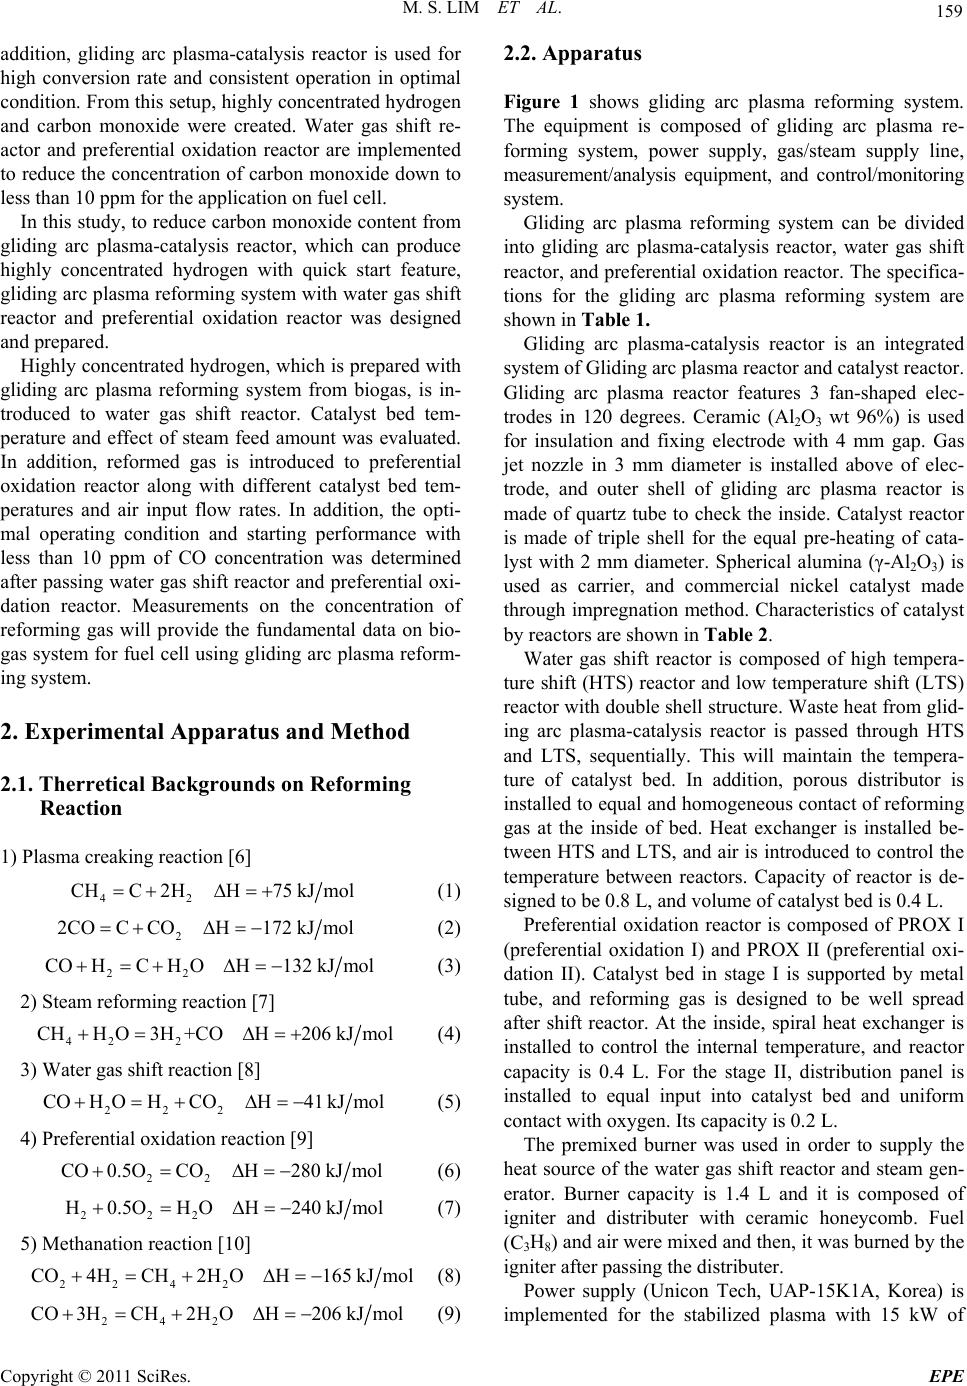 M. S. LIM ET AL. 159 addition, gliding arc plasma-catalysis reactor is used for high conversion rate and consistent operation in optimal condition. From this setup, highly concentrated hydrogen and carbon monoxide were created. Water gas shift re- actor and preferential oxidation reactor are implemented to reduce the concentration of carbon monoxide down to less than 10 ppm for the application on fuel cell. In this study, to reduce carbon monoxide content from gliding arc plasma-catalysis reactor, which can produce highly concentrated hydrogen with quick start feature, gliding arc plasma reforming system with water gas shift reactor and preferential oxidation reactor was designed and prepared. Highly concentrated hydrogen, which is prepared with gliding arc plasma reforming system from biogas, is in- troduced to water gas shift reactor. Catalyst bed tem- perature and effect of steam feed amount was evaluated. In addition, reformed gas is introduced to preferential oxidation reactor along with different catalyst bed tem- peratures and air input flow rates. In addition, the opti- mal operating condition and starting performance with less than 10 ppm of CO concentration was determined after passing water gas shift reactor and preferential oxi- dation reactor. Measurements on the concentration of reforming gas will provide the fundamental data on bio- gas system for fuel cell using gliding arc plasma reform- ing system. 2. Experimental Apparatus and Method 2.1. Therretical Backgrounds on Reforming Reaction 1) Plasma creaking reaction [6] 42 CHC2HH75 kJmol (1) 2 2COCCOH172kJmol (2) 22 COHCHOH132 kJmol (3) 2) Steam reforming reaction [7] 42 2 CHHO3H+COH206 kJmol (4) 3) Water gas shift reaction [8] 222 COHOHCOH41 kJmol (5) 4) Preferential oxidation reaction [9] 22 CO0.5OCOH280kJmol (6) 222 H0.5OHOH240kJmo l (7) 5) Methanation reaction [10] 22 42 CO4HCH2HOH165 kJmol (8) 242 CO3HCH2HOH206kJmol (9) 2.2. Apparatus Figure 1 shows gliding arc plasma reforming system. The equipment is composed of gliding arc plasma re- forming system, power supply, gas/steam supply line, measurement/analysis equipment, and control/monitoring system. Gliding arc plasma reforming system can be divided into gliding arc plasma-catalysis reactor, water gas shift reactor, and preferential oxidation reactor. The specifica- tions for the gliding arc plasma reforming system are shown in Table 1. Gliding arc plasma-catalysis reactor is an integrated system of Gliding arc plasma reactor and catalyst reactor. Gliding arc plasma reactor features 3 fan-shaped elec- trodes in 120 degrees. Ceramic (Al2O3 wt 96%) is used for insulation and fixing electrode with 4 mm gap. Gas jet nozzle in 3 mm diameter is installed above of elec- trode, and outer shell of gliding arc plasma reactor is made of quartz tube to check the inside. Catalyst reactor is made of triple shell for the equal pre-heating of cata- lyst with 2 mm diameter. Spherical alumina (γ-Al2O3) is used as carrier, and commercial nickel catalyst made through impregnation method. Characteristics of catalyst by reactors are shown in Table 2. Water gas shift reactor is composed of high tempera- ture shift (HTS) reactor and low temperature shift (LTS) reactor with double shell structure. Waste heat from glid- ing arc plasma-catalysis reactor is passed through HTS and LTS, sequentially. This will maintain the tempera- ture of catalyst bed. In addition, porous distributor is installed to equal and homogeneous contact of reforming gas at the inside of bed. Heat exchanger is installed be- tween HTS and LTS, and air is introduced to control the temperature between reactors. Capacity of reactor is de- signed to be 0.8 L, and volume of catalyst bed is 0.4 L. Preferential oxidation reactor is composed of PROX I (preferential oxidation I) and PROX II (preferential oxi- dation II). Catalyst bed in stage I is supported by metal tube, and reforming gas is designed to be well spread after shift reactor. At the inside, spiral heat exchanger is installed to control the internal temperature, and reactor capacity is 0.4 L. For the stage II, distribution panel is installed to equal input into catalyst bed and uniform contact with oxygen. Its capacity is 0.2 L. The premixed burner was used in order to supply the heat source of the water gas shift reactor and steam gen- erator. Burner capacity is 1.4 L and it is composed of igniter and distributer with ceramic honeycomb. Fuel (C3H8) and air were mixed and then, it was burned by the igniter after passing the distributer. Power supply (Unicon Tech, UAP-15K1A, Korea) is implemented for the stabilized plasma with 15 kW of Copyright © 2011 SciRes. EPE  M. S. LIM ET AL. Copyright © 2011 SciRes. EPE 160 Figure 1. Schematic of the experiment setup for gliding arc plasma system. Table 1. Gliding arc plasma generating system. System parts Reactor stage Capacity of reactorVolume of catalyst bedShape Features Gliding arc plasma reactor 0.6 - Cylinder - 3 fan shaped electrodes - Gas jet nozzle - Ceramic insulator Gliding arc plasma-catalysis reactor Catalyst reactor 0.7 0.4 Triple shell Cylinder - Heat exchanger HTS 0.8 0.4 Water gas shift reactor LTS 0.8 0.4 Double shell cube - Porous distributor - Heat exchanger PROX I 0.4 0.15 Cylinder - Metal mesh tube - Spiral heat exchanger Preferential oxidation reactor PROX II 0.35 0.2 Cylinder - Distribution panel Table 2. Characteristics of commercial catalysts. Reactor stage Catalysis reactor HTS LTS PROX I PROX II Shape Sphere Pellet Pellet Sphere Sphere Size OD; 2 mm 3.2 × 3.2 mm 3.2 × 3.2 mm OD; 2 mm OD; 2 mm Composition NiO (10 - 14 wt%) Fe2O3 : Cr2O3 : CuO (80 : 8.5 : 2 wt%) Cu : Zn (40 - 44 : 44 - 50 wt%) Pt (2 wt%) Ru (1.8 - 2 wt%) Manufacturer Sϋd-Chemie Sϋd-Chemie Sϋd-Chemie Sϋd-Chemie Sϋd-Chemie maximum capacity (voltage: 15 kV, AC: 1 A). Gas/steam supply line is made of CH4 MFC (LINETECH, M3030V, Korea) and CO2 MFC (BRONKHOST, F201AC-FAC-22-V, Netherlands) for the precise control on gas flow rate. Air to preferential oxidation reactor is fed through MFC (LINETECH, M3030V, Korea). Steam is generated from water supply with feed pump (KNF, STEPDOSⓇ03, Switzerland). Measurement and analysis equipments for plasma discharge voltage and current are consisted of high volt- age probe (Tektronix, P6015, USA) and current probe (Tektronix, A6303, USA) along with oscilloscope (TDS 3052, USA). K-type thermocouple is used to measure the temperature via LabVIEW. Internal temperature of plasma is monitored in real time with device (KIMO, KTT300, USA). For gas analysis, gas chromatography with sampling line (SHIMAZU, GC-14B, Japan) and micro-gas chroma- tography (VARIAN, CP-4900, Netherlands) are adopted to analyze H2, CO, and CnHm at the same time.  M. S. LIM ET AL. 161 As control and monitoring system, LabVIEW (Na- tional Instrument, LabVIEW 8.6, USA) is utilized to control MFC, water pump, and heater. In addition, change in temperature and experimental conditions are monitored continuously. 2.3. Experimental Methods Temperature of steam generator, which is installed at the prior to gas feed in gliding arc plasma-catalysis reactor, is maintained at 290˚C, and temperature of catalyst bed is sustained up to 680˚C using external burner. 2.4 kW of input electric power is formed in stable, and 12 L/min of steam, 2.4 L/min of CH4, and 1.6 L/min of CO2 are in- troduced to conduct the experiment on optimal operation conditions in gliding arc plasma reforming system. The initial temperature characteristics of reactor are shown in Figure 2. CH4 and CO2 that were used in the experiment were fed via MFC for flow rate control. Steam is controlled via water feed pump through calculation on the conver- sion rate from water to steam. After that, steam is intro- duced to steam generator along with fuel, and entered into reactor as completely vaporized gas. Collection of reforming gas is made through sampling port on the discharging portion of reactor. Particulate is removed from collected sample via impinge, and mois- ture is condensed through cooling unit. As dry gas state, the gas is continuously introduced into each sampling loop of gas chromatography. TCD detector is adopted, and molecular sieve 5A (Shimadzu) for H2 and Porapak Q (Varian) for C2H4, C2H6, CO2 are used as analysis column. As standard condition, steam feed of HTS and LTS in water gas shift reactor is changed to find the optimal condition of steam/carbon ratio. In addition, the experi- ment that is aimed to determine optimal catalyst bed temperature was conducted. For preferential oxidation reactor, air input flow rate of PROX I and PROX II was varied to find the optimal operating condition including the temperature change in catalyst bed. 2.4. Error Analysis Table 3 shows the calibrated range, accuracy and rela- tive error of measurement. Errors in experiments can arise from observation, reading and test planning. The accuracy of the experiments has to be validated with an error analysis. That was done by using the method of average value of data was calculated by results of identi- cal experimental condition. Then each data were ana- lyzed by polynomial regression. For a given data set of x, y pairs, a polynomial regression of this kind can be gen- erated as the Equation (10), Standard error (Sy/x) was Time(min) Tempe atu e( oC) 04080120 160 200 240 280 320 360 0 200 400 600 800 1000 Heatingburner (860oC) Catalysis Reactor (680oC) HTS(500oC) LTS(310oC) Steam heater (290oC) PROX I (190oC) PROX II (180oC) Starting point for experiments Plasma reactor (580oC) Figure 2. Initial operating characteristics of the reactor. calculated by Equation (11) 234 01 234,yaax axaxax (10) 2 2 01 2 1 1 n ii i yx yaaxax Snm i (11) 3. Results and Discussion 3.1. Overall Reactor Concentration for Standard Condition As biogas composition for the experiment, 6 : 4 for CH4 : CO2, which is similar to landfill biogas, is selected. Through repeated and preliminary experimentation, 2.4 kW of input electric power, 3 of S/C ratio, 680˚C of catalyst bed temperature in gliding arc plasma-catalysis reactor, and 16 L/min of total gas flow rate are used to achieve stabilized plasma discharge and 62% of hydro- gen production. In addition, the corresponding tempera- ture of HTS, LTS, PROX I, and PROX II was main- tained as 500˚C, 340˚C, 190˚C, and 190˚C. Air feed to PROX reactor was 300 mL/min for stage I and 200 mL/min for stage II. The relevant test results are in- cluded in Table 4. Figure 2 shows the concentration of major gas in each reactor. Concentration of reformed H2 and CO in gliding arc plasma-catalysis reactor was 62.1% and 11.7%, re- spectively. For HTS, it was 64.1% and 11.6%, and LTS showed 64.3% and 6.0% of concentration level. Hydro- gen concentration after each reactor is increased accord- ing to Equations (4) and (5). In addition, decrease in CO concentration is also determined. For PROX I, H2, CO, Copyright © 2011 SciRes. EPE 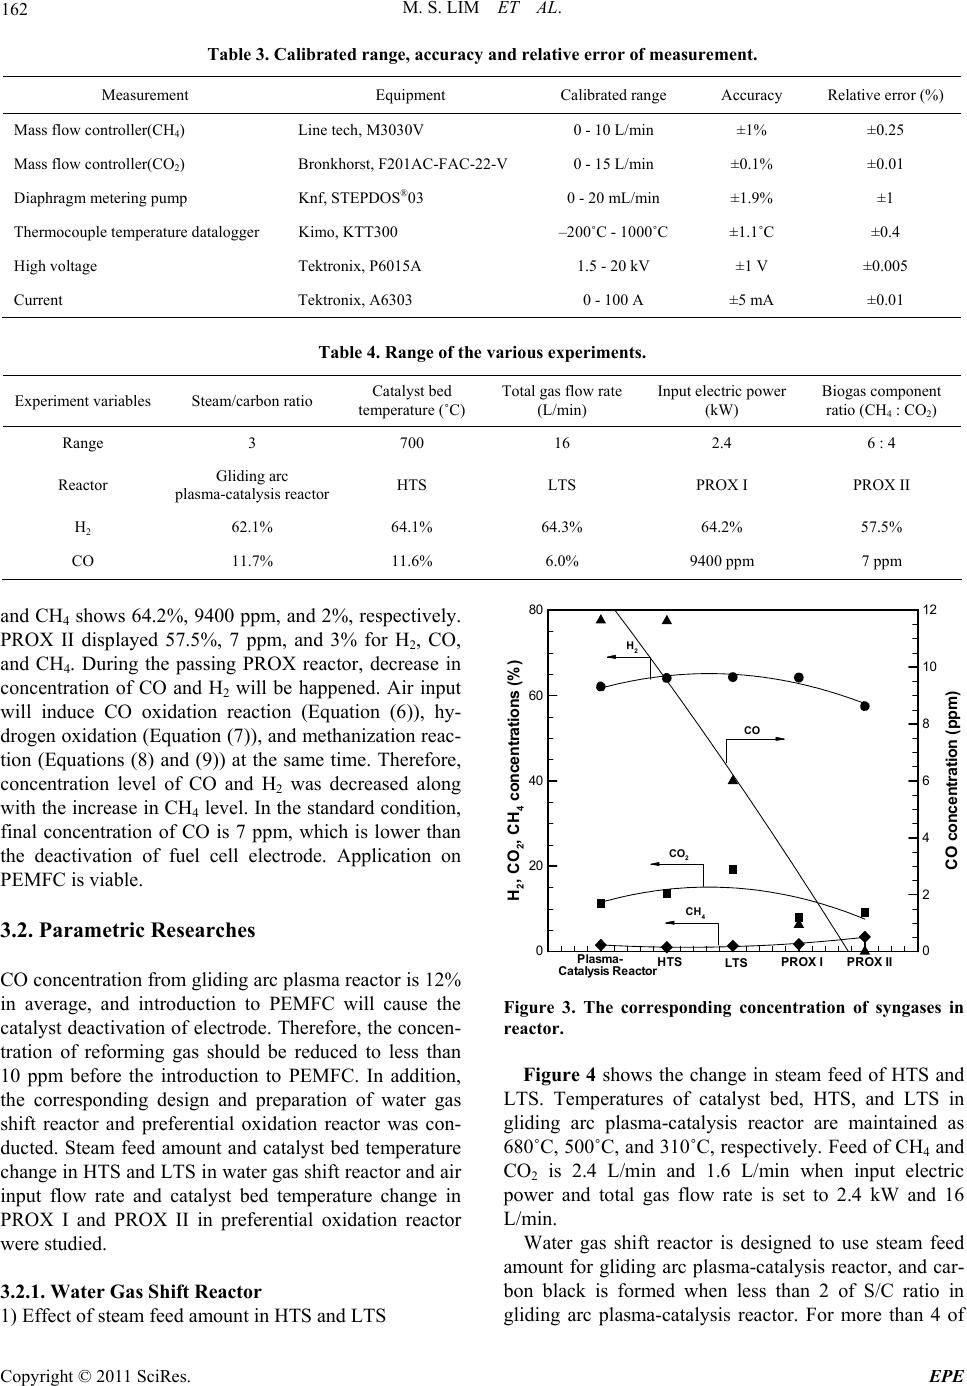 M. S. LIM ET AL. Copyright © 2011 SciRes. EPE 162 Table 3. Calibrated range, accuracy and relative error of measurement. Measurement Equipment Calibrated range Accuracy Relative error (%) Mass flow controller(CH4) Line tech, M3030V 0 - 10 L/min ±1% ±0.25 Mass flow controller(CO2) Bronkhorst, F201AC-FAC-22-V 0 - 15 L/min ±0.1% ±0.01 Diaphragm metering pump Knf, STEPDOS®03 0 - 20 mL/min ±1.9% ±1 Thermocouple temperature datalogger Kimo, KTT300 –200˚C - 1000˚C ±1.1˚C ±0.4 High voltage Tektronix, P6015A 1.5 - 20 kV ±1 V ±0.005 Current Tektronix, A6303 0 - 100 A ±5 mA ±0.01 Table 4. Range of the various experiments. Experiment variables Steam/carbon ratio Catalyst bed temperature (˚C) Total gas flow rate (L/min) Input electric power (kW) Biogas component ratio (CH4 : CO2) Range 3 700 16 2.4 6 : 4 Reactor Gliding arc plasma-catalysis reactor HTS LTS PROX I PROX II H2 62.1% 64.1% 64.3% 64.2% 57.5% CO 11.7% 11.6% 6.0% 9400 ppm 7 ppm H2,CO 2,CH 4concentrations(%) CO concentration(ppm) 0 20 40 60 80 0 2 4 6 8 10 12 H2 CO CO2 CH4 Plasma- Catalysis ReactorHTS LTS PROX IPROXII and CH4 shows 64.2%, 9400 ppm, and 2%, respectively. PROX II displayed 57.5%, 7 ppm, and 3% for H2, CO, and CH4. During the passing PROX reactor, decrease in concentration of CO and H2 will be happened. Air input will induce CO oxidation reaction (Equation (6)), hy- drogen oxidation (Equation (7)), and methanization reac- tion (Equations (8) and (9)) at the same time. Therefore, concentration level of CO and H2 was decreased along with the increase in CH4 level. In the standard condition, final concentration of CO is 7 ppm, which is lower than the deactivation of fuel cell electrode. Application on PEMFC is viable. 3.2. Parametric Researches CO concentration from gliding arc plasma reactor is 12% in average, and introduction to PEMFC will cause the catalyst deactivation of electrode. Therefore, the concen- tration of reforming gas should be reduced to less than 10 ppm before the introduction to PEMFC. In addition, the corresponding design and preparation of water gas shift reactor and preferential oxidation reactor was con- ducted. Steam feed amount and catalyst bed temperature change in HTS and LTS in water gas shift reactor and air input flow rate and catalyst bed temperature change in PROX I and PROX II in preferential oxidation reactor were studied. Figure 3. The corresponding concentration of syngases in reactor. Figure 4 shows the change in steam feed of HTS and LTS. Temperatures of catalyst bed, HTS, and LTS in gliding arc plasma-catalysis reactor are maintained as 680˚C, 500˚C, and 310˚C, respectively. Feed of CH4 and CO2 is 2.4 L/min and 1.6 L/min when input electric power and total gas flow rate is set to 2.4 kW and 16 L/min. Water gas shift reactor is designed to use steam feed amount for gliding arc plasma-catalysis reactor, and car- bon black is formed when less than 2 of S/C ratio in gliding arc plasma-catalysis reactor. For more than 4 of 3.2.1. Water Gas Shift Reacto r 1) Effect of steam feed amount in HTS and LTS 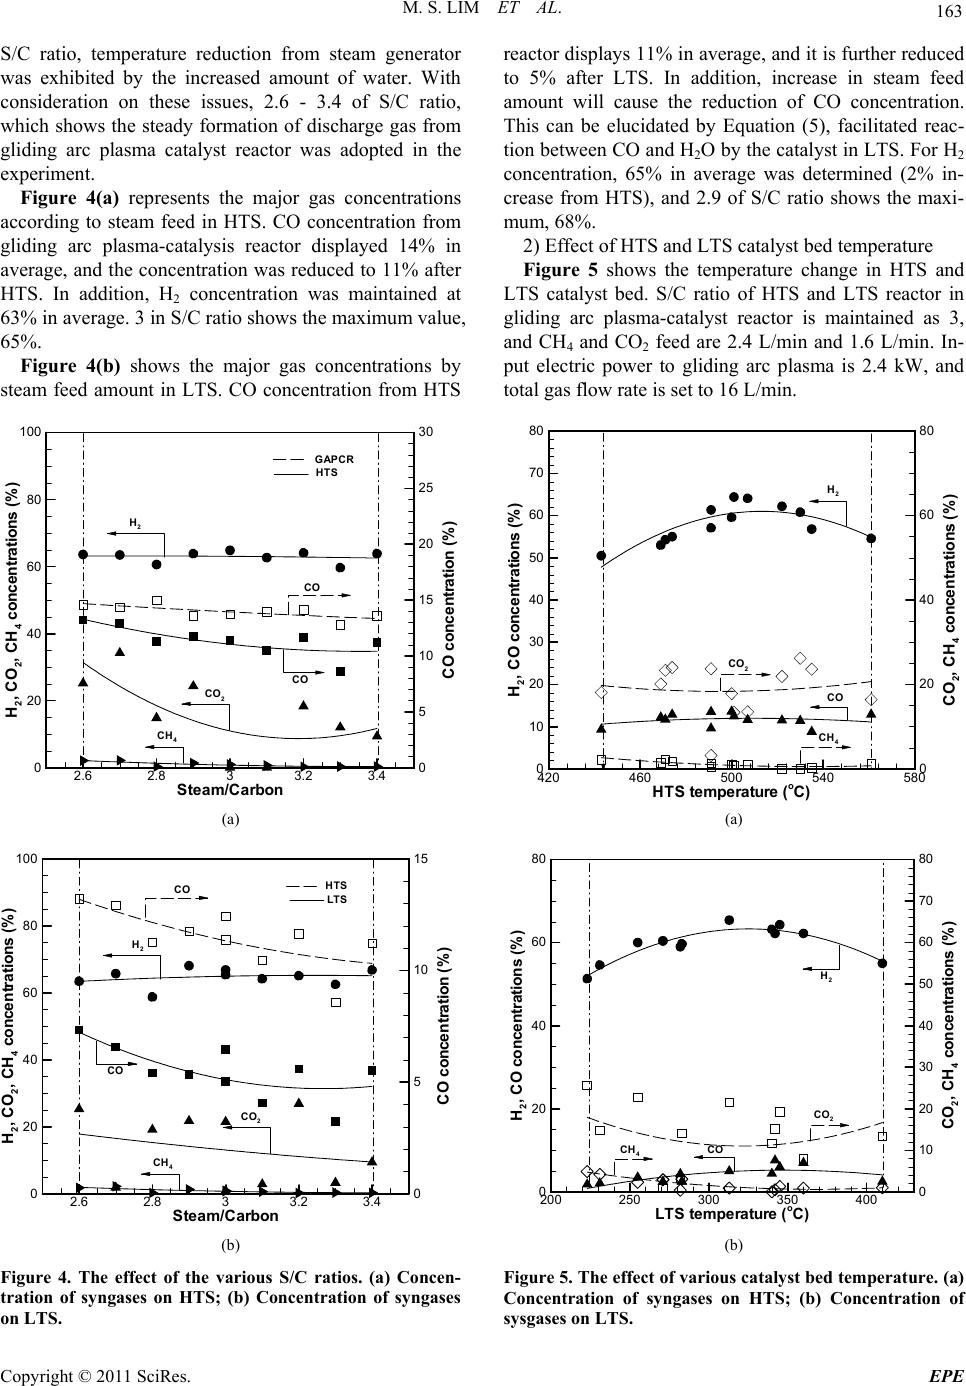 M. S. LIM ET AL. 163 S/C ratio, temperature reduction from steam generator was exhibited by the increased amount of water. With consideration on these issues, 2.6 - 3.4 of S/C ratio, which shows the steady formation of discharge gas from gliding arc plasma catalyst reactor was adopted in the experiment. Figure 4(a) represents the major gas concentrations according to steam feed in HTS. CO concentration from gliding arc plasma-catalysis reactor displayed 14% in average, and the concentration was reduced to 11% after HTS. In addition, H2 concentration was maintained at 63% in average. 3 in S/C ratio shows the maximum value, 65%. Figure 4(b) shows the major gas concentrations by steam feed amount in LTS. CO concentration from HTS Steam/Carbon H2,CO 2,CH 4concentrations (%) COconcentration (%) 2.62.833.23.4 0 20 40 60 80 100 0 5 10 15 20 25 30 H2 CO2 CH4 CO CO HTS GAPCR (a) Steam/Carbon H2,CO 2,CH 4concentrations(%) CO concentration(%) 2.62.833.23.4 0 20 40 60 80 100 0 5 10 15 H2 CO2 CH4 CO CO HTS LTS (b) Figure 4. The effect of the various S/C ratios. (a) Concen- tration of syngases on HTS; (b) Concentration of syngases on LTS. reactor displays 11% in average, and it is further reduced to 5% after LTS. In addition, increase in steam feed amount will cause the reduction of CO concentration. This can be elucidated by Equation (5), facilitated reac- tion between CO and H2O by the catalyst in LTS. For H2 concentration, 65% in average was determined (2% in- crease from HTS), and 2.9 of S/C ratio shows the maxi- mum, 68%. 2) Effect of HTS and LTS catalyst bed temperature Figure 5 shows the temperature change in HTS and LTS catalyst bed. S/C ratio of HTS and LTS reactor in gliding arc plasma-catalyst reactor is maintained as 3, and CH4 and CO2 feed are 2.4 L/min and 1.6 L/min. In- put electric power to gliding arc plasma is 2.4 kW, and total gas flow rate is set to 16 L/min. HTStemperature (oC) H2, CO concentrations (%) CO2,CH 4concentrations (%) 420 460 500 540 580 0 10 20 30 40 50 60 70 80 0 20 40 60 80 CH4 H2 CO2 CO (a) LTS temperature(oC) H2, COconcentrations (%) CO2,CH 4concentrations (%) 200 250 300 350 400 0 20 40 60 80 0 10 20 30 40 50 60 70 80 CH4 CO2 H2 CO (b) Figure 5. The effect of various catalyst bed temperature. (a) Concentration of syngases on HTS; (b) Concentration of sysgases on LTS. Copyright © 2011 SciRes. EPE 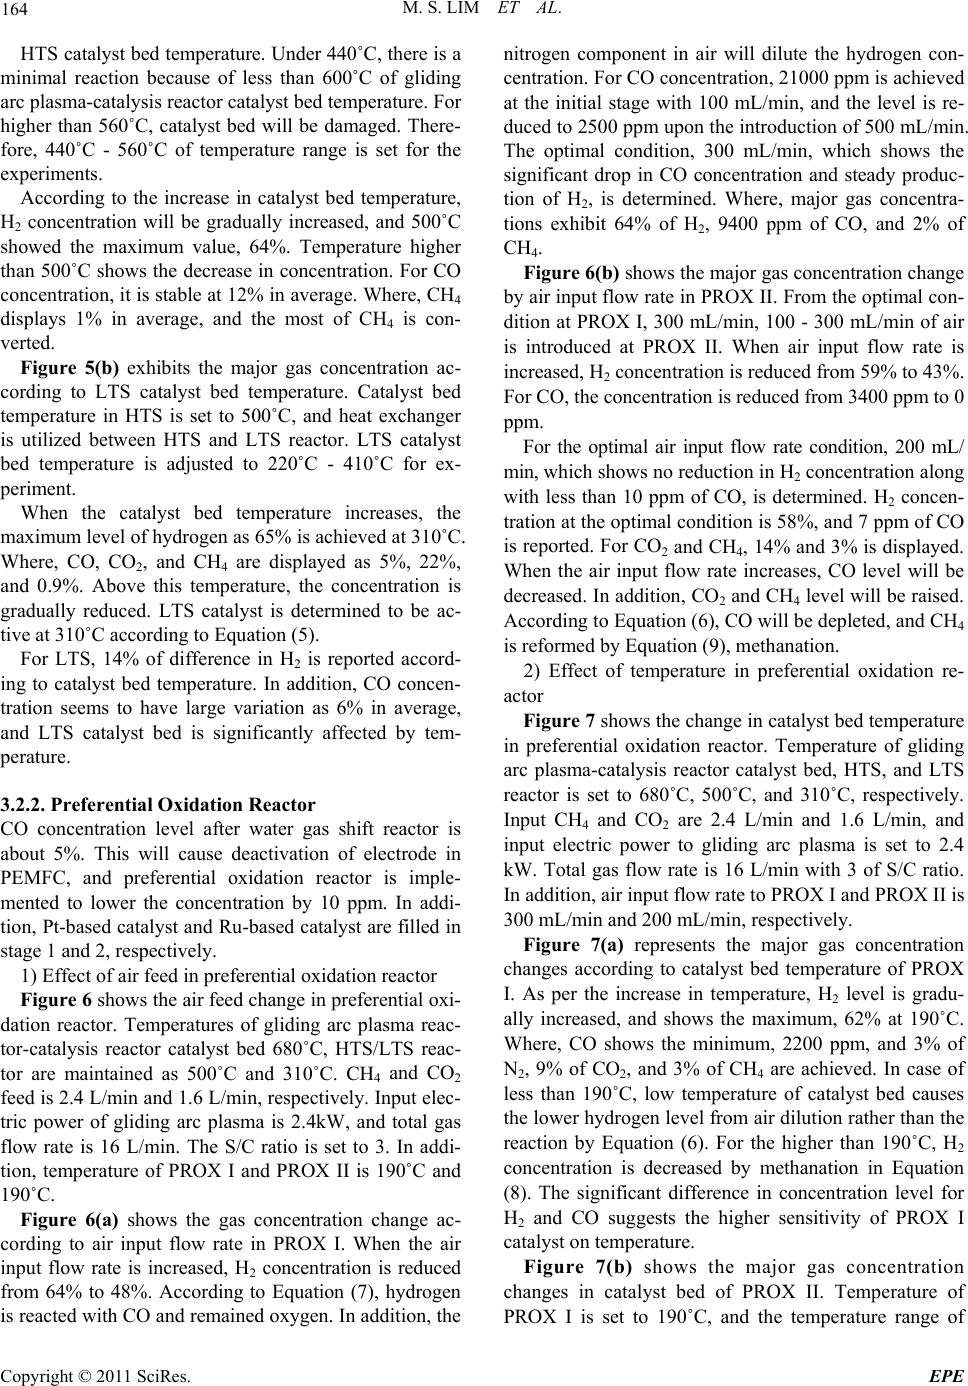 164 M. S. LIM ET AL. HTS catalyst bed temperature. Under 440˚C, there is a minimal reaction because of less than 600˚C of gliding arc plasma-catalysis reactor catalyst bed temperature. For higher than 560˚C, catalyst bed will be damaged. There- fore, 440˚C - 560˚C of temperature range is set for the experiments. According to the increase in catalyst bed temperature, H2 concentration will be gradually increased, and 500˚C showed the maximum value, 64%. Temperature higher than 500˚C shows the decrease in concentration. For CO concentration, it is stable at 12% in average. Where, CH4 displays 1% in average, and the most of CH4 is con- verted. Figure 5(b) exhibits the major gas concentration ac- cording to LTS catalyst bed temperature. Catalyst bed temperature in HTS is set to 500˚C, and heat exchanger is utilized between HTS and LTS reactor. LTS catalyst bed temperature is adjusted to 220˚C - 410˚C for ex- periment. When the catalyst bed temperature increases, the maximum level of hydrogen as 65% is achieved at 310˚C. Where, CO, CO2, and CH4 are displayed as 5%, 22%, and 0.9%. Above this temperature, the concentration is gradually reduced. LTS catalyst is determined to be ac- tive at 310˚C according to Equation (5). For LTS, 14% of difference in H2 is reported accord- ing to catalyst bed temperature. In addition, CO concen- tration seems to have large variation as 6% in average, and LTS catalyst bed is significantly affected by tem- perature. 3.2.2. Prefere nti al Oxi dation Reactor CO concentration level after water gas shift reactor is about 5%. This will cause deactivation of electrode in PEMFC, and preferential oxidation reactor is imple- mented to lower the concentration by 10 ppm. In addi- tion, Pt-based catalyst and Ru-based catalyst are filled in stage 1 and 2, respectively. 1) Effect of air feed in preferential oxidation reactor Figure 6 shows the air feed change in preferential oxi- dation reactor. Temperatures of gliding arc plasma reac- tor-catalysis reactor catalyst bed 680˚C, HTS/LTS reac- tor are maintained as 500˚C and 310˚C. CH4 and CO2 feed is 2.4 L/min and 1.6 L/min, respectively. Input elec- tric power of gliding arc plasma is 2.4kW, and total gas flow rate is 16 L/min. The S/C ratio is set to 3. In addi- tion, temperature of PROX I and PROX II is 190˚C and 190˚C. Figure 6(a) shows the gas concentration change ac- cording to air input flow rate in PROX I. When the air input flow rate is increased, H2 concentration is reduced from 64% to 48%. According to Equation (7), hydrogen is reacted with CO and remained oxygen. In addition, the nitrogen component in air will dilute the hydrogen con- centration. For CO concentration, 21000 ppm is achieved at the initial stage with 100 mL/min, and the level is re- duced to 2500 ppm upon the introduction of 500 mL/min. The optimal condition, 300 mL/min, which shows the significant drop in CO concentration and steady produc- tion of H2, is determined. Where, major gas concentra- tions exhibit 64% of H2, 9400 ppm of CO, and 2% of CH4. Figure 6(b) shows the major gas concentration change by air input flow rate in PROX II. From the optimal con- dition at PROX I, 300 mL/min, 100 - 300 mL/min of air is introduced at PROX II. When air input flow rate is increased, H2 concentration is reduced from 59% to 43%. For CO, the concentration is reduced from 3400 ppm to 0 ppm. For the optimal air input flow rate condition, 200 mL/ min, which shows no reduction in H2 concentration along with less than 10 ppm of CO, is determined. H2 concen- tration at the optimal condition is 58%, and 7 ppm of CO is reported. For CO2 and CH4, 14% and 3% is displayed. When the air input flow rate increases, CO level will be decreased. In addition, CO2 and CH4 level will be raised. According to Equation (6), CO will be depleted, and CH4 is reformed by Equation (9), methanation. 2) Effect of temperature in preferential oxidation re- actor Figure 7 shows the change in catalyst bed temperature in preferential oxidation reactor. Temperature of gliding arc plasma-catalysis reactor catalyst bed, HTS, and LTS reactor is set to 680˚C, 500˚C, and 310˚C, respectively. Input CH4 and CO2 are 2.4 L/min and 1.6 L/min, and input electric power to gliding arc plasma is set to 2.4 kW. Total gas flow rate is 16 L/min with 3 of S/C ratio. In addition, air input flow rate to PROX I and PROX II is 300 mL/min and 200 mL/min, respectively. Figure 7(a) represents the major gas concentration changes according to catalyst bed temperature of PROX I. As per the increase in temperature, H2 level is gradu- ally increased, and shows the maximum, 62% at 190˚C. Where, CO shows the minimum, 2200 ppm, and 3% of N2, 9% of CO2, and 3% of CH4 are achieved. In case of less than 190˚C, low temperature of catalyst bed causes the lower hydrogen level from air dilution rather than the reaction by Equation (6). For the higher than 190˚C, H2 concentration is decreased by methanation in Equation (8). The significant difference in concentration level for H2 and CO suggests the higher sensitivity of PROX I catalyst on temperature. Figure 7(b) shows the major gas concentration changes in catalyst bed of PROX II. Temperature of PROX I is set to 190˚C, and the temperature range of Copyright © 2011 SciRes. EPE 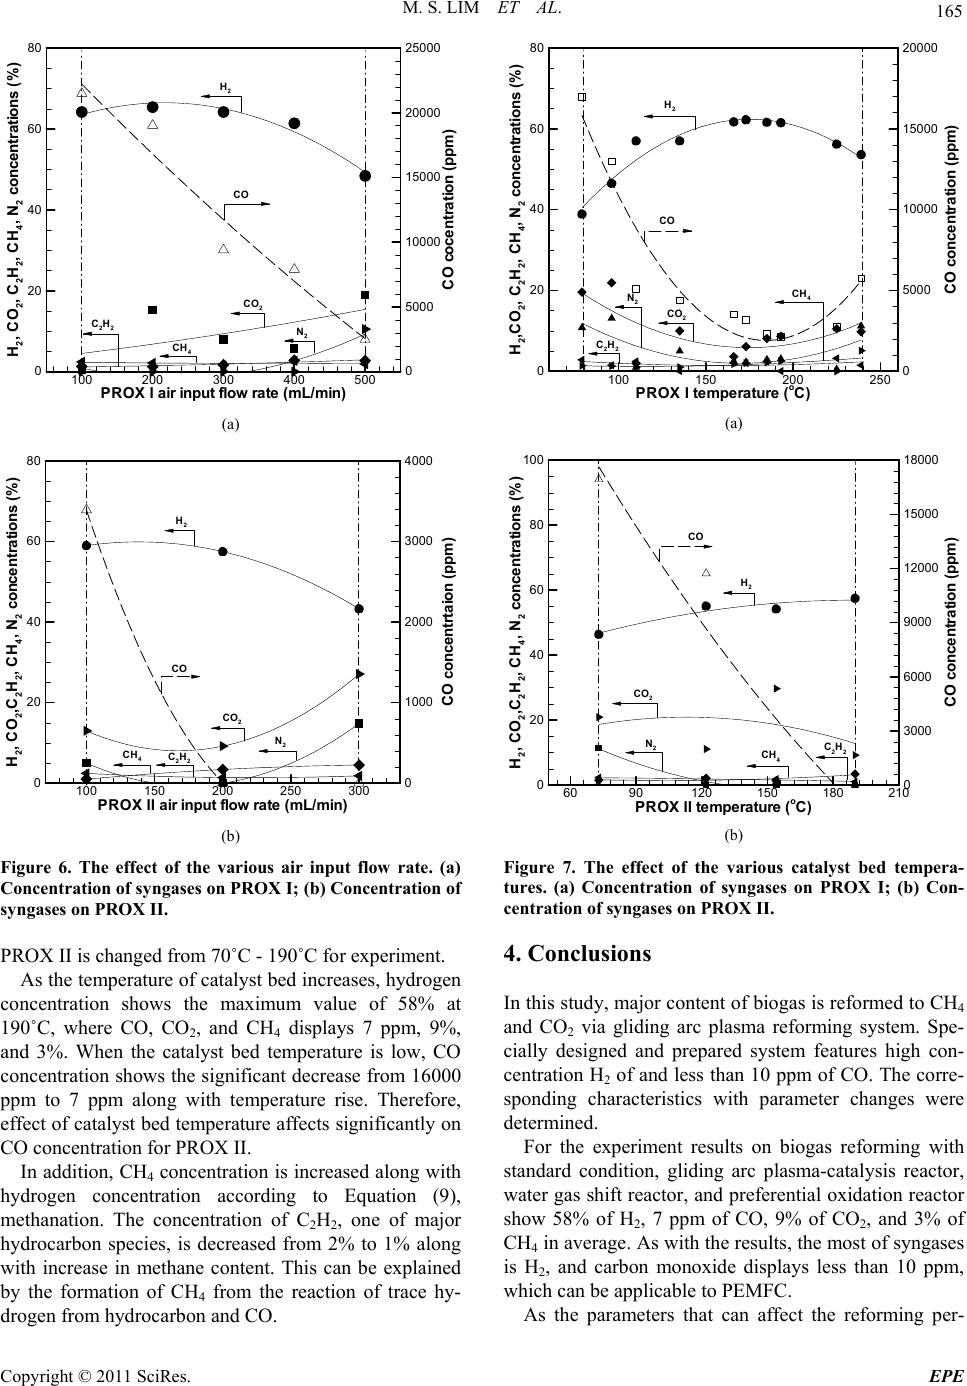 M. S. LIM ET AL. 165 PROXI air input flow rate(mL/min) H2,CO 2,C 2H2,CH 4,N 2concentrations(%) COcocentration (ppm) 100 200 300 400 500 0 20 40 60 80 0 5000 10000 15000 20000 25000 H2 CO CO2 CH4 N2 C2H2 (a) PROXII air inputflow rate (mL/min) H2,CO 2,C2H2,CH 4,N 2concentrations (%) CO concentrtaion(ppm) 100 150 200 250 300 0 20 40 60 80 0 1000 2000 3000 4000 H2 CO CO2 N2 CH4C2H2 (b) Figure 6. The effect of the various air input flow rate. (a) Concentration of syngases on PROX I; (b) Concentration of syngases on PROX II. PROX II is changed from 70˚C - 190˚C for experiment. As the temperature of catalyst bed increases, hydrogen concentration shows the maximum value of 58% at 190˚C, where CO, CO2, and CH4 displays 7 ppm, 9%, and 3%. When the catalyst bed temperature is low, CO concentration shows the significant decrease from 16000 ppm to 7 ppm along with temperature rise. Therefore, effect of catalyst bed temperature affects significantly on CO concentration for PROX II. In addition, CH4 concentration is increased along with hydrogen concentration according to Equation (9), methanation. The concentration of C2H2, one of major hydrocarbon species, is decreased from 2% to 1% along with increase in methane content. This can be explained by the formation of CH4 from the reaction of trace hy- drogen from hydrocarbon and CO. PROX I temperature (oC) H2,CO2,C 2H2,CH 4,N 2concentrations(%) CO concentration(ppm) 100 150 200 250 0 20 40 60 80 0 5000 10000 15000 20000 H2 CO CH4 CO2 N2 C2H2 (a) PROX II temperature(oC) H2,CO 2,C2H2,CH 4,N 2concentrations (%) COconcentration (ppm) 6090120 150 180 210 0 20 40 60 80 100 0 3000 6000 9000 12000 15000 18000 CO H2 CO2 CH4 N2C2H2 (b) Figure 7. The effect of the various catalyst bed tempera- tures. (a) Concentration of syngases on PROX I; (b) Con- centration of syngases on PROX II. 4. Conclusions In this study, major content of biogas is reformed to CH4 and CO2 via gliding arc plasma reforming system. Spe- cially designed and prepared system features high con- centration H2 of and less than 10 ppm of CO. The corre- sponding characteristics with parameter changes were determined. For the experiment results on biogas reforming with standard condition, gliding arc plasma-catalysis reactor, water gas shift reactor, and preferential oxidation reactor show 58% of H2, 7 ppm of CO, 9% of CO2, and 3% of CH4 in average. As with the results, the most of syngases is H2, and carbon monoxide displays less than 10 ppm, which can be applicable to PEMFC. As the parameters that can affect the reforming per- Copyright © 2011 SciRes. EPE  M. S. LIM ET AL. Copyright © 2011 SciRes. EPE 166 formance, the steam feed amount in HTS and LTS reac- tor exhibits the optimal condition with 3 in S/C ratio. Reduction of CO concentration is 3% in average for HTS, and is further decreased to 6% after LTS reactor. Hydro- gen concentration is increased to 1% after HTS and 3% in LTS. Effect of catalyst bed temperature in HTS and LTS exhibits the maximum point in H2 concentration as the increase in temperature. With 500˚C in HTS and 310˚C in LTS, the maximum production of H2 and low concen- tration of CO can be achieved. Catalyst bed temperature significantly affects on reforming performance. For the air input flow rate to preferential oxidation re- actor, 300 mL/min and 200 mL/min of PROX I and II is the optimal condition, which displays the minimum drop of H2 concentration and low CO content. According to catalyst bed temperature in preferential oxidation reactor, 190˚C of PROX I and PROX II show the optimal condition, and the temperature change affects significantly on hydrogen and CO concentration. 5. References [1] P. Kolbitsch, C. Pfeifer and H. Hofbauer, “Catalytic Steam Reforming of Model Biogas,” Fuel, Vol. 87, No. 6, 2008, pp. 701-706. doi:10.1016/j.fuel.2007.06.002 [2] S. T. Lin, Y. H. Chen, C. C. Yu, Y. C. Liu and C. H. Lee, “Modelling an Experimental Methane Fuel Processor,” Journal of Power Sources, Vol. 148, 2005, pp. 43-53. doi:10.1016/j.jpowsour.2005.01.035 [3] A. Jhalani and L. D. Schmidt, “Preferential CO Oxidation in the Presence of H2, H2O, and CO2 at Short Con- tact-Time,” Catalysis Letters, Vol. 104, No. 3-4, 2005, pp. 103-109. doi:10.1007/s10562-005-7937-9 [4] Y. N. Chun and H. O. Song, “Syngas Production Using Gliding Arc Plasma,” Energy Sources, Vol. 30, No. 13, 2008, pp. 1202-1212. doi:10.1080/15567030600817670 [5] T. Sreethawong, P. Thakonpatthanakun and S. Chavadej, “Partial Oxidation of Methane with Air for Synthesis Gas Production in a Multistage Gliding Arc Discharge Sys- tem,” International Journal of Hydrogen Energy, Vol. 32, No. 8, 2007, pp. 1067-1079. doi:10.1016/j.ijhydene.2006.07.013 [6] A. Effendi, K. Hellgard, Z. G. Zhang and T. Yoshida, “Optimising H2 Production from Model Biogas via Com- bined Steam Reforming and CO Shift Reactions,” Fuel, No. 84, No. 7-8, 2005, pp. 869-874. doi:10.1016/j.fuel.2004.12.011 [7] Y. N. Chun and S. C. Kim, “Production of Hydro- gen-Rich Gas from Methane by Thermal Plasma Re- form,” Journal of the Air & Waste management Associa- tion, Vol. 57, No. 12, 2007, pp. 1447-1451. doi:10.3155/1047-3289.57.12.1447 [8] J. D. Holladay, J. Hu, D. L. King and Y. Wang, “An Overview of Hydrogen Production Technologies,” Ca- talysis Today, Vol. 139, No. 4, 2009, pp. 244-260. doi:10.1016/j.cattod.2008.08.039 [9] S. Srinivas, A. Dhingra, H. Im and E. Gulari, “A Scalable Silicon Microreactor for Preferential CO Oxidation Per- formance Comparison with a Tubular Packed-Bed Mi- croreactor,” Applied Catalysis A: General, Vol. 274, No. 1-2, 2004, pp. 285-293. doi:10.1016/j.apcata.2004.07.012 [10] Z. G. Zhang, G. Xu, X. Chen, K. Honda and T. Yoshida, “Process Development of Hydrogenous Gas Production for PEFC from Biogas,” Fuel Processing Technology, Vol. 85, No. 8-10, 2004, pp. 1213-1229. doi:10.1016/j.fuproc.2003.10.017
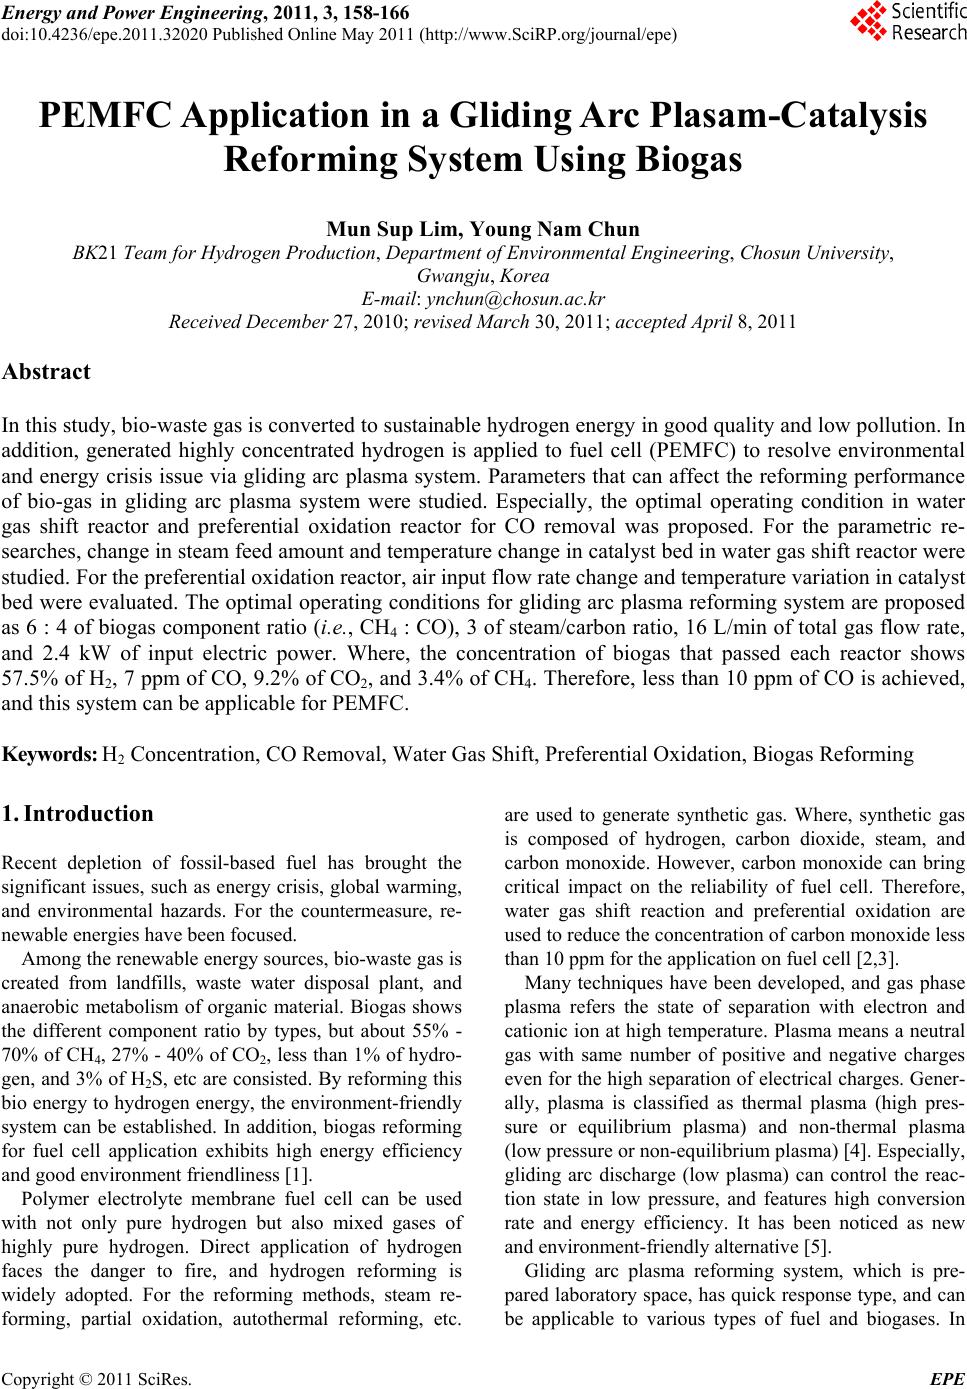
|