 Open Journal of Social Sciences, 2014, 2, 204-212 Published Online September 2014 in SciRes. http://www.scirp.org/journal/jss http://dx.doi.org/10.4236/jss.2014.29035 How to cite this paper: Shen, G.C. and Jia, W.Y. (2014) The Prediction Model of Financial Crisis Based on the Combination of Principle Component Analysis and Support Vector Machine. Open Journal of Social Sciences, 2, 204-212. http://dx.doi.org/10.4236/jss.2014.29035 The Prediction Model of Financial Crisis Based on the Combination of Principle Component Analysis and Support Vector Machine Guicheng Shen, Weiying Jia School of Information, Beijing Wuzi University , Beijing, China Email: guichengshen@126.com Received July 2014 Abstract This paper studies financial crisis of listed companies in China Manufacture Industry, and selects 181 companies with financial crisis and 181 normal companies as its research samples, and its research is based on financial indexes three years before the financial crisis happens. Firstly the method of principle component analysis is used to abstract useful information from the training data. Secondly a prediction model of financial crisis is constructed with the method of Support Vector Machine and the accuracy of the model is 78.73% on the training data and the 79.79% on the testing data. Thirdly the advantages of this model are discussed over the other prediction models. Finally the research results show that this model uses the least number of input variables and has the highest prediction accuracy, thus this model can provide the useful information to in- vestors, creditors, financial regulators and etc. Keywords Financial Crisis, Principal Component Analysis, Support Vector Machine, Kernel Function, Prediction Precision 1. Introduction As the rapid development of economy globalization, the environment the enterprises are facing with is becom- ing more complicated, and Financial Crisis often reduces the enterprises to financial distress, and even bankrupt. Therefore, financial risk management has been becoming more important, and financial crisis warning is be- coming the research focus. Accurate prediction and financial crisis analysis are not only the objective require- ment of market competition, but the necessary condition of sustainable development for enterprises. The finan- cial crisis does not take place abruptly and it evolves gradually. Therefore, it can be predicted. What is more, it is very important for government department to predict the financial crisis of enterprises correctly because it can monitor the enterprises’ quality and the risk of s ecu ri ties market, and safeguard the interest of inventors and  G. C. Shen, W. Y. Jia creditors. This paper has five parts, and the second part reviews the related literatures of financial crisis warning, and the third one introduces the prediction model of financial crisis based on the combination of principal compo- nent analysis and support vector machine, and the fourth one describes the modeling and the discussion, and the fifth one gives out the conclusion of this paper. 2. Related Works In thirties of twentieth cent ur y, many researchers had done research works on the prediction model of financial crisis. [1] did pioneering research on univariate model. He selected 19 companies as his samples, and compared and analyzed the financial indexes of healthy companies and companies in financial crisis, and he found that the variables, whose discriminant ability are used to describe the financial crisis, were two ratios, where the first one was net profit divided by stockholders’ equity and the second one was stockholders’ equity divided by liabilities. [2] proposed one more mature univariate model. He randomly selected 79 successful companies and 79 unsuc- cessful companies to predicate the financial crisis based on univariate model. He found that the predication abil- ity of the ratio of cash flow divided by gross liabilities is the strongest, and the second one was asset-liability ra- tio. As univariate model only uses individual ratio to predicate financial crisis, its advantage of univariate model is simple and practical. But production activities and operating activities of enterprises are influenced by many factors, therefore we might get contradictory results when we use different financial index to predicate. Thus the univariate model has been replaced by multivariable model. [3] used Multivariable Discriminative Model (MDM) to study the warning for company financial crisis. He selected 33 bankruptcy companies and 33 non-bankruptcy companies to build Z-Score model. The application of multivariable model is very easy, but the prerequisite for the model is that the independent variables presented normal distribution and the covariance of two sample group is equal, and actual sample data do not meet this requirement, therefore the application range of multivariable model is confined. [4] built a financial crisis prediction model with the method of Logistic Regression, and found that company size, capital structure, per formance and current cash ability have remarkable prediction ability. Logistic Regres- sion Model (LRM) is built on the base of cumulative probability functions, and it did not require that indepen- dent variables follow multivariable normal distribution, and overcame the limitation that linear equations were subject to statistical hypothesis. But LRM is sensitive to multicollinearity, and when the correlation among ex- planatory variables is very high, the minor change of samples will bring about the maximu m change of co eff i- cient estimation, thus it will reduce LRM prediction effect. With the development of Artificial Intelligence (AI), the algorithms with the ability to learn and reason have been used in financial crisis prediction, and some satisfactory results have been achieved. [5] introduced Neural Networks Algorithm (NNA) into financial crisis prediction, and selected five Altman financial crisis, and proved that the discrimination accuracy of NNA was higher than one of MDM. But Neural Networks Method is built on the experiential risk minimization principle, and during the period the algorithm runs, it might be trapped in lo- cal min imu m, therefore the global optimal solution might not be found. By the way NNM is likely to over fit the training data. Support Vector Machine (SVM) is proposed after neural network method and it is based on Structure Risk Minimization, and it overcame the two disadvantages, and the first one is slow convergence rate of gradient descent method and the second one is that it might be trapped in local mini mu m . In its application, SVM shows good performance. [6] used SVM method to predict financial crisis, and he found that SVM was better than NN, multivariable discriminative analysis and Logistics Regression Method. Research on Financial Crisis starts later in China, and foreign methods are used to construct Chinese warning model. [7] firstly introduced analysis indexes and warning model about business failures in China, and used sta- tistics methods to do quantitative analysis. [8] used 62 companies in the accounting database Compustat PC Plus from 1977 to 1990 to construct F fraction model. [9] selected 27 ST companies and 27 Non-ST companies in 1998, and used the finance report data from1995 to 1997, and did univariant analysis and multivariate linear discrimination analysis. [10] used three methods of Fisher linear discrimination, multivariate linear regression, and Logistic Regression, and constructed three prediction models of financial crisis, and examined the predic- tion accuracy before financial crisis took place. [11] selected cross-section financial indexes of 120 Listed Companies as their modeling samples and 60 companies as their test samples of the same year, and constructed 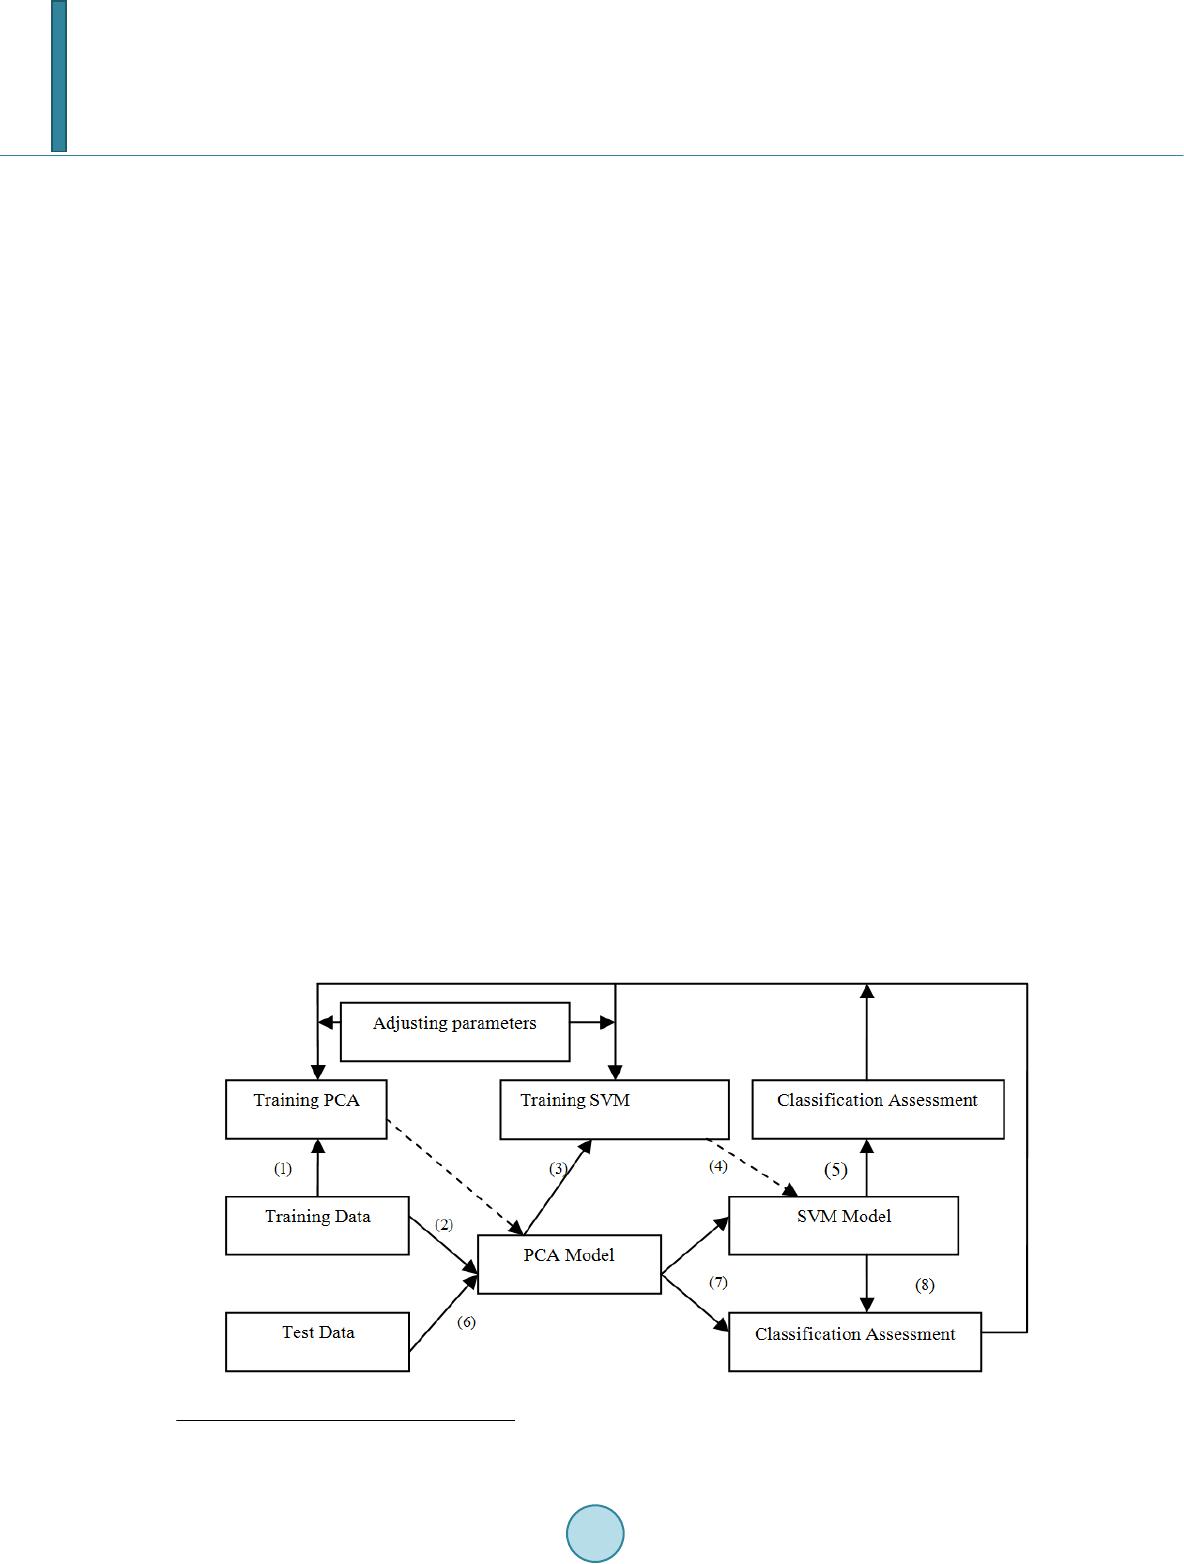 G. C. Shen, W. Y. Jia warning model of financial crisis with the tool of BP ANN. [12] proposed a new prediction method of non-linear combination based on BP ANN, but to remove the influence of spanning two years, he constructed warning model based on the data two years in advance, and his result was similar to the result of Shue Yang. Based on these research works, we can find three characteristics. When researchers use SVM model to predi- cate financial crisis, they focus on the selection of kernel function and financial index, and few researchers use Principal Component Analysis (PCA) method to extract useful information from financial indexes, and input this information into SVM; As study year is so long ago and samples are very few from many industries, all these may influence correct interpretation on predication accuracy and discriminative results; As Chinese re- searchers use Special Treatment (ST) companies1 and normal companies to do research and they use the annual reports two years before the companies were specially treated, the prediction ability might be exagger at ed. This paper uses the combination of principal component analysis (PCA) and Support Vector Machine (SVM) to predict financial crisis. We use PCA to extract several factors that play important roles to financial crisis, and these factors are used to train SVM model, and the trained model is tested on 94 samples. The final factor num- ber is five, and the kernel function is polynomial, and the prediction accuracy of the combination model is 79.79% three years before one company becomes ST Company. 3. The Warning Model Based on PCA and SVM [13] proposed SVM theory to solve pattern recognition. The core of this theory is to find a hyper plane to sepa- rate sample data, and different class of samples locates at different side of the plane. [14] proposed a new me- thod to reconstruct the kernel space by using the inequality constraint, and solved partially the problem of li- nearly inseparable problem, and this opens up a way to the application of SVM. Grace, Boser and Vapnik, etc. (1990) did research work on SVM technologies, and gained some breakthroughs. [15] proposed the statistics learning theory, and well solved linearly inseparable problem, and formally laid the foundation for SVM theory. Although several papers have used SVM to predict financial crisis, we do not find the paper which combines PCA and SVM to predict financial crisis yet. As there is some linear dependence among input variables (para- meters) to some degree, using the original variables may influence the classification effete n ess . Thus we use PCA to abstract the components which are not linearly related, and input these components into SVM. This flow is displayed in Figure 1. Financial crisis prediction model combining PCA and SVM is formed based on the previous flow design. The algorithm is displayed as follows. 1) According to the index architecture of financial crisis warning, we process the training data, and set PCA parameters, and get PCA model. Figure 1. Financial crisis prediction model combining PCA and SVM. 1 The companies are with two consecutive annual losses or their NVPS (net asset value per share) is lower than the par value of stock.  G. C. Shen, W. Y. Jia 2) We input the training data into PCA model and get the transformed data, and the parameter number is less than the original number, and these parameters have less liner dependence. 3) We input the transformed data into SVM model, set the parameters, and get SVM model. 4) We use SVM model to test the transformed data, and assess the classification results. 5) Based on the assessment, we adjust the parameters of PCA and SVM. 6) We input the test data into PCA model, and get the abstracted data. 7) We input these abstracted data into SVM model, and assess the classification result. 8) Based on the assessment, we adjust the parameters of PCA and SVM. The stop condition of this model is that classification accuracies on training data and test data arrive at a bal- ance. That means two accuracies are almost equal. 4. Empirical Researches 4.1. Selection of Samples and Warning Index As China has put ST regulation into practice, most researchers use ST as the standard of financial crisis, we have selected ST listed manufacturing companies on Shenzhen stock market and Shanghai stock market from 2001 to 2011, and rejected B stock companies and ST companies which have other abnormal conditions, and companies whose data is not complete or unreasonable. Thus we have got 181 ST companies in all, 13 companies in 2001, 21 companies in 2002, 27 companies in 2003, 13 companies in 2004, 14 companies in 2005, 20 companies in 2006, 25 companies in 2007, 9 companies in 2008, 12 companies in 2009, 17 companies in 2010, and 9 compa- nies in 2011. Corresponding with ST companies, we have selected 181 healthy companies based on the rules of the same industry, the same fiscal year, and similar asset size. Thus we have selected 382 listed companies, and 268 companies from 2001 to 2007 are used as training samples, and 94 companies from 2008 to 2011 are used as test samples. As China Securities Regulatory Commission (CSRC) judges whether the financial condition of a listed com- pany is abnormal based on operating performance in its annual report during two consecutive years, using the annual report two years before a company is specially treated may exaggerate the prediction ability of the model. Therefore, this paper uses ST companies three years before they are specially treated as research samples to judge whether these companies will have financial crisis. The selection of financial warning index has a very significant impact, and scientific index not only has better classification ability, but simplifies the prediction model. Many researchers use financial index to do empirical researches on financial crisis warning. Although different researchers may have different financial index, these financial index include basically solvency, profitability, and operation ability and etc. Based on important lite- ratures and predecessors’ researches on index architecture of financial crisis warning, and the availability and suitability of data, this paper selects 23 financial indexes from five aspects, and these aspects include solvency, profitability, and operation ability, growth ability, and the ability of obtaining cash. These indexes are displayed in Table 1. 4.2. Principal Component Analysis Whether the sample data are suitable for PCA can be examined with the method of KMO and Bartlett’s spher ic- ity test. The test result shows that KMO statistics (0.704) is more than 0.5, and Bartlett’s sphericity is 4941.569, and the significance (0.000) is less than 0.05. This shows that the correlative coefficient matrix has significant differences and these sample data are suitable for PCA. According to Table 2 about the eigenvalues and contribution rate of principal components, the fore seven ei- genvalues are more than 1, and accumulation contribution rates have reached 72.466%. Thus according to the standard that the eigenvalue is more than 1, these seven principal components are used to replace the original financial indexes. 4.3. Constructing SVM Mode l According to SVM, we need to input some parameters into SVM model. These parameters include the type of kernel function, penalty coefficient C, and etc. At the default condition (Kernel function is RBF and C is 10),  G. C. Shen, W. Y. Jia Table 1. Original financial indexes of financial crisis warning model. Index Code Index Name Index Computing Formula solvency Current ratio Current asset/Current liabilities Quick ratio (Current asset − Inventory)/Current liabilities Cash ratio (Ending balance of cash + Ending balance of cash equivalents)/Current liabilities Asset-liability ratio Total liabilities/General assets Net assets per share Net assets/Ending ordinary shares profitability Earnings per share Net profit/Ending ordinary shares Main business profitability Income from main operation/Prime operating revenue Net profit margin on sales Net profit/Prime operating revenue Net return on assets Net profit/Total average assets Return on equity Net profit /Ending Stockholder’s equity operation ability Accounts receivable turnover Income from main operation/Average account receivable 12 Inventory turnover ratio Main business cost/Average inventory Current asset turnover Income from main operation/Average current assets Total assets turnover Income from main operation/Total average assets growth ability Main business’s increasing rate of income Current main business income/Current main business income over the same period last year − 1 Main business profit growth Current main business profit/Current main business profit over the same period last year − 1 Total assets growth rate Ending total assets/Ending total assets over the same period last year − 1 Growth rate of net asset Closing net assets/Closing net assets over the same period last year −1 19 Net profit growth rate Net profit/Net profit over the same period last year −1 the ability cash Cash current liability ratio Net amount of operating cash flow/Current Liabilities Operating cash flow per share Net amount of operating cash flow/Ending ordinary shares Sales cash ratio Net amount of operating cash flow/Prime operating revenue Cash recovery for total assets Net amount of operating cash flow/Total average assets Table 2. The eigenvalues and contribution rate of principal components. Original Eigenvalues Extraction Sums of Squared Loadings Sum after the Orthogonal Rotation Total Variance % % Total Variance % Accumulation Total Variance % Accumulation% 1 5.385 23.415 23.415 5.385 23.415 23.415 3.917 17.032 17.032 2 3.324 14.452 37.868 3.324 14.452 37.868 3.249 14.126 31.158 3 2.887 12.553 50.420 2.887 12.553 50.420 3.083 13.405 44.563 4 1.651 7.180 57.600 1.651 7.180 57.600 1.985 8.632 53.195 5 1.352 5.876 63.476 1.352 5.876 63.476 1.913 8.318 61.514 6 1.055 4.585 68.061 1.055 4.585 68.061 1.466 6.376 67.890 7 1.013 4.404 72.466 1.013 4.404 72.466 1.053 4.576 72.466 8 Omitted 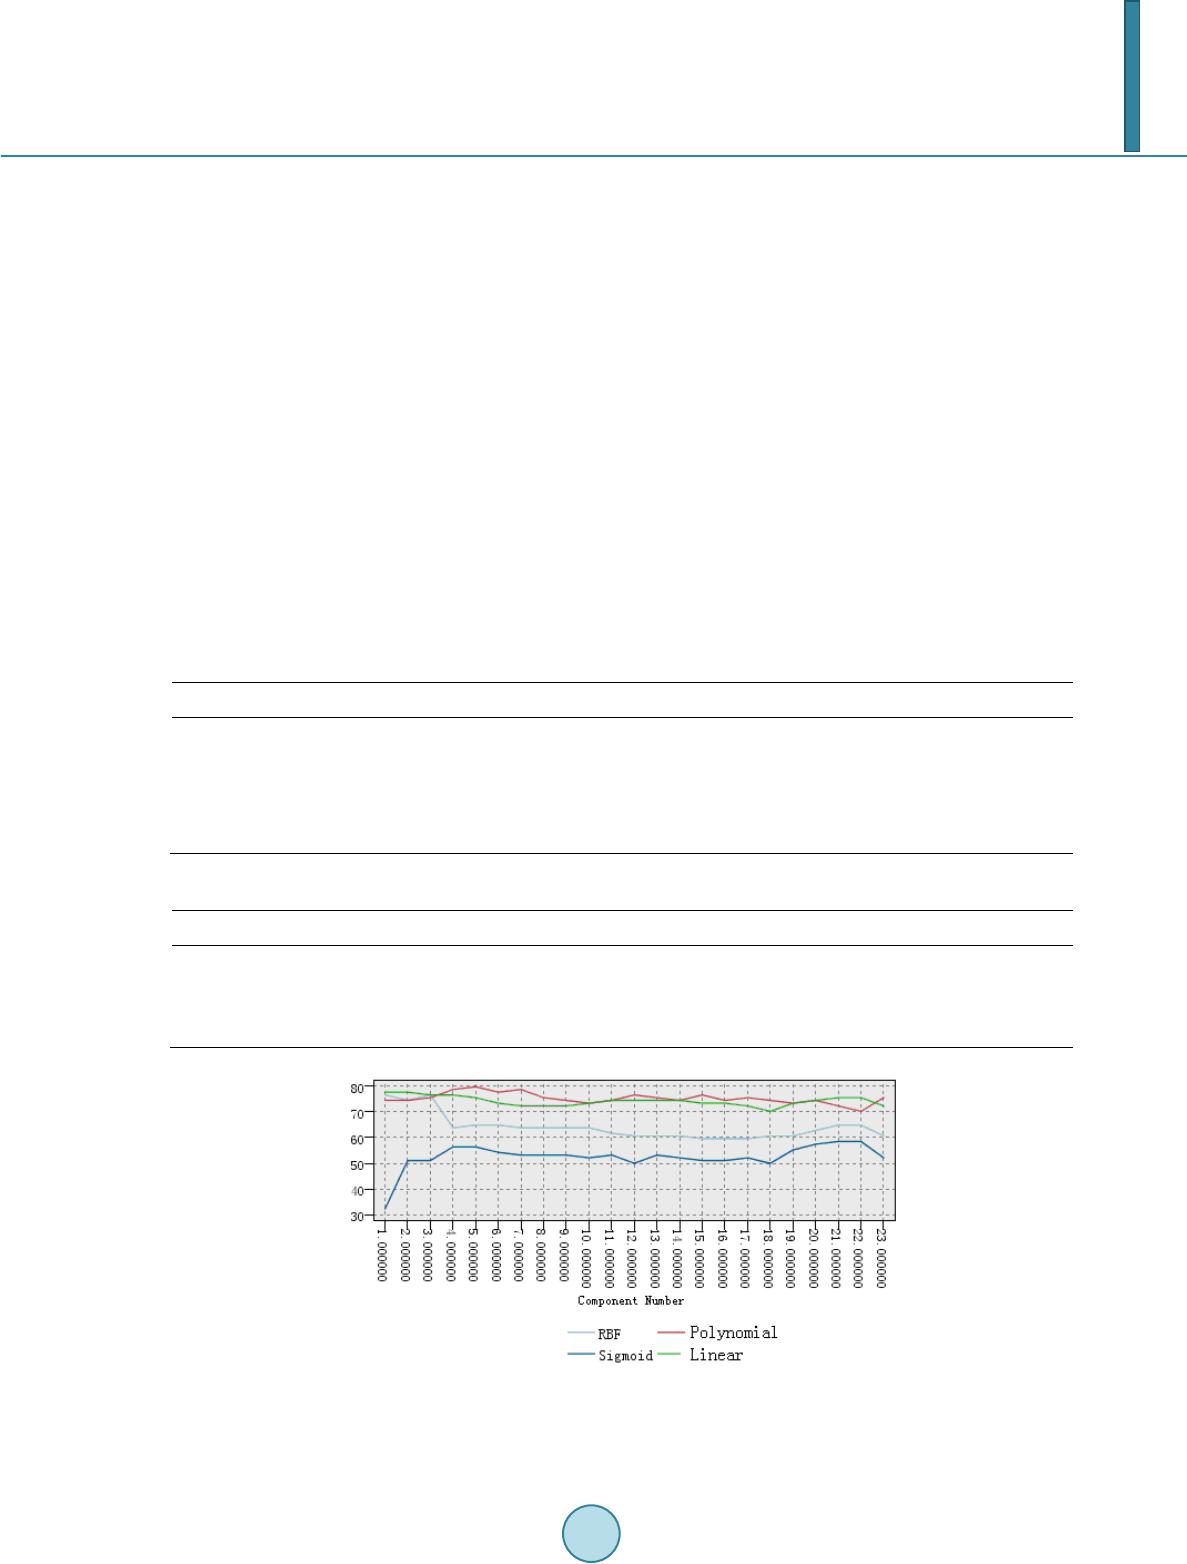 G. C. Shen, W. Y. Jia we get the result on the training data and test data. There are four types of the common est kernel functions. In this paper, in order to construct a better prediction model, we try different combinations of kernel function and parameters, get the accuracies on the training data and test data, and select the nearly most accurate combination as the optimum choice. The result is displayed in Table 3. According to Table 4, when we select polynomial as kernel function, where penalty C is 100, the accuracy of SVM model is the most accurate on the training data as well as on the test data. As there are four kinds of kernel functions and 23 principal components to select, we try each combination of kernel function and components number to find the most accurate combination. The combination results are dis- played in Figure 2. From Figure 2, we can find that the classification accuracy with polynomial is higher than the other three types of kernel functions in most cases, and its accuracy is the highest when component number is five, and the accuracy is 79.79%. To inspect the meaning of every factor explicitly, we use the method of rotating principal components so that every factor maximizes at some direction. We get component matrix in Table 5, and this table shows the coeffi- cient of every factor on every input variable. Through our inspection, we can find that is composed of Net Return on Assets, earnings per share, growth rate of net asset, net assets per share, total assets growth rate, return on equity, net profit margin on sales, main business profitability, asset-liability ratio, and net profit growth rate, is composed of cash recovery for Table 3. Training result and rest Result. Training Samples Test Samples ST Non-ST Accuracy ST Non-ST Accuracy ST 98 36 73.13% 35 12 74.47% Non-ST 24 110 82.09% 15 32 68.09% Total 122 146 77.61% 50 44 71.28% Table 4. The classification result of four types of kernel functions Training Samples Test Samples Kernel RBF Polynomial Sigmoid Linear RBF Polynomial Sigmoid Linear Accuracy 77.61% 83.58% 58.21% 81.34% 71.28% 78.72% 53.19% 72.34% Error Rate 22.39% 16.42% 41.79% 18.66% 28.72% 21.28% 46.81% 27.66% Figure 2. Classification Accuracy of SVM model with different component number and kernel function.  G. C. Shen, W. Y. Jia total assets, Operating Cash Flow Per Share, Cash current liability ratio and Sales Cash Ratio, is composed of quick ratio, current ratio, and cash ratio, is composed of total assets turnover,current asset turnover, inventory turnover ratio,and accounts receivable turnover, and is composed of main business’s increasing rate of income and main business profit growth. We use SVM model to compute the factor importance, and find that ranks first, second, third, fourth, and fifth. This shows that development trend is predominant, and the ability of profit growth is very important, and the rapid cash ability is important to some degree. 4.4. Model Comparison We use training data to train SVM model without PCA, and use the trained model to classify the training sam- ples and test samples. Then we compare the results between SVM models with and without PCA. The compari- son result is displayed in Table 6. From Table 6, we can find that SVM model without PCA over fits training data and the accuracy on ST companies is very low. Two accuracies are very similar on training data and test data when using SVM model with PCA to classify, thus as a whole the results are very equilibrium. We compare the new prediction model with Artificial Neural Networks Model, Bayesian Model, Logistic Re- gression Model, and the comparison result is displayed in Table 7. Table 5. Matrix of Principal Component. Component Net return on assets 0.864 0.188 0.041 0.174 0.173 Earnings per share 0.821 0.092 0.026 0.142 0.147 Growth rate of net asset 0.722 −0.206 0.117 0.121 −0.021 Net assets per share 0.699 0.037 0.047 0.096 −0.165 Total assets growth rate 0.696 −0.300 −0.026 0.149 0.128 Return on equity 0.650 0.099 0.064 −0.005 0.061 Net Profit Margin on Sales 0.636 0.294 0.021 0.084 0.184 Main business profitability 0.548 0.107 −0.063 −0.365 −0.007 Asset-liability ratio −0.533 −0.255 −0.418 −0.041 0.048 Net profit growth rate 0.415 −0.022 −20.39E−05 0.096 0.035 Cash recovery for total assets 0.017 0.944 −0.008 0.148 −0.043 Operating cash flow per share −0.072 0.873 0.025 0.119 −0.040 Cash current liability ratio 0.098 0.801 −0.038 0.123 −0.140 Sales cash ratio 0.152 0.712 −0.013 0.032 0.171 Quick ratio 0.059 −0.029 0.987 −0.009 −0.007 Current ratio 0.094 −0.048 0.981 −0.036 0.010 Cash ratio 0.036 −0.010 0.960 0.038 −0.012 Total assets turnover 0.292 0.093 −0.088 0.846 0.011 Current asset turnover 0.231 0.244 −0.098 0.845 −0.048 Inventory turnover ratio −0.041 0.087 0.183 0.527 −0.086 Accounts receivable turnover 0.057 0.018 −0.025 0.190 0.104 Main business’s increasing rate of income 0.064 −0.065 0.020 0.094 0.819 Main business profit growth 0.115 0.016 −0.026 −0.066 0.775  G. C. Shen, W. Y. Jia Table 6. Accuracy Comparison between SVM models with and without PCA. Training Samples Test Samples SVM without PCA ST Non-ST Accuracy ST Non-ST Accuracy ST 128 6 95.52% 39 8 82.97% Non-ST 5 129 96.27% 15 32 68.08% Total 133 135 95.9% 54 40 75.53% SVM with PCA ST 97 37 72.39% 37 10 78.72% Non-ST 21 113 84.33% 9 38 80.85% Total 118 150 78.36% 46 48 79.79% Table 7. Prediction Result Comparison among different models. ANN Bayesian Logistic SVM Accuracy without PCA 71.28% 59.57% 72.34% 75.53% Accuracy with PCA 74.47% 63.83% 74.47% 79.79% From Table 7, we can find that the accuracies of all models have been improved with PCA, but the accuracy increment of SVM is the largest. Therefore the combination of PCA and SVM can get better result. 5 Conclusions As current prediction models of company financial crisis have some deficiencies, we have selected 181 normal companies and 181 ST companies (including *ST) from 2001 to 2011, and have constructed the combination model of PCA and SVM to predict the financial crisis of a company on the basis of traditional financial indexes three years before the company is specially treated. This new model can process nonlinear relation between fi- nancial variables and financial crisis, and has the advantages of long-term high prediction accuracy, easy gene- ralization, and simple computation. The result shows that this model has better prediction three years in advance, and the accuracy is 78.73% on the training samples, and 79.79% on the test samples. Every insider knows that ST Company is specially treated after it is with two consecutive annual losses. Three years in advance is one year earlier than ST Company has deficit. In another word, this model can predict the prospect of a company three years earlier than it is specially treated. This model also has some limitations. As SVM has low interpretability, we cannot construct an explicit func- tion from these indexes; therefore we cannot abstract rules to reflect the degree of risk of company operation state. We will try to combine SVM model with other models to enhance its interpretability. References [1] Fitzpatrick, F. (1932) A Comparison of Ratios of Successful Industrial Enterprises with Those of Failed Firm. Certified Public Accountant, 6, 727-731. [2] Beaver, W. (1966) Financial Ratios as Predictors of Failure. Supplement to Journal of Accounting Research, 4, 71-111. [3] Altman, E. (1968) Financial Ratios, Discriminant Analysis and the Prediction of Corporate Bankruptcy. Journal of Finance, 9, 589-609. http://dx.doi.org/10.1111/j.1540-6261.1968.tb00843.x [4] Ohlson, J. (1980) Financial Ratios and the Probabilistic Prediction of Bankruptcy. Journal of Accounting Research, 18, 109-131. http://dx.doi.org/10.2307/2490395 [5] Odom, M. and Sharda, R. (1990) A Neural Network for Bankruptcy Prediction. International Joint Conference on Neural Networks, 2, 163-168. [6] Min, J.H. and Lee , Y.C. (2005) Bankruptcy Prediction Using Support Vector Machine with Optimal Choice of Kernel Function Parameters. Expert Systems with Applications, 28, 603-614. http://dx.doi.org/10.1016/j.eswa.2004.12.008 [7] Wu, S.N. and Huang, S.Z. (1986) Analysis Indexes and Prediction Model of business failures. Economic Issues in  G. C. Shen, W. Y. Jia China, 6, 15-22. [8] Zhou, S.H., Yang, J.H. and Wang, P. (1996) Prediction Analysis of Financial Crisis—F Fraction Mode. Accounting Research, 8, 8-11. [9] Chen, J. (1999) Empirical Analysis of Listed Company Financial Deterioration Prediction. Accounting Research, 4, 31- 38. [10] Wu, S.N. and Lu, X.Y. (2001) A Study of Models for Predicting Financial Distress in China’s Listed Companies. Eco- nomic Research Journal, 6, 46-56. [11] Yang, S. and Huang, L. (2005) Financial Crisis Warning Model Based on BP Neural Network. System Engineering- Theory & Practice, 1, 12-19. [12] Huang, X. and Zhou, A.Q. (2009) A Study of Combination Warning of Enterprise Financial Crisis Based on BP Neural Network. Research on Economics and Management, 5, P87-P91 [13] Vapnik, V. and Lerner, A. (1963) A Pattern Recognition Using Generalized Portrait. Automation and Remote Control, 24, 6. [14] Kimeldorf, G. and Wahba, G. (1971) Some Results on Tchebycheffian Spline Functions. Journal of Mathematical Analysis and Applications, 33, 85-95. [15] Vapnik, V.N. (1999) The Nature of Statistical Learning Theory. Springer-Verlag, New York.
|