 Journal of Applied Mathematics and Physics, 2014, 2, 862-868 Published Online August 2014 in SciRes. http://www.scirp.org/journal/jamp http://dx.doi.org/10.4236/jamp.2014.29097 How to cite this paper: Nakagawa, S.T. and Senju, Y. (2014) Is the RENP Process Probable for a Xe Atom Embedded in Quantum Solid? Journal of Applied Mathematics and Physics, 2, 862-868. http://dx.doi.org/10.4236/jamp.2014.29097 Is the RENP Process Probable for a Xe Atom Embedded in Quantum Solid? S. T. Nakagawa, Y. Senju Graduate School of Science, Okayama University of Science, Okayama, Japan Email: stnak@dap.ous.ac.jp Received 18 June 2014 Abstract We studied the excitation spectra in the case of Xe@(p-H2)n embedded in a solid-state parahydro- gen, making use of the ab initio molecular orbital method (QMO), in order to seek the possibility of the radiative emission of the neutrino pair (RENP) process that may be associated with the E1 × M1 transition processes. By means of a QMO calculation, the remarkable matrix effect was found in the structure of the electronic states. Three E1-type excitation bands (ε1, ε2, ε3, in the order of in- creasing energy) in the UV absorption were found. In the pres ent preliminary calculation, the second was too close to be clearly/well distinguished as an independent peak observed in the last experiment. Nevertheless, across the second (ε2) band, two associated bands that may link to the M1-type transition were found. Therefore, the M1-type de-excitation process may be probable with the help of intensity borrowing from the ε2 band, which may support the probability of the RENP process. Keywords RENT Process, Ab-Inito Molecular Orbital Calculation, Clathlate, Matrix Effect 1. Introduction In order to evaluate the mass of the neutrinos, Yoshimura and Sasao [1] proposed to investigate the specific de- excitation process called the radiative emission of the neutrino pair (RENP) accompanying single-photon (γ) emission [2]. Namely, the RENP is a de-excitation process from a metastable excited state |e> to the ground state |g> by emitting a neutrino pair (νi and νj) and a photon (γ), that is, |e> → |g> + γ + νi νj as is illustrated in Figure 1. Because of the very low probability of the RENP, preparing a super-radiance system was proposed [3] where cooperative de-excitation can be expected [1] [4]. This process may be developed by the trigger-laser ir- radiation of two colours, which frequently causes the two- photon process |e> ↔ |g> + γ + γ, or |e> + γ ↔ |g> + γ inside the target [4]. The RENP process may be probable in the decay process for an electron that left the ground state |g>, by way of a virtual state |p>, and returned to the ground state |g>. This may be the type of E1 × M1 transition that can be triggered by the pump-probe technique. The transition probability of the forbidden M1-type is proportional to Zα (α > 10 for a high-Z atom as Z > 26 [5]); therefore, the RENP rate increases, even to a level comparable to that 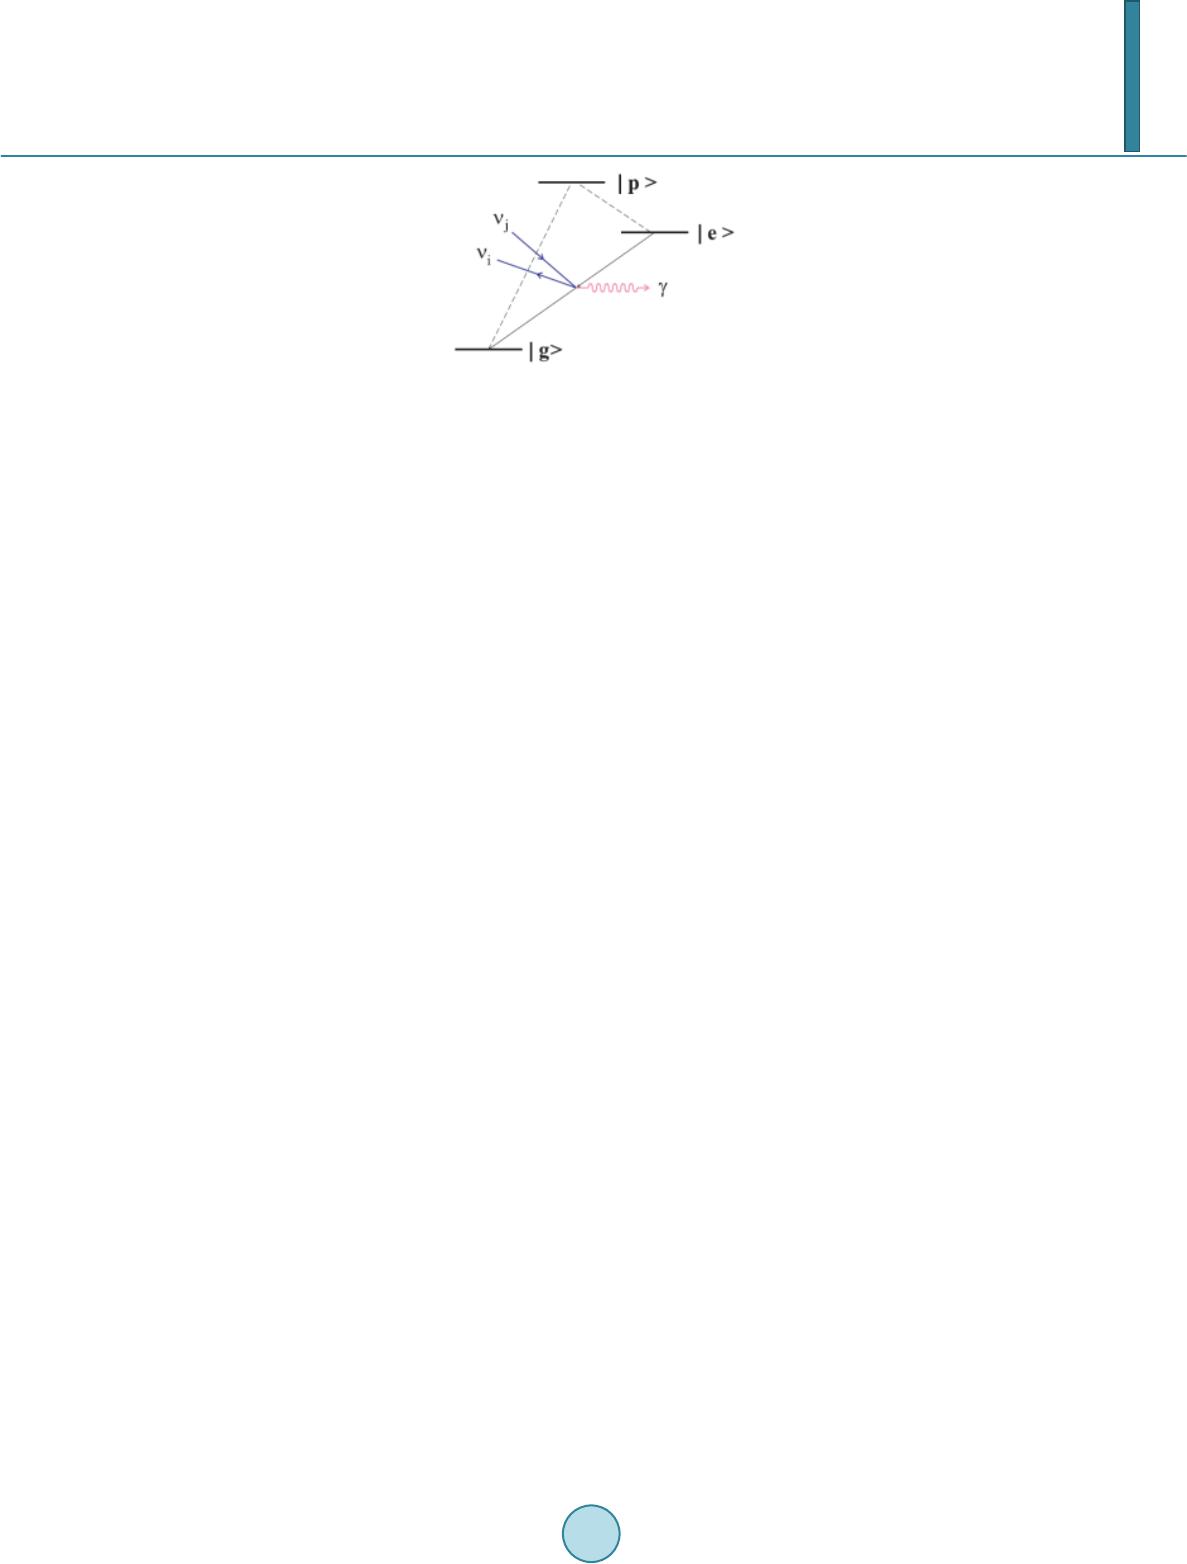 S. T. Nakagawa, Y. Senju Figure 1. Model of the RENP. The neutrino emission associated with the M1-type transition |e> → |g> + νi + νj may occur if a vir- tual intermediate state |p> will be effective ([Figure 1] in Ref. 4). of the allowed transition, if a heavy atom, such as Xe, is adopted. Moreover, if some forbidden states would lo- cate so closely in the vicinity of the allowed states, the forbidden transition might occur because of “intensity borrowing” [6]. The E1-type transition due to the electric dipole transition is usually observed as an absorption spectrum in the region of ultraviolet–visible light (UV-Vis). It can occur when the two states relating to the transition have dif- ferent parity. On the other hand, the M1-type transition relates to the magnetic dipole, thus it is optically forbid- den and the two states concerned have the same parity. The difference in the parity causes the difference in the oscillator strength (f), that is, f ≠ 0 and f = 0 for E1- and M1-type transitions, respectively. Therefore, the RENP process (|e> → |g>) can be realistic, if a higher excited state |p> exists above the lowest excited state |e>, and the parity of |p>’s wave function is different from those of |g> and |e>. For a candidate system to search for the RENP process, a system of Xe@(p-H2)n was prepared by the matrix isolation method by embedding Xe atoms in a quantum solid of parahydrogen at liquid He temperature (LHeT) [4] [7]. At LHeT, the crystal structure of (p-H 2)n is hexagonal (hcp) [8]. The reason for choosing a quantum solid is to lengthen the life time of the metastable states of the enclosed atom [9]. In the absorption spectra in the UV-Vis region (200 - 700 nm), a free Xe atom shows two peaks at (8.437 eV and 9.570 eV). When embedded in an argon solid, the matrix effect was already known as the blue-shift of those two peaks and the emergence of an additional peak in the middle of those two peaks [10]. In the case of Xe embedded in parahydrogen, similar ma- trix effects were obtained [7]: namely, in addition to the blue-shift (~0.6 eV) for those two peaks, three peaks appeared at (9.06 eV, 9.7 eV, 10.3 eV). One model to explain the further splitting of an energy state can be due to the presence of a Wannier-type ex- citon [11] [12]. The Coulomb interaction works between an electron and a hall of the exciton, which forms a new ladder of electron energy states, as in the case of a quasi-hydrogen system. When applying this model to the present case, the exciton-associated levels will emerge below the bottom of the conduction band, as a ladder se- ries of (En = Eg − 1.7/n2, Eg = 10.1 eV) [11]. Unfortunately, this model cannot explain the measured data. In order to identify whether the transition type is E1, M1, or something else, we have to calculate the orbital energy of the Rydberg states and the multi-pole moments using ab initio molecular orbital calculation (QMO). In a condensed material, the Rydberg states are usually very condensed because of the mixing of the atomic or- bitals (AOs) originated in the host atoms. In fact, the level density of molecular orbitals (MOs) can be very high, while ΔE is even smaller than 1 meV. Therefore, we see no more single intrinsic excitations to an AO but a col- lective excitation to one of the MOs [12] for an atom embedded in a solid. 2. Method 2.1. QMO Calculation For the calculation of the Xe@(p-H2)n cluster, the QMOs adopted here are the Gaussian 09 [13] and refer to the DV-Xα method [14] [15]. The latter is to see how the composite AOs construct MOs. In the case of the Gaus- sian, we choose the diffuse-type basis function (BF) for H atoms to study the widely spreading electron density in the Rydberg states. Namely, the BF for H atoms of (p-H2) molecules is a diffuse type of 6-311++g(5d, 7f), which is made of 7 AOs for 1 electron for one H atom. The BF for the Xe atom is DGDZVP (Density functional Gauss double-zeta valence polarized) that is made of 36 AOs for 54 electrons for the Xe atom. For the algorithm to investigate the Rydberg states that determine emission spectra, we adopt the time-dependent density func-  S. T. Nakagawa, Y. Senju tional method (TDDFT) [16] with the B3LYP (Becke type 3 parameter density functional method with the Lee -Yang–Parr correlation function) approximation [17]. Moreover, the configuration interaction (CI) is also considered to introduce many virtual states. 2.2. Cluster Model for Xe@(p-H2)n Before constructing a cluster for calculation, the necessary points to be considered were: the allocation site of the Xe atom, the cluster size enclosing the Xe atom, and the orientation of p-H2 molecules. In the case of a B atom doped in a parahydrogen solid, B@( p -H2)n, the metastable location for the B atom was at a lattice site of the hcp crystal [18], which was confirmed by reproducing the first excited spectrum from 2p to 3s, using a path-integral molecular dynamics simulation. So, we assumed that a heavier atom of the Xe would also stay at a lattice site. Therefore, we took an hcp cluster made of p-H2 molecules that enclose one Xe atom at their centre, that is, Xe@( p-H 2)n. The value of n is (12, 18, 20, 38, 44), if we take up to the (1st, 2nd, 3rd, 4th, 5th) nearest neighbours, respectively. Here, we take X e @(p -H2)12 as will be supposed in Figure 2, where the central Xe atom receives the ligand field of D3h [18]. As for the initial orientation of each p-H2 molecule, their bonding axes are modelled to be directed towards the central Xe atom as Diehl [19] supposed. One reason is to keep the high D3h symmetry of the hcp crystal. 3. Results 3.1. Matrix Effect on the Electron Distribution in an hcp Cluster of Xe@(p-H2)12 Figure 2 presents the hcp cluster (Xe@(p-H2)12) with D3h symmetry. The highest occupied (HOMO) state is the 39th MO and the lowest unoccupied (LUMO) is the 40th MO. There can be many transition paths for an electron that transfer from a valence state (HOMO-m) to a Rydberg state (LUMO + n). Here we take into account the transition paths of excitation up to the 15th path from 1 to 15 by increasing the excitation energy. Figure 2 illustrates the side view of the electron distribution (ρ(r)) in the cluster. Figure 2(a) and Figure 2(b) illustrate the ρ(r) of the HOMO and LUMO, respectively. The small white spheres indicate that those hydrogens do not contribute to composing the MOs. The matrix effect on ρ(r) was evident. Note the off-spherical profile of ρ(r) in the HOMO state (Figur e 2(a)). Because of the nuclear spin of each p-H2 molecule (I = 0), the ground state of an intrinsic parahydrogen is composed of p-H2 molecules with the rotational quantum number ν = 0 [20]. When an external disturbance is exerted, higher quantum numbers (υ = 2, 4…) might be effective. Such an off -spherical form is consistent with the previous prediction of ~15% spectral shift by introducing Xe [21]. Moreover, Fig ure 2(c) shows the net deviation in the charge from its original (Xe0 or H0) atom in the ground state. The (light green) central sphere presents the deficient electrons in the Xe atom by about one (+ 0.86 e). This implies again that we see no more single intrinsic excitations to an AO. For the electron balance, the excess electrons are shared among the surrounding twelve pairs of (p-H2)12, which yields the D3h ligand field to Xe. Namely, the larger part (about −0.076 e/H atom) was taken by the closer H (red sphere) atoms and the residual (about −0.0031 e /H atom) was taken by the further H (black sphere) atoms. (a) (b) (c) Figure 2. Electron distribution in the Xe@(p-H2)12. (a) and (b) show the HOMO(a) and LUMO(b) orbitals, re- spectivel y; (c) shows the net electron balance deviated from the neutral atom, where the central Xe atom has a solely positive charge.  S. T. Nakagawa, Y. Senju 3.2. The Matrix Effect on the Energy of the Rydberg States of Xe@(p -H2)12 Figure 3 illustrates the primary result for the energy levels obtained by the DV-Xα [14] method for the ground state of Xe@(p -H2)12. The energy levels of the MO are shown in the left column (enclosed by the red solid frame) and those of the composite AOs (enclosed by blue dotted frame). Figure 3 shows that if an electron at the HOMO (39th state) will be excited, it will enter one of the excited states (HOMO (40th state) + n) that sig- nificantly includes the hydrogen’s orbital (AOs) in addition to the Xe’s AOs. The very close heights of the en- ergy states of the AOs between the Xe and H atoms, as is shown in the area enclosed by the dotted frame, con- notes the strong degeneration of the Rydberg MOs. More detailed calculations were undertaken using the Gaussian09. Table 1 and Figure 4 present the calcu- lated absorption spectra for the Xe@(p-H2)12. The first transition path (No. 1) corresponded to the HOMO (39th) → LUMO (40th) excitation, as is often expected in Frontier theory. From the value of the oscillator strength (f), we ascribe a path to be an E1-type allowed transition if the value f is significantly larger than null as is hatched. The f value can be qualitatively compared with the measured data of the absorption intensity of –log10(I/I0) in the last column. The “CI mix” in the middle column denotes the largest coefficients in the CI expansion, which was over 70% at its maximum. Figure 3. Relative heights of energy levels of MO (left col- umn) and constituent AOs (right column) for Xe@(p-H2)12. These values are given by the DV-Xα method [14]. Figure 4. The absorption spectra of Xe@(p-H2)12 calculated here. The up- ward red vector can indicate the ε3 band of E1-type transition (|g> → |p>), while the downward blue vector implies the possibility of M1-type transition (|e> → |g>) in the decay stage, as was proposed in F ig ure 1.  S. T. Nakagawa, Y. Senju Table 1. Excited spectra of Xe@(p-H2)12. The TDDFT/B3LYP was used for comparison with the measured peaks for free Xe and Xe atoms trapped in a parahydrogen solid (Xe@(p-H2)n) [7]. The hatched bands denote the E1-type transition. Calculation (39: HOMO, 40: LUMO) Experiment [7] Path E(eV) Band Osclla. strength Wavelen gth (nm) Degenerated states CI mix. (max.) Peak (eV) free Xe Peak (eV) Xe@(p-H2)n 1 9.2625 ε1 0.265 133.86 39 - >40 0.70376 8.437 9.06 0.54 2 9.263 0.2666 133 .85 38 - >40 0.70286 3 9.2631 0.2664 133.85 38 - >40 0.70286 4 10.2907 0 120.48 4 states (0.182) 5 10.2999 0 120.37 2 states (0.156) 6 10.3006 0 120.37 2 states (0.679) 7 10.3409 ε2 0.0226 119.9 4 states (0.152 ) 9.7 0.24 8 10.3411 0.0229 119.89 4 states (0.467) 9 10.358 0 119.7 5 states (0.544) 10 10.3731 0 119.52 3 states (0.675) 11 10.3734 0 119.52 3 states (0.673) 12 10.5411 ε3 0.0241 117.62 38 - >44 0.6814 9.570 10.3 0.48 13 10.5412 0.0 241 117.62 37 - >44 0.67837 14 10.6365 0.1 157 116.57 3 states (0.663) 15 10.7378 0 115.47 7 states (0.386) Because of the strong degeneracy in the Rydberg states, 15 paths looked to be bunched in several groups. Namely, the excitation peaks of the E1-type absorption are denoted by the band of (ε1, ε2, ε3) corresponding to (Nos. 1 - 3, Nos. 7 - 8, Nos. 12 - 14), respectively. Unfortunately, the two (ε2, ε3) bands were too close (ΔE ~ 0.2 eV) to be distinguished as independent peaks as was observed in the experiment [7]. Nevertheless, one finding of the present calculation was the possibility of “intensity borrowing”. The forbidden band (Nos. 4 - 6 or Nos. 9 - 11) may be triggered by intensity borrowing from the allowed (ε2) band, the possibility of which should in- crease by increasing the atomic number. The larger the atomic number concerned, the higher should be the pos- sibility of intensity borrowing; thus intensity borrowing is probable. 3.3. Identification of E1-Type and M1-Type Transitions Using the Dipole Moments In Table 1, it is not clear whether or not the M1-typ e transitions can occur. Therefore, the electronic circular di- chroism (ECD) was examined in terms of the components of the electric and the magnetic dipole moments as listed in Table 2. The item “Dip.S” in the second last column means the absorption difference between the right and left polarized lights in the ECD analysis. If this value were null, it may imply that no E1-type transition oc- curs. Therefore, the rows coloured yellow and green in Table 2 can indicate E1-type and M1-typ e transitions, respectively. Due to the components being too small, two paths (No. 9 and No. 15) are postponed conclusively to identify the next calculation with much higher accuracy. Figure 4 illustrates the absorption spectra tabulated in Table 1. The second (ε2) band is too close (ΔE ~ 0.2 eV) to be distinguished from the third (ε3) band and recognized to be an independent peak like a new peak at 9.7 eV in experiment [7]. When reminded of the processes shown in Figure 1, the specific path of excitation (|g> → (E1) → |p>) may correspond to the transition to the third (ε3) band of Nos. 12 - 14, and then the following de-excitation (|e> →(M1) → |g>) may occur as the reverse transition of Nos. 4 - 6 or Nos. 10 - 11 in Table 1 and Table 2, with the help of intensity borrowing from the (ε2) band. From the levels with such a dense structure (Nos. 4 - 11) including the allowed ε2 band, intensity borrowing can be probable, which may trigger the forbidden M1-type transitions. When this happens, the red upward and  S. T. Nakagawa, Y. Senju Table 2. The magnetic and electric dipole moments concerning transitions from a ground state to an excited state. The symbols <*> and <**> indicate M1-type and E1-type transitions, respectively. Components of the magnetic dipole moment Components of the electric dipole moment states X Y Z states X Y Z Dip. S Band 1 −0.0002 −0 .0004 0.0022 **1 −0.0529 0.0 323 −1.0788 1.1676 ε1 2 0.0006 −0.001 −0.0001 **2 0.5214 −0.9487 −0.0533 1.1747 3 −0.001 −0.0005 −0 .0002 **3 −0.9486 −0.5227 0.0301 1.174 *4 −0.002 −0.0085 0.1099 4 0.0019 0.0015 0.0 004 0 *5 −0.0588 −0 .0822 −0.0075 5 −0.0002 −0.0002 −0.0005 0 *6 −0.0825 0.0 587 0.0031 6 −0.0003 0.0011 0.0001 0 7 0.0002 −0.00 07 −0.0002 **7 0.2344 −0.1847 −0.0136 0.0892 ε2 8 0.0001 0.0 008 −0.0004 **8 0.1864 0.2349 0.0211 0.0904 9 0.0001 0.0003 0 9 −0.0053 0.0037 0 0 *10 −0.0467 −0.0401 −0.0038 10 −0.0037 0.0022 0.0012 0 *11 −0.0401 0.0466 0.0032 11 0 -0.0016 −0.0003 0 12 0.0006 −0.0009 −0.0002 **12 −0.1375 0.272 0.0227 0.0934 ε3 13 −0.0009 −0.0006 −0.0002 **13 0.2729 0.137 0.0127 0.0934 14 0.0001 0 0.0016 **14 0.0033 0.0568 −0.6638 0.4439 15 0 0 0 15 −0.0007 0.0 004 −0.00 14 0 blue downward vectors in Figure 4 may explain the model shown in Figur e 1. Although not all the Rydberg states are shown in the column of the “degenerated state” in Table 1, ground state |g> involved (HOMO, HOMO-1, HOMO-2) and an excited state |p> involved (LUMO+4, LUMO+7, LUMO+8), the photon energy to be absorbed was 10.5 eV. On the other hand, the excited |e> state that involved (LUMO+1, LUMO+2, LUMO+3) might contribute the RENP process. 4. Conclusions There was a theoretical proposal to identify the neutrino pair emission (RENP) that accompanies magnetic di- pole (M1-type) transition in a heavy atom, as illustrated in Figure 1. This sequence of (excitation |g> → |p>, two-steps de-excitation of |p> → |e> → |g>) is probable when triggered by a photon in the UV-Vis region. A candidate atom to be an emission centre was a Xe atom embedded in a parahydrogen solid that has an hcp crys- tal structure. Making use of an ab initio molecular orbital calculation for a cluster of Xe@(p-H2)12, we calculated the existing paths up to the 15th. Because of the degeneracy due to the matrix effect, those paths looked to be bunched into several bands. Three E1-type transition bands were found, which we called (ε1, ε2, ε3) in the order of increasing energy. The ε3 band at 10.5 eV was assigned to be the first E1-type excitation corresponding to “|g> → |p>”. The middle (ε2) band was too close to be separated from the higher (ε3) band. The interesting result was that this middle (ε2) band was almost attached (in the order of a few tens of meV) with the forbidden bands that can relate to the M1-type. Therefore, we suppose that, after the E1-type excitation, the M1-type de-excitation from |e> → |g> may/can be triggered by the intensity borrowing from the second (ε2) band as the reverse process of the M1-type excitation (based on the Frank–Condon rule) as illustrated in Figure 4. In the present preliminary calculation, the separation among the three absorption bands was not enough to be compared with an experiment; however, intensity borrowing can probably support the M1-ytpe transition that links to the RENP process. Further study is continuing to obtain more acceptable absorption spectra, by increas- ing the cluster size and increasing the theoretical level of the algorithm.  S. T. Nakagawa, Y. Senju Acknowledgements The authors thank Dr. G. Sakane in Okayama University of Science for valuable suggestions, especially in the calculation using the DV-Xα method. This work has been supported by a grant for Scientific Research on Inno- vative Areas (Grant No. 21104003) from MEXT (Ministry of Education, Culture, Sports, Science, and Tech- nology, Japan) and partly supported by a grant for Scientific Research (C) (Grant No. 21510108) from JSPS (Japan Society for the Promotion of Science). References [1] Yoshimura, M. and Sasao, N. (2009) High Energy Physics-P henomenology. arXiv: 0901.2769 http://xqw.hep.okayama-u.ac.jp/kaken hi/:. [2] Aitchison, I.J.R. and Hey, A.J .G. (2003) Gauge Theories in Particle Physics. Taylor & Francis, London. http://dx.doi.org/10.1201/9780849387760 [3] Di cke, R.H. (1954) Coherence in Spontaneous Radiation Processes. Physical Review, 93, 99-11 0. http://dx.doi.org/10.1103/PhysRev.93.99 [4] Fukumi, A., Kuma, S., Miyamoto, Y., Nakajima, K. , Nakano, I., Nanjo, H., Ohae, C., Sasao, M., Tanaka, M., Tanigu- chi, T., Uetake, S., Wakaba yashi , T. , Yamaguchi, T., Yoshimi, A. and Yoshimura, M. (2012) Neutrino Spectroscopy with Atoms and Molecules. Progress of Theoretical and Experimental Physics, Article ID: 04D002/1-79. [5] Ch en, K.T., et al. (1979) Electric Dipole, Quadrupole, and Magnetic Dipole Transition Probabilities of Ions Isoelec- tronic to the First-Row Atoms, Li through F. Atomic Data and Nuclear Data Tables, 24, 111-189. http://dx.doi.org/10.1016/0092-640X(79)90006-8 [6] Steinfeld, J. I. (1985) Molecules and Radiation: An Introduction to Modern Molecular Spectroscopy. 2nd Edition, The MIT Press, Cambridge, Chapter 9. [7] Nakaji ma, K. (2010) Proc. FPUA 2010, 51-59. [8] Ko gan , V.S., Lazarev, B.G. and Bulatova, R.F. (1957) So v. Ph y s. -JETP , 4, 593. [9] Nosanow, L.H. (1966) Theory of Quantum Crystals. Physical Review, 1 46 , 120. http://dx.doi.org/10.1103/PhysRev.146.120 [10] Schr oder, T. , et al. (1985) Transient Absorption of Xe and Kr Guest Atoms in Ar Crystals. Physica Status Solidi (b), 131, 741-746 . http://dx.doi.org/10.1002/pssb.2221310235 [11] Gedanken , A. , et al. (1972) Trapped Excitons in Solid Hydrogen. Chemical Physics Letters, 14, 326-328. http://dx.doi.org/10.1016/0009-2614(72)80124-6 [12] Haken, H. (1973) Quantenfeldtheorie des Festkörpers, Chapter 23, G. Teubner Stuttgart, Stuttgart. http://dx.doi.org/10.1007/978-3-322-966 94 -0 [13] http://www.gaussian.com/ [14] Ellis, D.E. and Painter, G. S. ( 1970 ) Phys. Rev. B, 2, 2887-2898. http://www.dvxa.org/index-e. ht ml [15] Mukoyama, T. and Adachi, H. (198 7) Bull. Inst. Chem. Res., 65, 23-26. [16] Tran i , F., Scalmani, G., Zheng, G.S., Carni meo, I., Frisch, M.J. and Barone, V. (2011) Time-Dependent Density Func- tional Tight Binding: New Formulation and Benchmark of Excited States. Journal of Chemical Theory and Computa- tion, 7, 3304-3313. http://dx.doi.org/10.1021/ct200461y [17] Becke, A. D. (1993) Density-Functional Thermochemistry. III. The Role of Exact Exchange. The Journal of Chemical Physics, 98, 5648-56 52. http://dx.doi.org/10.1063/1.464913 [18] Krumrine, J.R., Jang, S., Alexander, M.H. and Voth, G.A. (2000) Quantum Molecular Dynamics and Spectral Simula- tion of a Boron Impurity in Solid Para-Hydrogen. The Journal of Chemical Physics, 113, 9079-9089. http://dx.doi.org/10.1063/1.1318225 [19] Diehl , H.-W. ( 1974 ) P ara-Hydrogen Molecules in Solid Ortho-Hydrogen. Zeitschrift für Physik, 271, 235-24 5. http://dx.doi.org/10.1007/BF01677929 [20] Katsuki, H. and Momose, T. (2000) Observation of Rovibrational Dephasing of Molecules in Parahydrogen Crystals by Frequency Domain Spectroscopy. Physical Review Letters, 84, 3286-3289. http://dx.doi.org/10.1103/PhysRevLett.84.3286 [21] Williams, J. and Alexander, M.H. (2000) Potential Energy Surfaces for and Energetics of the Weakly-Bound Al-H2 and B-H2 Complexes. The Journal of Chemical Physics, 112, 5722. http://dx.doi.org/10.1063/1.481147
|