Paper Menu >>
Journal Menu >>
 Modern Economy, 2011, 2, 90-106 doi:10.4236/me.2011.22014 Published Online May 2011 (http://www.SciRP.org/journal/me) Copyright © 2011 SciRes. ME A Spatial Equilibrium Analysis of Policy for the Forestry and Wood-Pro cessing Industries in Northern Vietnam Phan Sy Hieu1, Steve Harrison2, David Lamb3 1The Informatics and Statistics Centre for Agric ul t u r e a n d Rural Development, The Ministry of Agriculture and Rural Development, Hanoi, Vietnam 2The School of Eco no mi c s , The University of Queensland, Brisbane, Australia 3Rainforest Cooperative Research Center and School of Integrative Biology, University of Queensland, Brisbane, Australia E-mail: hieu_ps@yahoo.com, s.harrison@uq.edu.au, d.lamb@uq.edu.au Received January 28, 2011; revised March 11, 2011; accepted April 15, 2011 Abstract National objectives for forestry and wood-processing industries have not usually been achieved to the extent that the Government of Vietnam planned. A spatial equilibrium model with linear supply and demand func- tions for the forestry and wood-processing industries was developed to analyse policies for northern Vietnam. Four policy scenarios were established, in each of which optimal levels of prices, supply and demand quanti- ties were estimated, and solutions were subjected to sensitivity analysis with respect to the elasticity estimates. The analysis indicates that government objectives cannot be achieved in the 2010-2015 period because plans if implemented would force the main stakeholders to produce unprofitable quantities. For greater financial viabil- ity and sustainability, the number of planned new wood-processing factories should be reduced and the design production capacity of each new factory should be increased to achieve economies of size and international market competitiveness. Also, the area of planted production forest in northern Vietnam will increase in all four policy scenarios; however, the growth should be lower than the levels planned for 2015. Keywords: Five-Year Governmental Plan, Policy Scenario, Supply Target, Engineered Wood Products, Asia, Vietnam 1. Introduction Globally the area of natural forest has gradually declined and as a result many countries have sought to increase their forest plantation area. The increase has contributed to biodiversity, environment protection and economic growth in many countries. A consequence is that devel- opment of wood-processing industries has been under- going change, with greater use of plantation timber. National objectives can be presented in qualitative and quantitative targets for a given period of time, for in- stance one year and five years. Some countries regularly devise five-year plans for forestry and wood-processing industries. Qualitative and quantitative objectives are usu- ally specified for the final year of each five-year period, for example 2000, 2005, 2010, 2015 and 2020 as in Vietnam [1] and 2002, 2007, 2012 and 2017 as in India [2]. Qualitative objectives are usually presented as the in- crease in the participation of private sectors in timber plantation establishment, the expansion of the wood- processing industry, and the increase in incomes of peo- ple including the poor who manage plantation forest in upland and remote regions. In Vietnam, the qualitative objective of the national government has been that Viet- nam will become self-sufficient in terms of domestic production of wood and wood-processing products. In the plan, the domestic forestry industry will supply ap- proximately enough input for the wood-processing in- dustry, and the domestic production of the wood-proc- essing industry will not only meet the domestic demand but also leave some surplus for export [3]. Key and measurable qualitative objectives are usually quantified in forestry plans. For example, the Indian go- vernment targeted that the national forest cover would increase from 25% in 2007 to 33% in 2012 [4]. In Bhu- tan, one of national targets is to maintain the current for- est cover of 60% [5]. In Vietnam, a forest cover of 43%  P. S. HIEU ET AL. Copyright © 2011 SciRes. ME 91 was set in 1998 for 2010 [6]. More specifically, the Government of Vietnam [GoV) set supply targets to be achieved by 2010, 2015 and 2020 for wood and wood- processing products. For example, the national supply quantity planned is 5 million tonnes (Mt) for paper products and 6 Mt of sawn-timber in 2020 [3,7]. These national quantitative supply targets are divided between provinces. The GoV assumed that when the set of supply targets are met, the problems existing in the wood and wood-processing industries will generally be solved; for instance unprofitable farm-gate prices, high production cost of domestic pulp and paper products and shortage of industrial jobs in rural areas will be overcome [3]. To achieve national forestry objectives, policies in three broad areas are usually considered for implementa- tion by governments. The first policy group relates to the private ownership of plantation forest land, with gov- ernments proposing the transfer of more forest land to famers and local communities rather than to state organi- zations, as in Philippines [7] and Vietnam [8]. The second group is policies of timber exploitation from natural for- ests. The exploitation is usually banned (as in Vietnam during 1992-1998), or highly limited as in Vietnam [8], the Philippines [7] and Australia [9]. The third policy group considers how to manage timber markets effec- tively or how wood markets work competitively, as in Philippines [7] and Bhutan [5]. Besides policy groups, changes of governmental institutions are usually planned in many countries, including Cambodia [10], Vietnam [8,11], the Philippines [7] and Mongolia [12]. These in- stitutional changes aim to make government forestry policies func- tion more effectively. In the case of Vietnam, the GoV has developed poli- cies in two main areas, namely to increase investment in expanding the design production capacity of existing large-scale state-owned enterprises and to build new large- scale wood-processing enterprises. To increase the sup- ply of logs, the GoV implemented the Five Million Hec- tare Reforestation Program (5MHRP) over 1998-2010 [13]. Globally, national qualitative and quantitative object- tives for forestry and wood-processing industries are often unachievable, for instance in Bhutan [5], the Phil- ippines [7] and India [4]. For example, in India, accord- ing to Joshi et al. (2010) [4] only three states in the total of 28 states and 7 union territories will meet the planned forest cover of 33%. A common reasons reported for failures in these countries is weak policy and institution frameworks that make markets work inefficiently, for in- stance the high marketing cost in the Philippines [7]. Other reasons relate to insufficient funds from govern- ments, for example in Mongolia [12], and high rates of poverty in upland regions, e.g. greater than 90% in Viet- nam [8] and in the Philippines [7]. In these regions, local people have focused on short-term enterprises and par- ticularly annual crops rather than long-term income sources including planting timber trees. In Vietnam, the forestry and wood-processing Indus- tries have made major advances in the last 20 years. The area of plantation forest increased from only about 0.2 M ha in 1992 to 1.7 M ha in 2006 [14] and to 2.77 M ha in 2008 [15]. The wood-processing industry expanded rap- idly in the first decade of the 2000s. The average growth of export revenue was more than 30% annually during 2001-2007. Total export revenue was 61 million USD in 1996, 1.55 billion USD in 2005, 2.2 billion USD in 2006 and 3.2 billion USD in 2008. However, as in other de- veloping countries, these achievements were much lower than what the national government had planned. In 2005, only two new wood-processing enterprises were built in northern Vietnam, in comparison to the planned 14 new enterprises. The plan of building a state-owned paper factory in Kon Tum province was abandoned in 2003 due to the lack of raw materials [16]. The annual growth of the area of planted production forest in Vietnam was only 4%, compared with the planned growth of 6% in the 1998-2008 periods. In 2006, 80% of the wood require- ment for the furniture sub-industry was imported. The GoV had to adjust the planting area target of 5 M ha to only 3 M ha in 2010 [17]. Spatial equilibrium modeling provides an appropriate framework for analysis of national forestry policies. A theoretical spatial equilibrium model with linear supply and demand functions was developed by Takayama and Judge, initially in 1964 and fully in 1973 [18]. The theo- retical model inspired many studies for various products and policies, for example Adams et al. [19] for timber in north America, Jae [20] for southern pine lumber in the USA, Goletti et al. [21] for the rice sector in Vietnam, Kawaguchi et al. [22] for milk markets in the Japanese dairy industry, Yoshimoto et al. [23] for Japanese timber markets, Agrifood Consulting International for the lives- tock sector in Vietnam [24], Stennes et al. [25] for lumber in the USA and Canada, and Devadoss et al. [26] for softwood lumber in the USA, Canada, Mexico, China, Japan, New Zealand, Australia and European Union. per spatial equilibrium modelling (SEM) is used to explain why there is a gap between plans and observed growth for the forestry and wood products industries in northern Vietnam and to draw policy implications from SEM applications. The next sections describe notable factors—that were not considered by the GoV—affect- ing the supply targets, as well as the structure of the spa- tial equilibrium model developed. The method of data collection and contents of four policy scenarios are pre- sented, and sensitivity testing relation to elasticity esti-  P. S. HIEU ET AL. Copyright © 2011 SciRes. ME 92 mates is described. Finally the interpretation of optimal solutions generated between the four policy scenarios is examined and policy implications are drawn. 2. Factors Affecting the Government of Vietnam’s Supply Targets for Wood and Wood-Processing Products Many factors that were not taken into account by the GoV in 2006 can affect supply targets for the forestry sector. Three main factors are clearly identified by re- search conducted by Katja et al. [27], Barney [29] and GTZ [28], namely the change of import taxes, the rela- tionship between design production capacities of paper factories and average production cost, and distances be- tween wood-processing factories and unit transportation costs. 2.1. Declining Protection for Domestic Wood Industries Vietnam’s trade policy has changed greatly since 1994 when the USA discontinued their embargo on Vietnam’s international trade. In 1995, Vietnam became an official member of the Association of South East Asia Nations (ASEAN) and joined the ASEAN Free Trade Associa- tion (AFTA). By 2006, Vietnam had implemented provi- sions of AFTA of reducing tariffs on imported products typically ranging from 30% to 100%, to less than 5%, including the import taxes on paper and furniture prod- ucts from ASEAN. In 1998, Vietnam became an official member of the Asia Pacific Economic Cooperation (APEC). In 2000, the USA normalised its relationship with Vietnam in terms of bilateral trade policies. In De- cember 2006, Vietnam was accepted as an official member of the World Trade Organization (WTO). All these changes have made Vietnam’s trade policies more consistent with world trade policies. Import and export taxes have been reduced, and are planned to be gradually further reduced to from 0% to 5% by 2015. Import taxes on paper in 2008 (40%) and furniture products in 2008 (33%) from non-ASEAN countries were also reduced to only 5% in 2010 [29,30]. The declining prices of these products have gradually affected the supply quantities of most domestic factories, for instance reducing the do- mestic supply quantities of paper products. 2.2. High Average Production Costs and Low Design Production Capacities of Domestic Paper Factories Wood-processing factories in Vietnam have relatively low production scales in terms of capital investment, number of employees and design production capacity. The design production capacities of paper factories vary greatly, from only 1000 tonnes up to 300,000 tonnes per year. For example, although Vietnam has about 300 pa- per enterprises which could produce in total about 950 000 tonnes of paper in 2006, the three largest state- owned paper enterprises, namely Bai Bang, Tan Mai and Dong Nai, accounted for more than 50% of the total pa- per production in Vietnam in 2000 [29], and 40% in 2006. The supply quantities of the above three largest paper factories were about 200,000, 140,000 and 50,000 tonnes respectively in 2006 [6]. According to Roda et al. [31], only 20 paper factories had design production capacities exceeding 10,000 tonnes a year. Therefore, the domestic production cost of paper varied greatly, from 764 to 877 USD per tonne, while the average production cost of paper products in ASEAN countries was only 685 USD per tonne in 2006 [32]. The Cost Insurance and Freight (CIF) prices of pa- per products imported from Indonesia and Thailand through Vietnam seaports ranged from 822 to 842 USD per tonne in 2006 [32]. Therefore, domestic paper prod- ucts can be competitive only if taxes on imports are suf- ficiently high; otherwise, only large-scale pulp and paper factories are competitive. For example, the production cost of Bai Bang state-owned paper enterprise (BA- PACO) in 2006 was 764 USD per tonne. According to Katja et al. [27] and GTZ (2007) [28], the design pro- duction capacities of paper factories should be at least 300,000 tonnes a year to achieve sufficient economies of scale for international price competitiveness. 2.3. Spatial Distribution of Wood-Processing Factories and Proximity to Timber Resources The spatial locations of wood-processing factories and their proximities to timber resources affect the supply quantities of timber and wood-processing products and their prices. For example, if other factors are constant, the more factories are built in one area of timber resource the greater the demand for timber and the higher the timber prices will be. If the number of wood-processing factories is too great and the supply of timber is limited, the prices of timber will increase and the timber quantity purchased by each factory will fall. Consequently, the supply quantity and price of a wood-processing product from each factory declines while its average production cost increases. If the price is lower than the average pro- duction cost for a new factory, the new factory should not be built. The GoV’s plan to build wood-processing factories did not take into sufficient consideration the distance between factories and wood plantation size. 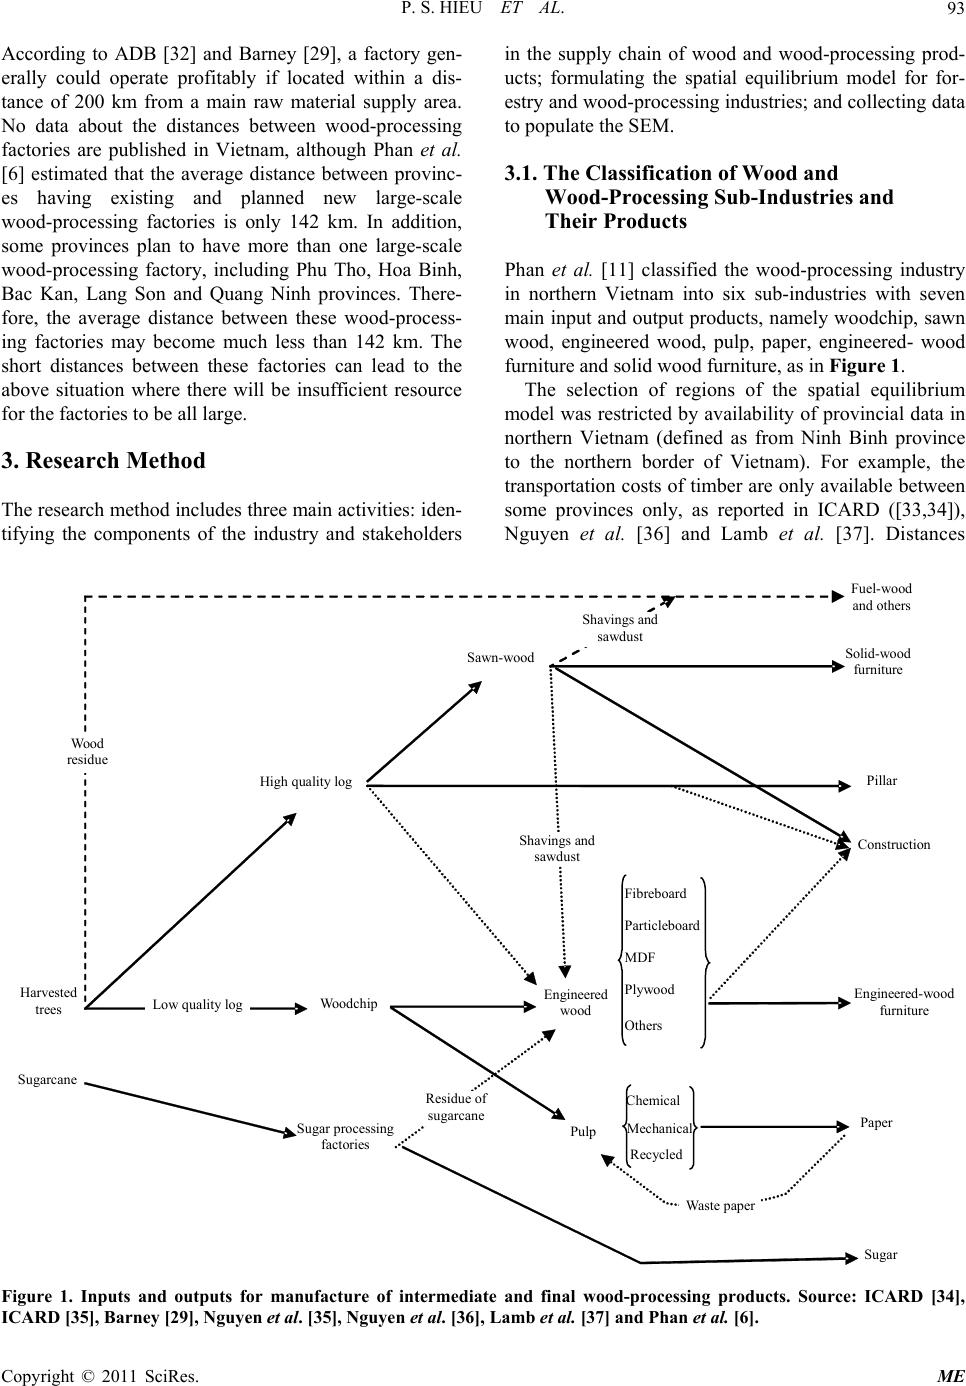 P. S. HIEU ET AL. Copyright © 2011 SciRes. ME 93 According to ADB [32] and Barney [29], a factory gen- erally could operate profitably if located within a dis- tance of 200 km from a main raw material supply area. No data about the distances between wood-processing factories are published in Vietnam, although Phan et al. [6] estimated that the average distance between provinc- es having existing and planned new large-scale wood-processing factories is only 142 km. In addition, some provinces plan to have more than one large-scale wood-processing factory, including Phu Tho, Hoa Binh, Bac Kan, Lang Son and Quang Ninh provinces. There- fore, the average distance between these wood-process- ing factories may become much less than 142 km. The short distances between these factories can lead to the above situation where there will be insufficient resource for the factories to be all large. 3. Research Method The research method includes three main activities: iden- tifying the components of the industry and stakeholders in the supply chain of wood and wood-processing prod- ucts; formulating the spatial equilibrium model for for- estry and wood-processing industries; and collecting data to populate the SEM. 3.1. The Classification of Wood and Wood-Processing Sub-Industries and Their Products Phan et al. [11] classified the wood-processing industry in northern Vietnam into six sub-industries with seven main input and output products, namely woodchip, sawn wood, engineered wood, pulp, paper, engineered- wood furniture and solid wood furniture, as in Figure 1. The selection of regions of the spatial equilibrium model was restricted by availability of provincial data in northern Vietnam (defined as from Ninh Binh province to the northern border of Vietnam). For example, the transportation costs of timber are only available between some provinces only, as reported in ICARD ([33,34]), Nguyen et al. [36] and Lamb et al. [37]. Distances Construction Engineered-wood furniture Fuel-wood and others Pillar Sugar Solid-wood furniture Paper En gineered wood MDF Particleboard Fib r eboar d Plywood Others Sawn-wood Shavings and sawdust Shavings and sawdust Residue of sugarcane High quality log Low quality logWood chip Wood residue Sugarcane Sugar processing factories Harvested trees Pulp Chemical Mechanical Recycled Waste paper Figure 1. Inputs and outputs for manufacture of intermediate and final wood-processing products. Source: ICARD [34], ICARD [35], Barney [29], Nguyen et al. [35], Nguyen et al. [36], Lamb et al. [37] and Phan et al. [6]. 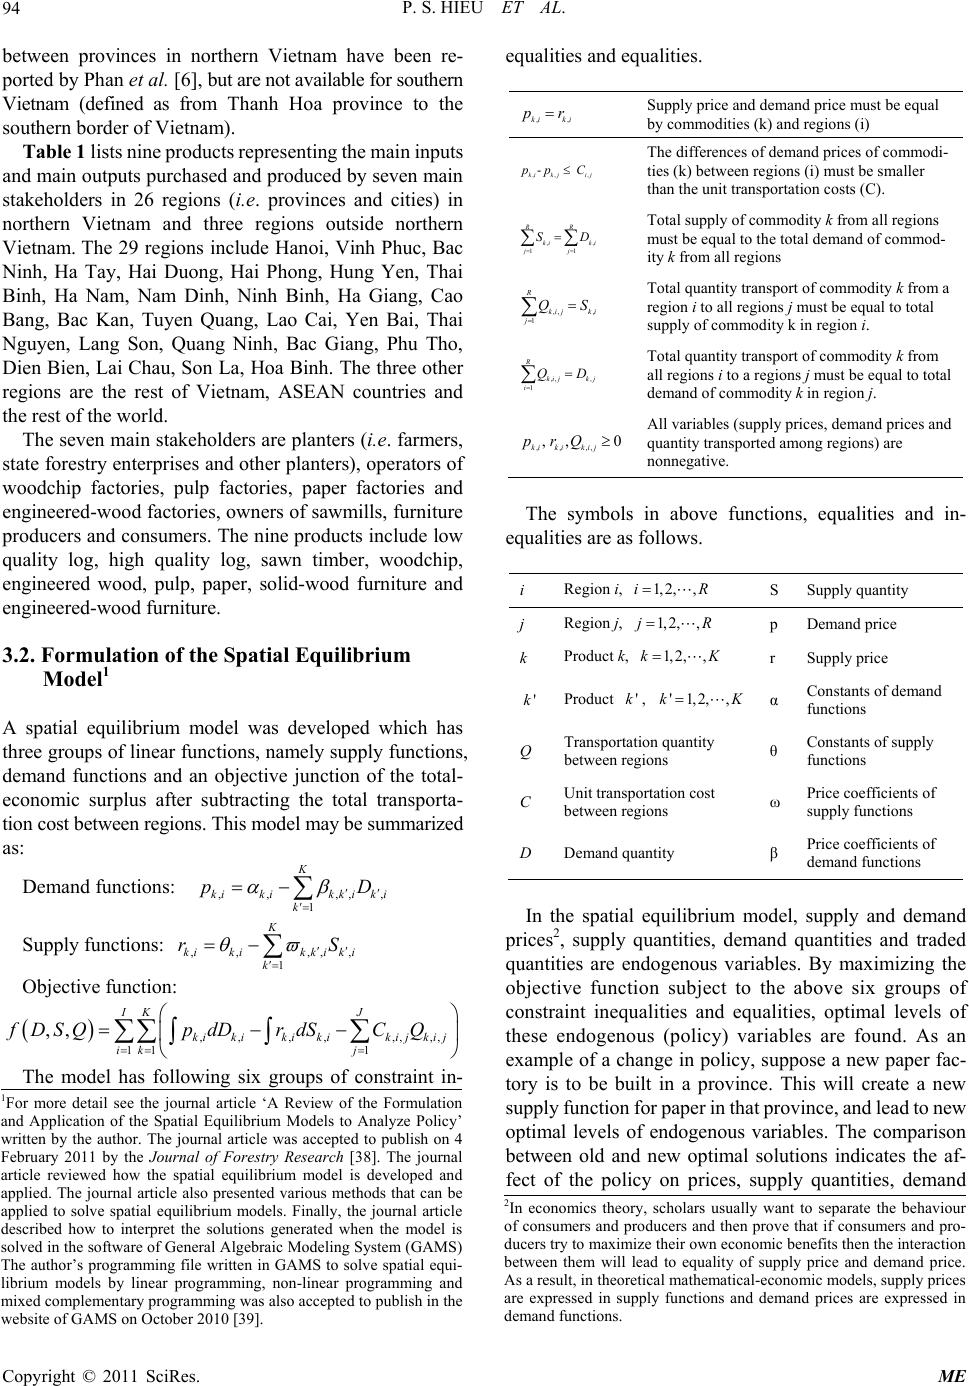 P. S. HIEU ET AL. Copyright © 2011 SciRes. ME 94 between provinces in northern Vietnam have been re- ported by Phan et al. [6], but are not available for southern Vietnam (defined as from Thanh Hoa province to the southern border of Vietnam). Table 1 lists nine products representing the main inputs and main outputs purchased and produced by seven main stakeholders in 26 regions (i.e. provinces and cities) in northern Vietnam and three regions outside northern Vietnam. The 29 regions include Hanoi, Vinh Phuc, Bac Ninh, Ha Tay, Hai Duong, Hai Phong, Hung Yen, Thai Binh, Ha Nam, Nam Dinh, Ninh Binh, Ha Giang, Cao Bang, Bac Kan, Tuyen Quang, Lao Cai, Yen Bai, Thai Nguyen, Lang Son, Quang Ninh, Bac Giang, Phu Tho, Dien Bien, Lai Chau, Son La, Hoa Binh. The three other regions are the rest of Vietnam, ASEAN countries and the rest of the world. The seven main stakeholders are planters (i.e. farmers, state forestry enterprises and other planters), operators of woodchip factories, pulp factories, paper factories and engineered-wood factories, owners of sawmills, furniture producers and consumers. The nine products include low quality log, high quality log, sawn timber, woodchip, engineered wood, pulp, paper, solid-wood furniture and engineered-wood furniture. 3.2. Formulation of the Spatial Equilibrium Model1 A spatial equilibrium model was developed which has three groups of linear functions, namely supply functions, demand functions and an objective junction of the total- economic surplus after subtracting the total transporta- tion cost between regions. This model may be summarized as: Demand functions: ,, ,,, 1 K kikikk ik i k pD Supply functions: ,, ,,, 1 K kikikk ik i k rS Objective function: ,,,,,, ,, 11 1 ,, IK J kikikikikij kij ik j fDSQpdDrdSC Q The model has following six groups of constraint in- equalities and equalities. ,,ki ki p r Supply price and demand price must be equal by commodities (k) and regions (i) ,, , - kik ji j pp C The differences of demand prices of commodi- ties (k) between regions (i) must be smaller than the unit transportation costs (C). ,, 11 RR ki ki jj SD Total supply of commodity k from all regions must be equal to the total demand of commod- ity k from all regions ,, , 1 R kij ki j QS Total quantity transport of commodity k from a region i to all regions j must be equal to total supply of commodity k in region i. ,, , 1 R ki jk j i QD Total quantity transport of commodity k from all regions i to a regions j must be equal to total demand of commodity k in region j. ,, ,, , ,0 ki kikij prQAll variables (supply prices, demand prices and quantity transported among regions) are nonnegative. The symbols in above functions, equalities and in- equalities are as follows. i Region i, 1, 2,,iR S Supply quantity j Region j, 1,2,,jR p Demand price k Product k, 1,2,,kK r Supply price 'kProduct 'k, '1,2, ,kK α Constants of demand functions Q Transportation quantity between regions θ Constants of supply functions C Unit transportation cost between regions ω Price coefficients of supply functions D Demand quantity β Price coefficients of demand functions In the spatial equilibrium model, supply and demand prices2, supply quantities, demand quantities and traded quantities are endogenous variables. By maximizing the objective function subject to the above six groups of constraint inequalities and equalities, optimal levels of these endogenous (policy) variables are found. As an example of a change in policy, suppose a new paper fac- tory is to be built in a province. This will create a new supply function for paper in that province, and lead to new optimal levels of endogenous variables. The comparison between old and new optimal solutions indicates the af- fect of the policy on prices, supply quantities, demand 1For more detail see the journal article ‘A Review of the Formulation and Application of the Spatial Equilibrium Models to Analyze Policy’ written by the author. The journal article was accepted to publish on 4 February 2011 by the Journal of Forestry Research [38]. The journal article reviewed how the spatial equilibrium model is developed and applied. The journal article also presented various methods that can be applied to solve spatial equilibrium models. Finally, the journal article described how to interpret the solutions generated when the model is solved in the software of General Algebraic Modeling System (GAMS) The author’s programming file written in GAMS to solve spatial equi- librium models by linear programming, non-linear programming and mixed complementary programming was also accepted to publish in the website of GAMS on October 2010 [39]. 2In economics theory, scholars usually want to separate the behaviou r of consumers and producers and then prove that if consumers and pro- ducers try to maximize their own economic benefits then the interaction b etween them will lead to equality of supply price and demand price. As a result, in theoretical mathematical-economic models, supply prices are expressed in supply functions and demand prices are expressed in demand functions. 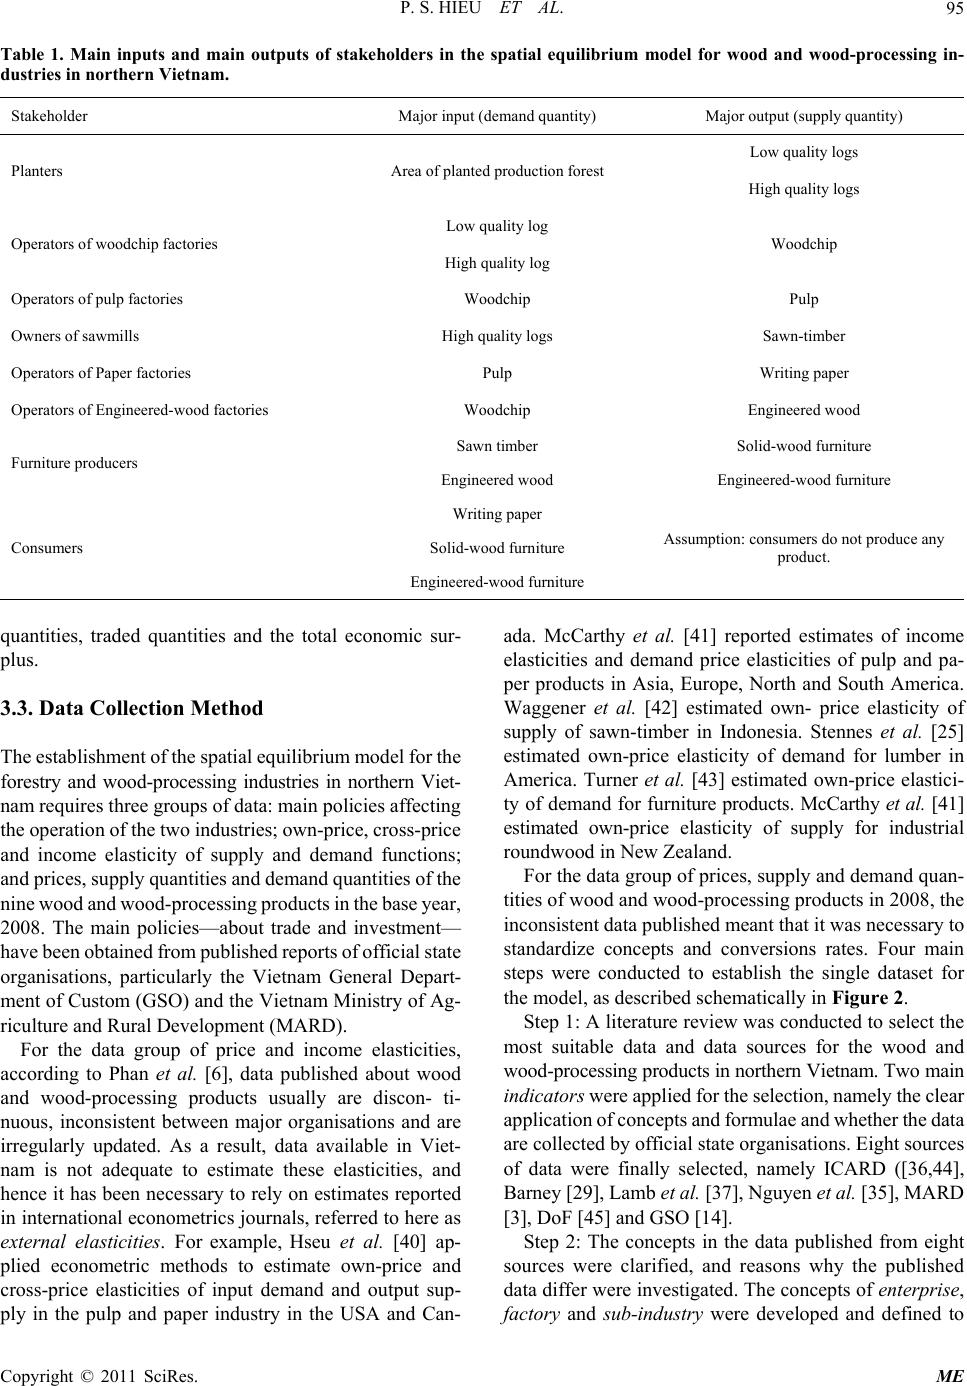 P. S. HIEU ET AL. Copyright © 2011 SciRes. ME 95 Table 1. Main inputs and main outputs of stakeholders in the spatial equilibrium model for wood and wood-processing in- dustries in northern Vietnam. Stakeholder Major input (demand quantity) Major output (supply quantity) Planters Area of planted production forest Low quality logs High quality logs Operators of woodchip factories Low quality log Woodchip High quality log Operators of pulp factories Woodchip Pulp Owners of sawmills High quality logs Sawn-timber Operators of Paper factories Pulp Writing paper Operators of Engineered-wood factories Woodchip Engineered wood Furniture producers Sawn timber Solid-wood furniture Engineered wood Engineered-wood furniture Consumers Writing paper Assumption: consumers do not produce any product. Solid-wood furniture Engineered-wood furniture quantities, traded quantities and the total economic sur- plus. 3.3. Data Collection Method The establishment of the spatial equilibrium model for the forestry and wood-processing industries in northern Viet- nam requires three groups of data: main policies affecting the operation of the two industries; own-price, cross-price and income elasticity of supply and demand functions; and prices, supply quantities and demand quantities of the nine wood and wood-processing products in the base year, 2008. The main policies—about trade and investment— have been obtained from published reports of official state organisations, particularly the Vietnam General Depart- ment of Custom (GSO) and the Vietnam Ministry of Ag- riculture and Rural Development (MARD). For the data group of price and income elasticities, according to Phan et al. [6], data published about wood and wood-processing products usually are discon- ti- nuous, inconsistent between major organisations and are irregularly updated. As a result, data available in Viet- nam is not adequate to estimate these elasticities, and hence it has been necessary to rely on estimates reported in international econometrics journals, referred to here as external elasticities. For example, Hseu et al. [40] ap- plied econometric methods to estimate own-price and cross-price elasticities of input demand and output sup- ply in the pulp and paper industry in the USA and Can- ada. McCarthy et al. [41] reported estimates of income elasticities and demand price elasticities of pulp and pa- per products in Asia, Europe, North and South America. Waggener et al. [42] estimated own- price elasticity of supply of sawn-timber in Indonesia. Stennes et al. [25] estimated own-price elasticity of demand for lumber in America. Turner et al. [43] estimated own-price elastici- ty of demand for furniture products. McCarthy et al. [41] estimated own-price elasticity of supply for industrial roundwood in New Zealand. For the data group of prices, supply and demand quan- tities of wood and wood-processing products in 2008, the inconsistent data published meant that it was necessary to standardize concepts and conversions rates. Four main steps were conducted to establish the single dataset for the model, as described schematically in Figure 2. Step 1: A literature review was conducted to select the most suitable data and data sources for the wood and wood-processing products in northern Vietnam. Two main indicators were applied for the selection, namely the clear application of concepts and formulae and whether the data are collected by official state organisations. Eight sources of data were finally selected, namely ICARD ([36,44], Barney [29], Lamb et al. [37], Nguyen et al. [35], MARD [3], DoF [45] and GSO [14]. Step 2: The concepts in the data published from eight sources were clarified, and reasons why the published data differ were investigated. The concepts of enterprise, factory and sub-industry were developed and defined to 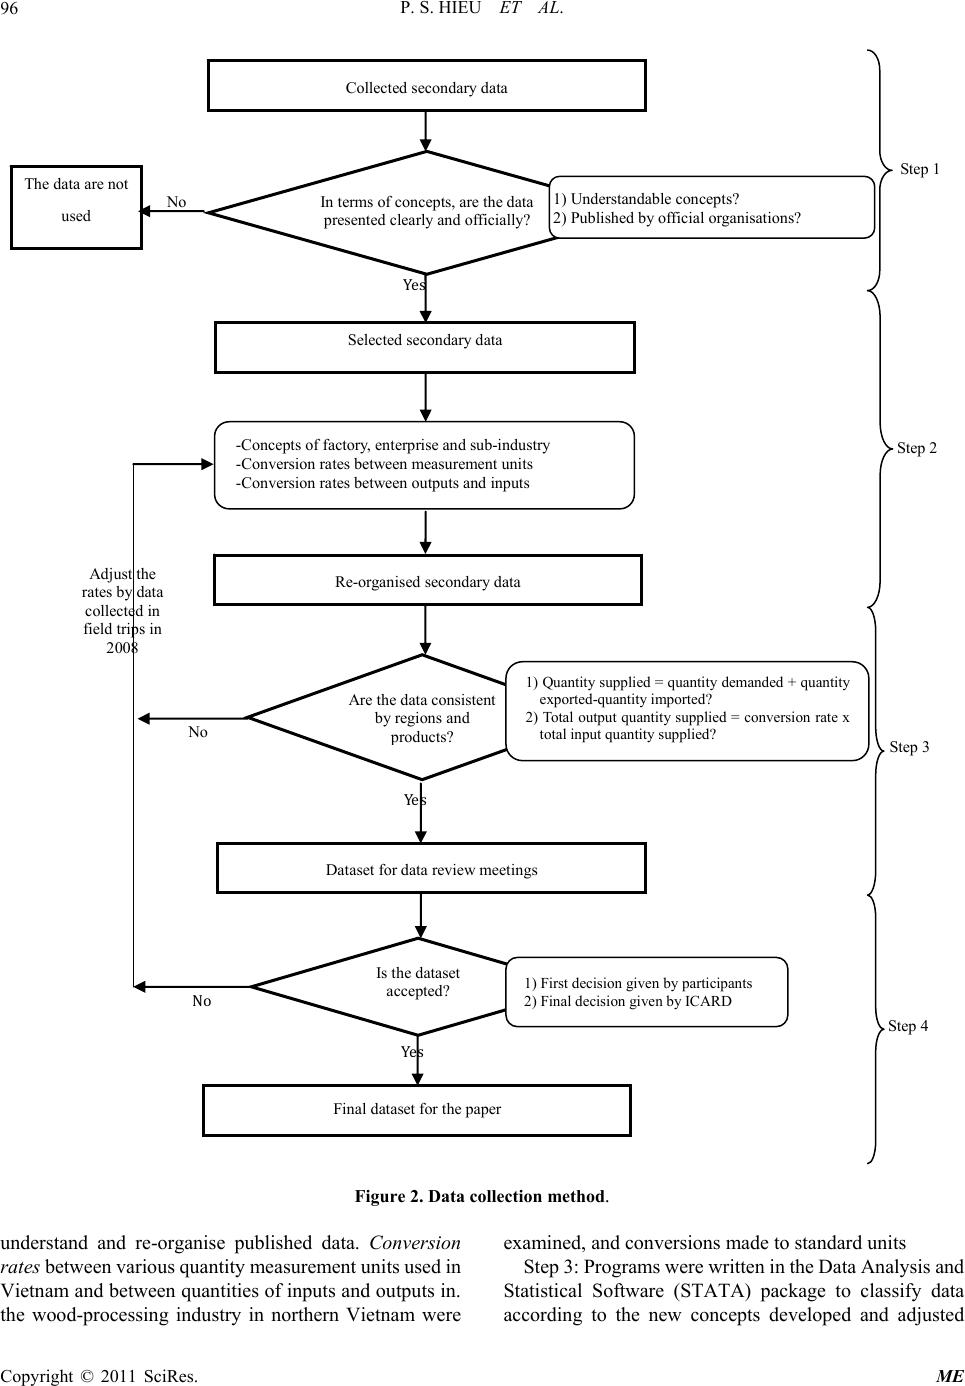 P. S. HIEU ET AL. Copyright © 2011 SciRes. ME 96 Ye s Selected secondary data -Concepts of factory, enterprise and sub-industry -Conversion rates between measurement units -Conversion rates between outputs and inputs No Adjust the rates by data collected in field trips in 2008 No Ye s Final dataset for the paper Dataset for data review meetings Are the data consistent by regions and p roduct s? 1) Quantity supplied = quantity demanded + quantity exported-quantity imported? 2) Total output quantity supplied = conversion rate x total input quantity supplied? Is the dataset accepted? Re-organised secondary data Step 4 Step 3 Step 2 Step 1 In terms of concepts, are the data presented clearly and officially? No The data are not used Collected secondary data Ye s 1) Understandable concepts? 2) Published by official organisations? 1) First decision given by participants 2) Final decision given by ICARD Figure 2. Data collection method. understand and re-organise published data. Conversion rates between various quantity measurement units used in Vietnam and between quantities of inputs and outputs in. the wood-processing industry in northern Vietnam were examined, and conversions made to standard units Step 3: Programs were written in the Data Analysis and Statistical Software (STATA) package to classify data according to the new concepts developed and adjusted 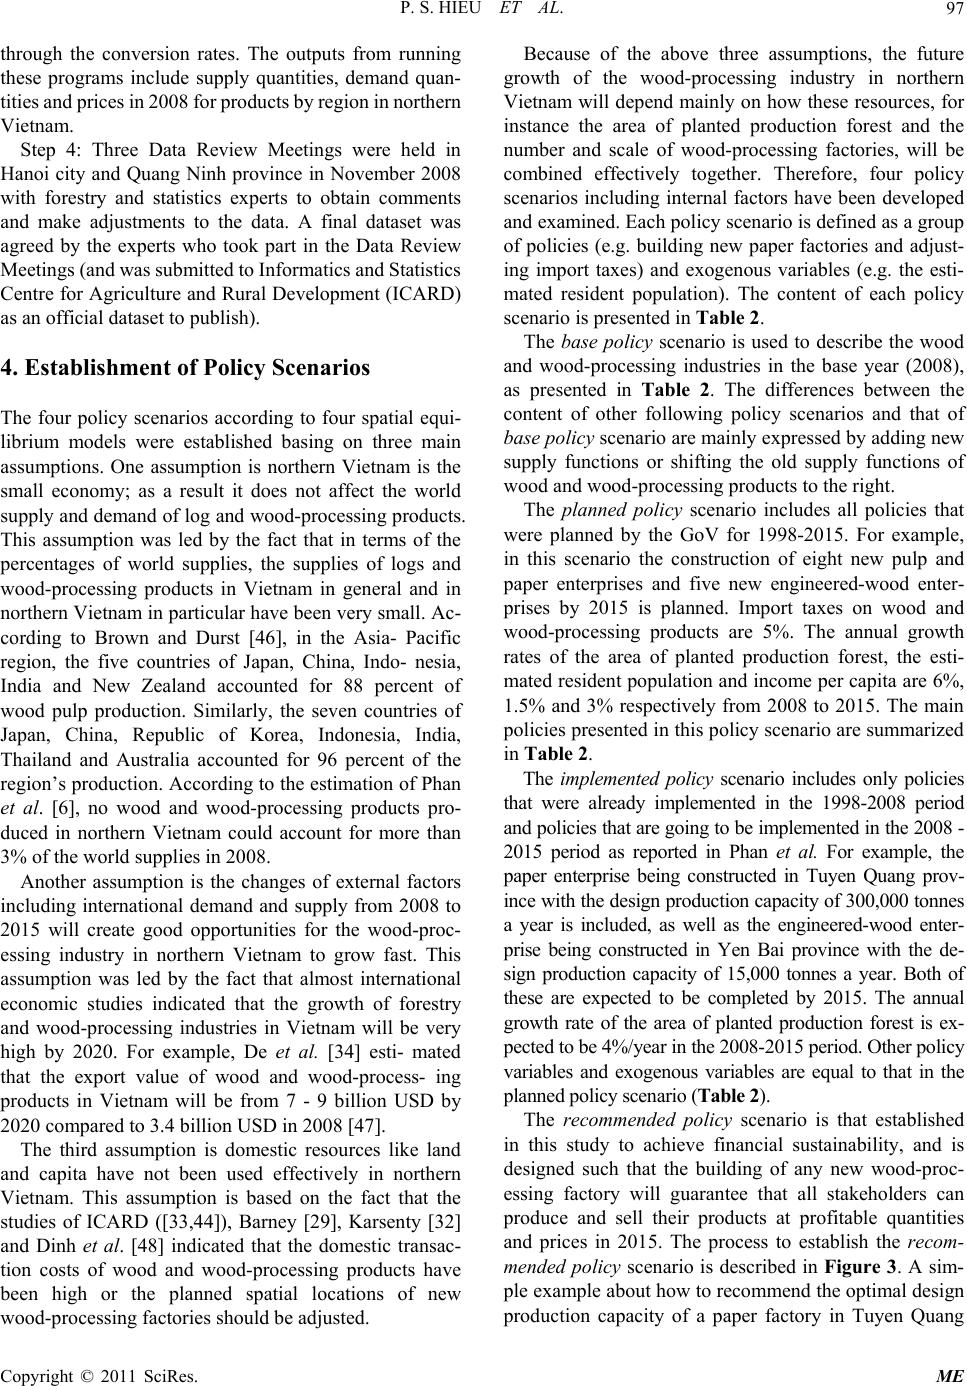 P. S. HIEU ET AL. Copyright © 2011 SciRes. ME 97 through the conversion rates. The outputs from running these programs include supply quantities, demand quan- tities and prices in 2008 for products by region in northern Vietnam. Step 4: Three Data Review Meetings were held in Hanoi city and Quang Ninh province in November 2008 with forestry and statistics experts to obtain comments and make adjustments to the data. A final dataset was agreed by the experts who took part in the Data Review Meetings (and was submitted to Informatics and Statistics Centre for Agriculture and Rural Development (ICARD) as an official dataset to publish). 4. Establishment of Policy Scenarios The four policy scenarios according to four spatial equi- librium models were established basing on three main assumptions. One assumption is northern Vietnam is the small economy; as a result it does not affect the world supply and demand of log and wood-processing products. This assumption was led by the fact that in terms of the percentages of world supplies, the supplies of logs and wood-processing products in Vietnam in general and in northern Vietnam in particular have been very small. Ac- cording to Brown and Durst [46], in the Asia- Pacific region, the five countries of Japan, China, Indo- nesia, India and New Zealand accounted for 88 percent of wood pulp production. Similarly, the seven countries of Japan, China, Republic of Korea, Indonesia, India, Thailand and Australia accounted for 96 percent of the region’s production. According to the estimation of Phan et al. [6], no wood and wood-processing products pro- duced in northern Vietnam could account for more than 3% of the world supplies in 2008. Another assumption is the changes of external factors including international demand and supply from 2008 to 2015 will create good opportunities for the wood-proc- essing industry in northern Vietnam to grow fast. This assumption was led by the fact that almost international economic studies indicated that the growth of forestry and wood-processing industries in Vietnam will be very high by 2020. For example, De et al. [34] esti- mated that the export value of wood and wood-process- ing products in Vietnam will be from 7 - 9 billion USD by 2020 compared to 3.4 billion USD in 2008 [47]. The third assumption is domestic resources like land and capita have not been used effectively in northern Vietnam. This assumption is based on the fact that the studies of ICARD ([33,44]), Barney [29], Karsenty [32] and Dinh et al. [48] indicated that the domestic transac- tion costs of wood and wood-processing products have been high or the planned spatial locations of new wood-processing factories should be adjusted. Because of the above three assumptions, the future growth of the wood-processing industry in northern Vietnam will depend mainly on how these resources, for instance the area of planted production forest and the number and scale of wood-processing factories, will be combined effectively together. Therefore, four policy scenarios including internal factors have been developed and examined. Each policy scenario is defined as a group of policies (e.g. building new paper factories and adjust- ing import taxes) and exogenous variables (e.g. the esti- mated resident population). The content of each policy scenario is presented in Table 2. The base policy scenario is used to describe the wood and wood-processing industries in the base year (2008), as presented in Table 2. The differences between the content of other following policy scenarios and that of base policy scenario are mainly expressed by adding new supply functions or shifting the old supply functions of wood and wood-processing products to the right. The planned policy scenario includes all policies that were planned by the GoV for 1998-2015. For example, in this scenario the construction of eight new pulp and paper enterprises and five new engineered-wood enter- prises by 2015 is planned. Import taxes on wood and wood-processing products are 5%. The annual growth rates of the area of planted production forest, the esti- mated resident population and income per capita are 6%, 1.5% and 3% respectively from 2008 to 2015. The main policies presented in this policy scenario are summarized in Table 2. The implemented policy scenario includes only policies that were already implemented in the 1998-2008 period and policies that are going to be implemented in the 2008 - 2015 period as reported in Phan et al. For example, the paper enterprise being constructed in Tuyen Quang prov- ince with the design production capacity of 300,000 tonnes a year is included, as well as the engineered-wood enter- prise being constructed in Yen Bai province with the de- sign production capacity of 15,000 tonnes a year. Both of these are expected to be completed by 2015. The annual growth rate of the area of planted production forest is ex- pected to be 4%/year in the 2008-2015 period. Other policy variables and exogenous variables are equal to that in the planned policy scenario (Table 2). The recommended policy scenario is that established in this study to achieve financial sustainability, and is designed such that the building of any new wood-proc- essing factory will guarantee that all stakeholders can produce and sell their products at profitable quantities and prices in 2015. The process to establish the recom- mended policy scenario is described in Figure 3. A sim- ple example about how to recommend the optimal design production capacity of a paper factory in Tuyen Quang  P. S. HIEU ET AL. Copyright © 2011 SciRes. ME 98 Table 2. Main contents of the four policy scenarios. Content Base policy scenario Planned policy scenario Implemented policy scenario Recommended policy scenario Description Includes only policies implemented in the 1998-2008 period Includes all policies planned to implement in the 1998-2015 period. Includes only policies implemented by the GoV in 1998-2008 period. Includes only policies implemented by the GoV in the 1998-2008 period. Includes only policies being certainly implemented between 2008 and 2015. Includes only policies suggested by the relationship between prices, production costs and design production capacities of wood-processing factories. Includes only policies being implemented between 2008 and 2015. New enterprises Eight new pulp and paper enterprises will be completed and commence operation in 2015. Five new engineeredwood enterprises will be completed and commence operation in 2015. Tuyen Quang paper en- terprise with the design production capacity of 300,000 tonnes a year will be completed and com- mence operation in 2015. One engineered-wood enterprise with the design production capacity of 15,000 tonnes a year in Yen Bai province will be completely and commence operation in 2015. Tuyen Quang paper enterprise with the design production capacity of 350,000 tonnes a year will be completed and commence operation in 2015. One engineered-wood enterprise with the design production capacity of 50,000 tonnes a year in Yen Bai province will be completed and commence operation in 2015. One engineered-wood enterprise with the design production capacity of 50,000 tonnes a year in Bac Giang province will be completed and commence operation in 2015. Five woodchip factories with each design production capacity of 10,000 tonnes will be completed and commence operation in Lao Cai, Lai Chau, Son La, Dien Bien and Ha Giang provinces Existing large-scale enterprises Design production capacity of Bai Bang paper factory was 300,000 tonnes/year in 2008. Design production capacity of Bai Bang pulp factory is 165,000 tonnes/year in 2008. Design production capacity of Bai Bang paper enterprise will still be 300,000 tonnes/year in 2010. Design production capacity of Bai Bang pulp factory will be 185,000 tonnes/year in 2010. Design production capacity of Bai Bang paper factory will still be 300,000 tonnes/year in 2015. Design production capacity of Bai Bang pulp factory will be 185,000 tonnes/year in 2010. Design production capacity of Bai Bang paper enterprise will be 350,000 tonnes/year in 2015. The operation of existing small-scale paper factories in Phu Tho and Hoa Binh provinces will be ceased in 2015. Trade policies applied for non-ASEA N countries Import taxes on paper products were 40% in 2008. Import taxes on paper products will be 5% in 2010. Import taxes on furniture products were 33% in 2008. Import taxes on furniture products will be 5% in 2010. Area of planted production forest The base level in 2008 The annual growth will be about 6% per year in the 2008-2015 period. The annual growth will be about 4% per year in the 2008-2015 period. Population The base level in 2008 The annual growth will be 1.5% from 2008 to 2015 Income per capita The base level in 2008 The annual growth will be 3% from 2008 to 2015.  P. S. HIEU ET AL. Copyright © 2011 SciRes. ME 99 Ye s Recommended scenario - Are optimal prices greater than average production costs? - Are optimal supply quantities greater than the minimum profitable supply quantities? No Analysing and adjusting scenarios CONOPT solver command in GAMS Demand constant coefficients Transportation cost Supply constant coefficients Supply own-price and cross-price coefficients Demand own-price and cross-price and income coefficients Optimal supply prices Optimal demand prices Optimal supply quantities Optimal demand quantities Figure 3. Process to examine the optimal levels and establish the content of building new wood-processing factories for the recommended policy scenario. province is conducted as in the following steps. A new factory will create a new supply curve of paper in Tuyen Quang province and its first design production capacity (e.g. 200,000 tonnes a year) determines a constant coef- ficient of the supply curve. The spatial equilibrium model with the first new supply curve identifies the optimal supply price and quantity of paper in Tuyen Quang prov- ince. The optimal solution of paper price is compared to the average production cost of 810 USD per tonne. The optimal solution of the paper supply quantity is compared to minimum profitable supply quantity of 130,000 tonnes a year (200,000 × 65%)3. If the optimal price is lower than the average production cost or the optimal supply quantity is lower than the profitable supply quantity, the first design production capacity is adjusted to the second design production capacity (e.g. 300,000 tonnes a year). The spatial equilibrium model with the second new supply curve identifies the optimal supply price and quantity of paper in Tuyen Quang province. The optimal price is compared to the average production cost of 760 USD per tonne and the optimal solution of the supply quantity is compared to the profitable supply quantity of 195,000 tonnes a year (300,000 × 65%). This process is continued until the two indicators are satisfied and then the optimal design production capacity of the paper fac- tory in Tuyen Quang province is recommended. A set of indicators has been devised which compares optimal levels of endogenous variables of prices and supply quantities generated with the national average production costs and profitable supply quantities (as presented in Table 3). In the recommended policy scenario, the paper enter- prise under construction in Tuyen Quang province will have the design production capacity of 350,000 tonnes a year in 2015. The engineered-wood enterprise being constructed in Yen Bai province will have the design production capacity of 50,000 tonnes a year in 2015. One new engineered-wood enterprise with the design produc- tion capacity of 50,000 tonnes a year will be built in Bac Giang province in 2015. Five new woodchip factories each with design production capacity of about 10,000 tonnes will be completed and commence operation in 2015 in the remote provinces of Lao Cai, Lai Chau, Son La, Dien Bien and Ha Giang. The design production ca- pacity of Bai Bang paper enterprise will be 350 000 ton- nes/year in 2015. Existing paper factories with the design production capacities of less than 100,000 tonnes a year will cease supplying paper products in 2015. Other vari- ables are equal to that in the implemented policy scenario. The contents of the third policy scenario are summarised in Table 2. To examine the effect of errors in estimates of elastic- ities on optimal solutions generated by solving these spa- 3The figure of 0.65 or 65% is the percentage of minimum profitable supply quantities of wood-processing factories compared to the design p roduction capacities of those factories.  P. S. HIEU ET AL. Copyright © 2011 SciRes. ME 100 Table 3. Indicators to examine optimal levels of endogenous variables and establish the recommended policy scenario. Indicator Product Value in 2008 Source Note The average production cost in 2008 Low quality log 12.12 USD per tonne [33,44] Re-estimated by participants in the three Data Review Meetings organised by Phan and his colleagues in Hanoi city and Quang Ninh province in November 2008 The average production cost in 2006 Paper produced by Bai Bang Paper Factory 764 USD per tonne [32] Paper produced by factories with design production capacities of less than 300 000 tonnes a year 805 - 842 USD per tonne [32] The profitable supply quantity Paper and engineered wood 65% of a factory’s design production capacity [49] tial equilibrium models, three sets of elasticity levels have been tested for each policy scenario: the external elasticities, all elasticities reduced by 30%, and all elas- ticities increased by 30%. 5. The Optimal Solutions and Their Interpretation By solving the spatial equilibrium model for the four policy scenarios, four optimal solutions have been gen- erated. These optimal solutions are compared between policy scenarios, supply targets and the two indicators of profitable prices and profitable supply quantities. Two products of low quality logs and paper are selected for these comparisons because the supply quantities of these two products are the most targeted by the GoV’s invest- ment policy on building new large-scale state-owned paper factories and expanding the area of planted pro- duction forest via the 5MHRP. In addition, the data about average production cost are only available for domestic low quality logs as reported in ICARD ([33,44]) and Phan et al. [6] and for domestic paper products as re- ported in Karsenty [32]. 5.1. The Optimal Levels of Prices and Average Production Costs of Low Quality Logs and Paper In the planned policy scenario, policies planned by the GoV will lead to two notable outcomes. First, optimal prices of most products in 2015 will be much higher than that in the base policy scenario in 2008, and higher than average production costs, except the optimal price for paper. Table 4 indicates that the selling price of low quality logs will be more than 30 USD per tonne—much higher than the average production cost of about 12 USD per tonne in 2008. Optimal prices in 2015 for low quality logs will be much higher in the provinces having new wood-processing factories including Lai Chau and Son La provinces. Second, eight in 10 paper factories—in- cluding seven of the eight new paper factories—will re- ceive unprofitable prices for their products because op- timal prices for paper will be lower than the average production costs of from 805 to 822 USD per tonne re- spectively in 2006 as reported in Karsenty [32]. In the implemented policy scenario, compared to pric- es in 2008, optimal prices in 2015 will be higher for woodchip, sawn timber, engineered wood, paper, solid- wood furniture and engineered-wood furniture in most provinces in northern Vietnam. Table 5 indicates that the optimal prices of paper products in 2015 will be at least about 852 USD per tonne and that will be much higher than the average production cost for paper products of between 805 and 822 USD per tonne. However, imple- mented policies will lead to optimal prices in 2015 of low quality logs of not more than the average production cost of about 12 USD per tonne in 2008 in seven prov- inces in northern Vietnam, namely Son La, Dien Bien, Lai Chau, Lao Cai, Cao Bang, Bac Kan and Ha Giang provinces. In the recommended policy scenario, compared to prices in 2008, optimal prices in 2015 will be higher for high and low quality logs, woodchip, sawn timber, engi- neered wood and furniture. An example is optimal prices of low quality logs presented in Table 4. In contrast, optimal prices of pulp and paper in 2015 will be much lower. Optimal prices of all products in 2015 will be higher than the average production costs in all 26 prov- inces in northern Vietnam. Examples are prices of low quality logs and paper presented in Table 4. 5.2. Optimal Supply Levels and Factory Design Production Capacities in 2015 In Table 5, the optimal supply levels in 2015 are com- pared to factories’ design production capacities in per- centages. In the planned policy scenario, planned policies result in percentages in 2015 which are mostly lower than the profitable figure of 65%. Planned new paper fac- tories will produce at unprofitable quantities in six prov-  P. S. HIEU ET AL. Copyright © 2011 SciRes. ME 101 Table 4. Optimal prices of low quality logs and paper generated by scenarios in r elevant provinces (USD per tonne). Province Base policy Scenario Planned policy scenario Implemented policy scenario Recommended policy scenario Prices of low quality logs in 2008 Optimal prices of low quality logs in 2015 Ha Giang 14.3 41.9 6.4 34.5 Cao Bang 14.4 37.2 11.6 22.5 Bac Kan 20.9 31.2 12.2 28.8 Lao Cai 12.0 35.2 3.3 24.5 Dien Bien 11.9 39.5 3.3 33.0 Lai Chau 7.9 34.2 0.0 27.7 Son La 16.1 32.4 7.4 37.9 Prices of paper in 2008 Optimal prices of paper in 2015 Bac Kan 837.3 787.3 863.0 808.6 Tuyen Quang 834.6 786.2 861.9 807.4 Lao Cai 843.9 777.2 852.8 798.4 Yen Bai 835.0 785.6 861.2 806.8 Lang Son 840.7 791.0 866.6 812.2 Bac Giang 836.0 793.6 866.6 814.9 Phu Tho 830.5 789.8 869.3 811.0 Dien Bien 843.9 778.2 865.4 799.4 Lai Chau 846.9 775.6 853.8 800.7 Son La 840.9 781.4 855.1 802.6 Hoa Binh 834.1 791.6 857.1 812.8 Table 5. Optimal supply quantities as percentages of design production capacities by scenarios in relevant provinces. Province or city Planned policy scenario Implemented policy scenario Recommended policy scenario Engineered wood Paper Engineered wood Paper Engineered wood Paper Hanoi 58.37 0.00 62.37 0.00 63.87 0.00 Bac Kan 118.18 58.68 0.00 0.00 0.00 0.00 Tuyen Quang 0.00 66.11 0.00 73.02 0.00 81.14 Lao Cai 0.00 55.42 0.00 0.00 0.00 0.00 Yen Bai 214.69 58.04 93.87 0.00 66.39 0.00 Lang Son 63.59 63.21 66.21 0.00 67.88 0.00 Quang Ninh 62.74 0.00 65.05 0.00 67.55 0.00 Bac Giang 169.19 65.33 0.00 0.00 65.72 0.00 Phu Tho 57.66 86.80 62.66 93.34 64.03 84.27 Lai Chau 0.00 60.00 0.00 0.00 0.00 0.00 Son La 0.00 61.22 0.00 0.00 0.00 0.00 Hoa Binh 117.00 86.57 62.97 93.24 64.46 0.00 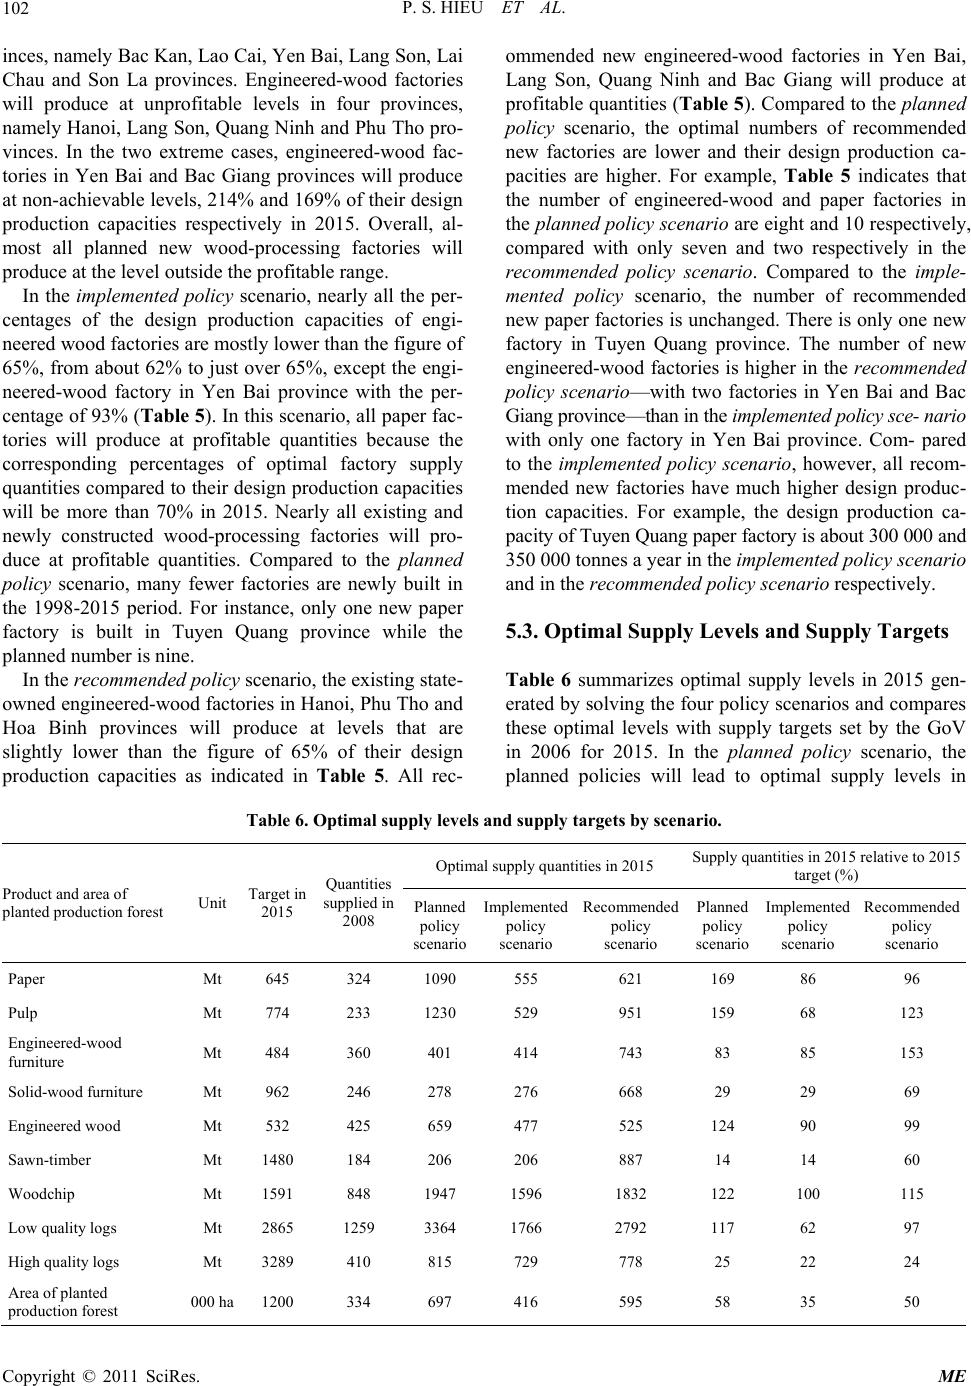 P. S. HIEU ET AL. Copyright © 2011 SciRes. ME 102 inces, namely Bac Kan, Lao Cai, Yen Bai, Lang Son, Lai Chau and Son La provinces. Engineered-wood factories will produce at unprofitable levels in four provinces, namely Hanoi, Lang Son, Quang Ninh and Phu Tho pro- vinces. In the two extreme cases, engineered-wood fac- tories in Yen Bai and Bac Giang provinces will produce at non-achievable levels, 214% and 169% of their design production capacities respectively in 2015. Overall, al- most all planned new wood-processing factories will produce at the level outside the profitable range. In the implemented policy scenario, nearly all the per- centages of the design production capacities of engi- neered wood factories are mostly lower than the figure of 65%, from about 62% to just over 65%, except the engi- neered-wood factory in Yen Bai province with the per- centage of 93% (Table 5). In this scenario, all paper fac- tories will produce at profitable quantities because the corresponding percentages of optimal factory supply quantities compared to their design production capacities will be more than 70% in 2015. Nearly all existing and newly constructed wood-processing factories will pro- duce at profitable quantities. Compared to the planned policy scenario, many fewer factories are newly built in the 1998-2015 period. For instance, only one new paper factory is built in Tuyen Quang province while the planned number is nine. In the recommended policy scenario, the existing state- owned engineered-wood factories in Hanoi, Phu Tho and Hoa Binh provinces will produce at levels that are slightly lower than the figure of 65% of their design production capacities as indicated in Table 5. All rec- ommended new engineered-wood factories in Yen Bai, Lang Son, Quang Ninh and Bac Giang will produce at profitable quantities (Table 5). Compared to the planned policy scenario, the optimal numbers of recommended new factories are lower and their design production ca- pacities are higher. For example, Table 5 indicates that the number of engineered-wood and paper factories in the planned policy scenario are eight and 10 respectively, compared with only seven and two respectively in the recommended policy scenario. Compared to the imple- mented policy scenario, the number of recommended new paper factories is unchanged. There is only one new factory in Tuyen Quang province. The number of new engineered-wood factories is higher in the recommended policy scenario—with two factories in Yen Bai and Bac Giang province—than in the implemented policy sce- nario with only one factory in Yen Bai province. Com- pared to the implemented policy scenario, however, all recom- mended new factories have much higher design produc- tion capacities. For example, the design production ca- pacity of Tuyen Quang paper factory is about 300 000 and 350 000 tonnes a year in the implemented policy scenario and in the recommended policy scenario respectively. 5.3. Optimal Supply Levels and Supply Targets Table 6 summarizes optimal supply levels in 2015 gen- erated by solving the four policy scenarios and compares these optimal levels with supply targets set by the GoV in 2006 for 2015. In the planned policy scenario, the planned policies will lead to optimal supply levels in Table 6. Optimal supply levels and supply tar gets by sc enario. Product and area of p lanted production fores t Unit Target in 2015 Quantities supplied in 2008 Optimal supply quantities in 2015 Supply quantities in 2015 relative to 2015 target (%) Planned policy scenario Implemented policy scenario Recommended policy scenario Planned policy scenario Implemented policy scenario Recommended policy scenario Paper Mt 645 324 1090 555 621 169 86 96 Pulp Mt 774 233 1230 529 951 159 68 123 Engineered-wood furniture Mt 484 360 401 414 743 83 85 153 Solid-wood furniture Mt 962 246 278 276 668 29 29 69 Engineered wood Mt 532 425 659 477 525 124 90 99 Sawn-timber Mt 1480 184 206 206 887 14 14 60 Woodchip Mt 1591 848 1947 1596 1832 122 100 115 Low quality logs Mt 2865 1259 3364 1766 2792 117 62 97 High quality logs Mt 3289 410 815 729 778 25 22 24 Area of planted production forest 000 ha 1200 334 697 416 595 58 35 50  P. S. HIEU ET AL. Copyright © 2011 SciRes. ME 103 2015 much higher than the planned quantities of paper and engineered wood but much lower than the planned quantities of sawn timber and solid-wood furniture. The estimation of the optimal area of planted production for- est depends on the average productivity of timber. How- ever, the statistical data reported about the average pro- ductivity per ha per year of timber trees planted in pro- duction forest differs between major data sources in Vietnam, for instance 8 - 10 m3 in 2000 [29], 20 - 25 m3 in some province [29], 8 m3 [33,44,45] and 4m3/ha/year [14]. According to Phan et al. [6], the average productiv- ities in 2008 were 6 m3 for Eucalyptus spp., 7 m3 for Aca- cia spp ., 5 m3 for Pinus spp., 4 m3 for Bambusoidae spp., and 5 m3 for Styrax tonkinensis. If the average productiv- ity of timber trees in planted production forest in north- ern Vietnam is about 6 m3/ha/year, the area of planted production forest in the planned policy scenario is pre- dicted to be about 658 000 ha. This area equals to about 58% of the area planned by the GoV in 2006 for 2015. In the implemented policy scenario, none of the supply targets for 2015 will be achieved, other than for wood- chip. The highest percentages of the supply targets will be for paper (86%), engineered-wood furniture (85%), engineered wood (90%) and woodchip (100%). The quantities supplied in 2015 of high quality logs, solid- wood furniture and sawn-timber will only equal to about 22%, 29% and 14% respectively of the supply targets. If the average productivity of timber trees in planted pro- duction forest in northern Vietnam is about 6 m3/ha/year, the area of planted production forest is predicted to be about 412 000 ha, equal to 35% of the area planned in 2006 for 2015. As percentages of the supply targets, most of the op- timal supply levels in 2015 generated by solving the spa- tial equilibrium model for the recommended policy sce- nario will be approximately equal to the supply targets, for instance 96% for paper, 99% for engineered wood, 97% for low quality logs, 123% for pulp and 115% for woodchip. The optimal supply level in 2015 for engi- neered-wood furniture will be about 50% higher than the supply target. The supply quantities planned by the GoV are highly ambitious for high quality logs, sawn timber and solid-wood furniture compared to the growth of these industries in the 1998-2008 period. The supply quantities in 2015 of these products will be still much lower than that planned by the GoV in 1998 for 2015, for instance, 69% for solid-wood furniture, 60% for sawn timber, 24% for high quality logs and 50% for the area of planted production forest. 5.4. Sensitivity Analysis Most of the above outcomes in each policy scenario hold for the elasticity scenarios of ‘+30%’ and ‘–30%’. For the comparisons between optimal prices and average productions costs, most new paper factories will receive unprofitable prices for their products in the planned pol- icy scenario. This outcome will worsen if the average production cost of paper in 2015 is 20% higher than that in 2008 due to the assumed annual inflation rate of 3.5% in Vietnam. In this situation, all existing and new paper factories in northern Vietnam will receive unprofitable prices for their products. Similarly, in the implemented policy scenario, optimal prices of low quality logs in 2015 generated for the lower and higher elasticity coeffi- cients will be lower than the average production cost of about 12 USD per tonne in 2008 to produce them in many provinces in northern Vietnam including Son La, Dien Bien and Lai Chau provinces. In addition, if the average production cost of low quality logs in 2015 is 20% higher than that in 2008 due to the assumed annual small inflation rate of 3.5% in Vietnam, farmers in 12 provinces in the total of 26 provinces in northern Viet- nam would receive unprofitable prices for their products. The changes of elasticities also have little effect on profitable supply quantities of new engineered-wood and paper factories in northern Vietnam. In the planned and implemented policy scenarios, the optimal levels of sup- ply quantities of engineered wood and paper produced by new factories are all lower than 65% of their design pro- duction capacities. The only case where the changes of elasticities only have profound effect on optimal supply quantity of solid- wood furniture in the planned policy scenario is where 30% higher elasticities increases the supply of solid- wood furniture in northern Vietnam by 47%. This effect is because the solid-wood furniture sub-industry has higher supply price coefficients than those of other sub- industries. Since 2000 about 50% of annual solid-wood furniture outputs of northern Vietnam have been ex- ported [6]. For example, the small changes of supply elasticities in China or those of demand elasticities in USA are predicted to affect profoundly the supply of the solid-wood furniture in northern Vietnam. 6. Concluding Comments The spatial equilibrium analysis indicates that the GoV’s historical plans for the forestry and wood-processing industries in northern Vietnam could not be achieved. The conclusion was tested by elasticity changes in each policy scenario. If all policies were implemented in the 2008-2015 period as planned in 2006, most planned new paper factories would receive unprofitable prices for their products in 2015. In the framework of currently implemented policies, the farm-gate prices of logs will  P. S. HIEU ET AL. Copyright © 2011 SciRes. ME 104 be lower than the average production costs to produce logs in many provinces in northern Vietnam in 2015. To transit to optimal plans as a longer-run objective, the GoV should adjust the policies planned in 2006 for 2015 and policies implemented in the 2008-2015 period. This would require an increase in design production capacity of existing larger-scale paper and engineered-wood fac- tories. Planned new small-scale paper factories with de- sign production capacities of less than 300,000 tonnes a year and engineered-wood factories with design produc- tion capacities of less than 50,000 tonnes a year should not be built. Closure of existing small-scale paper facto- ries of less than 50,000 tonnes by 2015 should be con- sidered. Consequently, the planned area of planted pro- duction forest in northern Vietnam should be less much than 900,000 ha, considerably lower than the planned level of about 1.2 million ha. 7. Acknowledgements Funding for this research from a John Allright Fellow- ship is gratefully acknowledged. I would like to thank Drs Sharon Brown and Peter Dart, at The University of Queensland for their advice and encouragement. I would also like to thank my colleagues working at various state organisations under MARD—including Dr. Trinh Duc Huy, Ms. Nguyen Thanh Huong, Mr. Vu Dinh Xuan, Ms. Vu Huong Thuy, Mr. Pham Duc Thuan, Mr. Le Thanh Van, Mr. An Van Khanh and Mr. Tran Lam Dong—for support in obtaining data and checking the consistency of data presented in this paper. 8. References [1] ICARD (Informatics and Statistics Center for Agriculture and Rural Development), “Assessing the Changes of In- stitution and Policy from Centrally Planning Economy to Market-Oriented Economy in the past 20 Years,” Infor- matics and Statistics Center for Agriculture and Rural De- velopment (ICARD), Hanoi, 2004. [2] T. Chakra, “Five Year Plans,” 2008. http://www.tradechakra.com/indian-economy/five-year-pl ans/index.html [3] MARD (Ministry of Agriculture and Rural Development), “Vietnam Forestry Development Strategy 2006-2020,” Agricultural Publishing House, Hanoi, 2007. [4] A. K. Joshi, P. Pant, P. Kumar, A. Giriraj and P. K. Joshi. “National Forest Policy in India: Critique of Targets and Implementation,” Small-Scale Forestry, Vol. 10, No. 1, September 2010, pp. 83-96. doi:10.1007/s11842-010-9133-z [5] BMoA (Royal Government of Bhutan Ministry of Agri- culture), “National Forest Policy,” 2008. http://www.moa.gov.bt/moa/downloads/downloadFiles/M oADownload3ea6992sr.pdf [6] S. H. Phan, H. T. Vu, D. T. Pham and T. V. Le, “Col- lected and Estimated Data for Wood and Wood-Processing Products in Northern Vietnam,” Infor- matics and Statistics Center for Agriculture and Rural Development (ICARD), Hanoi, 2008. [7] A .P. Carandang, “Forest Resource Assessment—Na- tional Forest Assessment: Forestry Policy Analysis: Phil- ippine,” Food and Agriculture Organization (FAO), 2005. http://www.fao.org/forestry/15461-1-84.pdf. [8] S. H. Phan, “The Changing Administration and the Role of Forestry in the Economy of Vietnam,” Small-Scale Forestry, Vol. 3, No 1, 2004, pp. 85-98. [9] DAFF (Australian Department of Agriculture, Fisheries and Forestry), “Regional Forest Agreements Home,” Australian Government, 2008. http://www.daff.gov.au/rfa/. [10] CMoE (Cambodian Ministry of Environment), “Cambo- dian National Environment Action Plan 1998 - 2002,” 1998. http://www.camdev.org/_publications/NEAP%20text-En glish.pdf. [11] S. H. Phan, H. T. Vu, D. T. Pham and T. V. Le, “Main Characteristics of Statistical Data and the Statistical Sys- tem for Wood and Wood-Processing Products in Viet- nam,” Small-Scale Forestry, Vol. 10, No. 2, September 2010, pp. 185-198. [12] D. Munkhzorig, “Report on National Forest and Water Policy of Mongolia,” Ministry of Nature and Environment, 2009. http://www.rinya.maff.go.jp/faw2002/17%20D.%20Mun khzorig%20(Mongolia).pdf. [13] D. S. Do and Q. T. Le, “Forest Policy Trends in Viet- nam,” The Forest Science Institute of Vietnam, Hanoi, 2001. [14] GSO (General Statistical Office of Vietnam), “Statistical Yearbook 2008,” General Statistical Office of Vietnam (GSO), Hanoi, 2008. [15] GSO (General Statistical Office of Vietnam), “Forest Status Classified by Provinces on 31 December 2008,” (Hiện trạng rừng có đến 31/12/2008 phân theo địa phương), 2010. http://www.gso.gov.vn/default.aspx?tabid=390&idmid=3 &ItemID=8752. [16] C. Lang, “Vietnam: Construction of Kon Tum Pulp and Paper Mill Suspended,” World Rainforest Movement, Montevideo, Uruguay, 2003. http://www.wrm.org.uy/bulletin/66/Vietnam.html. [17] C. Lang, “Vietnam: What is Happening in the Pulp and Paper Sector?” World Rainforest Movement, Montevi- deo, Uruguay, 2006. http://chrislang.org/2007/02/28/vietnam-whats-happening -in-the-pulp-and-paper-sector/. [18] B. A. McCarl and T. H. Spreen, “Applied Mathematical Programming Using Algebraic System,” Department of Agricultural Economics, Texas A&M University, College Station, 2002. http://agecon2.tamu.edu/people/faculty/mccarl-bruce/boo  P. S. HIEU ET AL. Copyright © 2011 SciRes. ME 105 ks.htm. [19] D. M. Adams and R. W. Haynes, “The 1980 Softwood Timber Assessment Market Model: Structure, Projections, and Policy Simulations,” Journal of Forest Science, Mo- nograph 22 (Supplement to Number 3), 1980, pp. a0001-z0001, [20] K. S. Jae, “A Spatial Equilibrium Analysis of Southern Pine Lumber Pricing and Allocation,” Journal of the An- nals of Regional S c i e nce, Vol. 19, No. 1, 1984, pp. 61-76. [21] F. Goletti, A. Raisuddin, N. Minot, P. Berry, B. Romeo, V. H. Nguyen and T. B. Nguyen, “Rice Market Monitor- ing and Policy Options Study,” International Food Policy Research Institute (IFPRI), 1996. [22] T. Kawaguchi, N. Suzuki and H. M. Kaiser, “A Spatial Equilibrium Model for Imperfectly Competitive Milk Markets,” American Journal of Agricultural Economics, Vol. 79, No. 3, 1997, pp. 851-859. doi:10.2307/1244426 [23] A. Yoshimoto and K. Yukutake, “Japanese Forest Sector Modeling through a Partial Equilibrium Model,” Forest Resource Use vs. Environmental Policy & Timber Trade, Vol. 7, No. 1, 2002, pp. 41-48. [24] ACI (Agrifood Consulting International), “Vietnam Live- stock Spatial Equilibrium Model (VILASEM),” the Document for a Training Course at the Informatics and Statistics Centre for Agriculture and Rural Development (ICARD), Hanoi, 2002. [25] B. Stennes and W. Bill, “An Analysis of Lumber Trade Restrictions in North America: Application of Spatial Equilibrium Model,” Canadian Journal of Forest Policy and Economics, Vol. 7, No. 3, 2005, pp. 297-308. doi:10.1016/S1389-9341(03)00067-4 [26] S. Devadoss, A. H. Aguiar., S. R. Shook and J. Araji, “A Spatial Equilibrium Analysis of U.S.-Canadian Disputes on the World Softwood Lumber Market,” Canadian Journal of Agricultural Economics, Vol. 53, No. 2-3, 2005, pp. 177-192. doi:10.1111/j.1744-7976.2005.04024.x [27] S. Katja and S. Jayant, “India’s Pulp and Paper Industry: Productivity and Energy Efficiency,” Ernest Orlando Lawrence Berkeley National Library, 1999. http://ies.lbl.gov/iespubs/41843.pdf. [28] GTZ (German Technical Development Cooperation Agency or Deutsche Gesellschaft für Technische Zusam- menarbeit), “Enterprises Operating in the Vietnam’s For- estry Industry: Current Characteristics and Challenges,” (Doanh Nghiep Hoat Dong trong Nganh Lam Nghiep Viet Nam – Hien Trang va Thach Thuc), Presentation at the Forum of Vietnam forestry, 2007. http://www.vietnamforestry.org.vn/PSC/VN/ForestryInve stmentForum2007/2_GTZ-Forestry percent20Enterprise percent20- percent20status percent20& percent20chal- lenges percent205May07 percent20final percent20draft_ VN_1.ppt [29] K. Barney, “Central Plans and Global Exports: Tracking Vietnam’s Forestry Commodity Chains and Export Links to China,” Forest Trends, Washington DC, 2005. [30] DoC (General Department of Custom of Vietnam), “Im- port and Export Taxes Applied in 2008,” (Bieu Thue Xuat Nhap Khau Viet Nam nam 2008), General Depart- ment of Custom of Vietnam (DoC), Hanoi, 2008. [31] J. M. Roda and R. Santosh, “Feeding China’s Expanding Demand for Wood Pulp: A Diagnostic Assessment of Plantation Development, Fiber Supply, and Impacts on Natural Forests in China and in the South East Asia Re- gion, Vietnam Report,” Center for International Forestry Research (CIFOR), 2006. http://hal.cirad.fr/docs/00/19/35/45/PDF/Vietnam.pdf. [32] A. Karsenty, “Study on the Impacts of Market and In- vestment Liberalization on Vietnam’s Pulp and Planta- tions Sector, with Particular Reference to China,” Viet- nam Report, Center for International Forestry Research (CIFOR), 2006. http://www.cifor.cgiar.org/publications/pdf_files/research /governance/foresttrade/Attachment4-CIRAD-VietnamRe port-2.pdf. [33] ICARD (Informatics and Statistics Centre for Agriculture and Rural Development), “Policies Analysis Matrix for Plantation Forest in Mountainous Regions in Vietnam,” Agricultural Publishing House, Hanoi, 2002. [34] L. De, H. Miyazono, R. Prasad and A. Gerrand, “Re- gional Implications of National Changes—Some Major Influences,” In: R. N. Leslie, Ed., The Future of Forests in Asia and the Pacific: Outlook for 2020, Food Agricul- ture Organisation (FAO), Chiang Mai, 2007. [35] N. B. Nguyen, D. Q. Chu, V. T. Duong and H. A. Bui, “Handbook for the Vietnam Forestry,” The Handbook was written by the support of the Forest Sector Support Partnership (FSSP) under the Ministry of Agriculture and Rural Development (MARD), Equipment Investment and Printing Joint Stock Company, Hanoi, 2006. [36] N. B. Nguyen, V. T. Nguyen, C. N. Bui and Q. T. Trinh, “Why do Farmers Choose to Harvest Small-Sized Timber? A Survey in YenBai Province, Northern Vietnam,” The Economy and Environment Program for Southeast Asia (EEPSEA), 2006. http://www.idrc.ca/eepsea/ev-99959-201-1-DO_TOPIC.h tml. [37] D. Lamb, D. N. Huynh, S. Brown and P. Dart, “Mixed Species Plantations of High-Value Trees for Timber Pro- duction and Enhanced Community Services in Vietnam and Australia,” Forest Development and the Planting of Native Trees in Three Mountainous Northern Provinces, Project ID: FST/2000/003 Funded by the Australian Cen- tre for International Agriculture Research (ACIAR), 2006. [38] S. H. Phan and S. Harrison, “A Review of the Formula- tion and Application of the Spatial Equilibrium Models to Analyze Policy,” Journal of Forestry Research, 2011, in Press. [39] S. H. Phan, “spatequ.gms,” Spatial Equilibrium, Model Library section in the Website of General Algebraic Modeling System Development Corporation (GAMS), 2010. http://www.gams.com/modlib/libhtml/spatequ.htm. [40] J. S. Hseu and B. Joseph, “Output Supply and Input De- mand in the Pulp and Paper Industry: A Nonparametric  P. S. HIEU ET AL. Copyright © 2011 SciRes. ME 106 Model for the United States and Canada,” Journal of Forest Science, Vol. 43, No. 1, 1997, pp. 297-308. [41] P. McCarthy and L. Lei, “Regional Demands for Pulp and Paper Products,” Working Paper, The Center for Pa- per Business and Industry Studies (CPBIS), 2007. http://www.cpbis.com/research/findings/070604%20app_ demand_draft.pdf. [42] T. R. Waggener and L. Christine, “Asia-Pacific Forestry Industry Outlook Study,” Working Paper No. APFSOS/ WP/02, International Food and Agriculture Organisation (FAO), 1997. http://www.fao.org/docrep/W4388E/w4388e00.HTM. [43] J. Turner, K. Andres and B. Joseph, “Implications for the New Zealand Wood Products Sector of Trade Distortions due to Illegal Logging,” A Report Prepared for the Minis- try of Agriculture and Forestry, New Zealand, 2007. http://www.maf.govt.nz/forestry/illegal-logging/trade-dist ortion-implications/executive-summary.htm. [44] ICARD (Informatics and Statistics Centre for Agriculture and Rural Development), “Estimated Economic Results of Forest-Growing Households in Dai Tu District, Thai Nguyen Province,” The Research Project Funded by Ford Foundation, Hanoi, 2002. [45] DoF (Department of Forestry), “Introduction to Five Mil- lion ha Program,” 2008. http://dof.mard.gov.vn/661/gioithieu/lydo.htm. [46] C. Brown and P. Durst, “State of Forestry in Asia and the Pacific—2003: Status, Change and Trends,” Food and Agriculture Organisation (FAO), Regional Office for Asia and the Pacific, Bangkok, 2003. [47] ITTO (International Timber Trade Organisation), “An- nual Review and Assessment of the World Timber Situa- tion,” International Tropical Timbers Organisation, Yo- kohama, 2009. [48] H. K. Dinh and N. S. Vu, “The Plan of Raw Material Area for Paper and Engineered-Wood Production in Vietnam in the 2006-20 Period,” (Qui Hoach Cac Vung Trong Nguyen Lieu Giay va Van Nhan Tao Vietnam trong Giai Doan 2006-2020), Specialised Information Bulletin, Informatics and Statistics Centre for Agriculture and Rural Development (ICARD), Hanoi, 2008. [49] N. Blower, M. H. Ngo, J. Allan, M. Adam, P. David, Q. H. Pham, Q. Derek, Q. Nguyen, T. Mandy, T. B. Do, V. H. Hoang, W. Bob and V. David, “Paper, Prices and Poli- tics: An Evaluation of Swedish Support to the Bai Bang Project in Vietnam,” A Swedish International Co-operation Development Agency (Sida) Evaluation Report, Centre for International Economics, 1999. |