 Modern Economy, 2011, 2, 132-141 doi:10.4236/me.2011.22018 Published Online May 2011 (http://www.SciRP.org/journa l/ me ) Copyright © 2011 SciRes. ME Long-Run Effects of Customs Union between European Union and Turkey: Is It Zero-Sum Game? Nedret Demirci, Levent Aydın Department of Economics, Kırıkkale University, Kırıkkale, Turkey E-mail: leventaydin60@gmail.c om Received January 11, 2011; revised February 17, 2011; accepted February 26, 2011 Abstract Without being a full member of the European Union, Turkey’s participation to the Unity raised some sub- stantial and continued questions in Turkey about the economic results of a regional integration. Some argue that, particularly adoption of the Union’s common external tariff regime would have a devastating effect on Turkey’s trade. The aim of this paper is to search the pros and cons of customs union associated with com- mon external tariff between Turkey and European Union. Our study especially focuses on the effects of common external tariff to Turkey’s trade. The simulation results show that Turkey has been benefiting from the noticeable tariff liberalization as well as improved market conditions in line with EU since it ratified custom union with EU. Keywords: Trade Liberalization, Customs Union, Common External Tariff, GTAP Model, Turkey 1. Introduction Turkey is a country located at the crossroads of different regions and cultures bridging Europe from the West and Asia from the East. Due to this fact, relationships be- tween Turkey and Europe have an historical basis. In fact, beginning from the 19th century, during the westernize- tion process of the Turks, Europe and Turkey have on- going relationships not only in economic but also politi- cal, social and military fields. Along with the establish- ment of the new Turkish Republic in 1923, especially in new era starting with the end of the Second World War, Turkey more enthusiastically adopted Western (specifi- cally European) values and has a closer and continued connection with the European Countries. Accordingly, from their beginning, he is a member of many western institutions and integrations like United Nations, N ATO, the OECD, the Council of Europe, and lately European Union. Regarding the adventure of the Turkey’s participation to European Union, that process should be considered not only as an economic attempt but also the very sub- stantial part of the westernization and social development project. After the World War II, one year later than the Treaty of Rome entered into force and European Eco- nomic Community was legally established on 1 January European Economic Community. That time strikingly was approximately fifteen days later than the Greece applied for association with the EEC. In spite of a delay due to the military intervention occurred in 1960, after four years lasting difficult negotiations with EC, Turkey signed “Ankara Agreement” on 12 September 1963. That was the accession agreement into the EEC and creating an association between The Republic of Turkey and Eu- ropean Economic Community. This agreement went into force the following year on 12 December 1964. The fin al goal of the Ankara Agreement was to set up a customs union between the parties and after a very long standing process, unlike the other participant countries, Turkey signed a customs union coming into effect on 1st of Jan- uary, 1996. Although Turkey has not been yet adopted as a full member of the European Union, Her entrance into the customs union raised some heavy debates on its future results. These debates consist of especially economic questions rather than social and logical aspects of the customs union. For example some argue that the accep- tance of the customs union without being full member of the Union is zero sum game that EU will gain and Tur- key will lose at the end. On the other hand, being tied with the EU’s common customs tariffs, is another nega- tive aspect of the customs union that lays a heavy burden  N. DEMIRCI ET AL. Copyright © 2011 SciRes. ME on the bac k of the Tur ke y1. 2. Literature Review According to the estimates of Harrison, Rutherford and Tarr [2] the gains to Turkey of the customs union with the EU are between 1 - 1.5 percent of its GDP per year depending on the complementary policies adopted by Turkey. These gains are recurring, in the sense that they can be expected each year, and they take into account the costs of imposing higher taxes to compensate for the revenue loss of the tariff. In their point of view, since Turkey is complementing its tariff elimination on EU imports with tariff reductions on imports from third countries, Turkey will become a rather open economy in the non-agricultural sectors. This complementary tariff reduction to third countries should be regarded optimis- tically since it reduces the trade diversion costs of the customs union, and results in additional gains from trade. Bekmez [3] to measure gains and losses from cu stoms Union used a single country, multi-sector computable general equilibrium (CGE) model with implicit inclusion of the EU and ROW (Rest of the World), and He as- sumed various policy scenarios. He divided the Turkish economy into twenty-two sectors: two agricultural, eight- een manufacturing, and two service sectors. An impor- tant specification of the study was to consider the differ- entiation of imports and exports as EU and ROW. His simulation results showed that the imports and e xports of Turkey have changed in favor of the EU under tariff re- duction policies. The rest of the world’s trade with Tur- key also tends to increase due to preferential trade agree- ments with the non-EU countries. Under the customs un- ion scenario, a 2 percent decrease in GDP and an 8 per- cent decrease in government revenue will be experi- enced. Diao et al. [4] developed an intertemporal, multi-sec- toral general equilibrium model to analyze the effects of rising fiscal debts and trade liberalization on foreign trade, capital accumulation and growth rate in the context of Turkey’s post-1990 experience. Their results suggest that imbalances in the government fiscal accounts cause a contraction of sectoral outputs and real GDP beyond the levels expected from trade liberalization. They found that the longer the delay in fiscal policy adjustment, the more harmful the tariff liberalization will be. Tax adjustment neutralizes the effects of tariff liberalization, but invest- ment and imports are stimulated due to decreases in tariff rates. As a result, the level of consumption increases. This expands the trade deficit, thus increasing foreign capital inflows. Because Turkey has a comparative ad- vantage in the manufacturing and service sectors, the net ex-ports of Turkey in these two sectors tend to increase. This growth in exports w ill be faster than that of imports after the eighteenth period. As a result, under the first experiment, the economy as a whole will enjoy welfare gains from liberalization. The steady-state capital stock increases by 14.5 percent and consumption by 2.2 per- cent with respect to the pre-reform equilibrium. The wel- fare gain in the first ten periods is 0.16 percent, and reaches 0.71 percent by the end of the thirtieth period. However, in the second and third experiments, the results differ. Turkey suffers from fiscal problems due to the absence of compensating revenue sources. In the second experiment, welfare losses will be seen in the first ten periods, but these losses disappear over time. However, in the third scenario, the welfare losses resulting from tariff harmonization become worse over time. Akkoyunlu-Wigley et al. [5] searched the effects of the CU on the pricing behavior and market structure of the Turkish manufacturing industry sectors and they es- timated price cost mark up and Herfindahl concentration ratio equations (HERF). The y used for estimation a panel data set of 12 manufacturing industry sub-sectors for the period 1994 to 2000. According to their findings the vo- lume of manufacturing industry trade with the EU has actually increased on average. They found that increased trade volume with the EU during the CU period, created a positive effects upon the Turkish economy through the channel of imports, more specifically, by way of in- creasing the competitive pressure to reduce markups and the market power. Moreover, the rising export perform- ance of the manufacturing industry vis-à-vis the EU is likely to be the effect of falling mark-ups. Hence, sig- nificant welfare gains seem to have followed the changes in the pricing behavior and the market structure. The economic theory of customs union is complicated since this theory combines two reverse results. On the one hand, while customs unions creating a new trade with the members of the union; on the other hand, di- verts t he trade with low er producer co untries whi ch will remain outside the union after formation of the customs union2. Freer trade and more protectionism are together in customs union. Therefore, welfare effect (net out- come) will be the combination of these two opposite resul ts [7 ]. 1In fact, whether individual countries necessarily gain by entering a customs union (CU) or, world welfare is higher under a CU is un- proven and there is no explicit c onfirmation. See for more detailed discussion about this subject to Abrego at al. [1]. 2A growing number of governments have begun to participate in re- gional trade agreements. Th ese agreements enable member coun tries to make preferential trade in the region. A great quantity o f country is or in the search of being a member of such integration and some 55 to 60 of world trade occurs within such trading blocks. For more information see Schiff and Winters [6].  N. DEMIRCI ET AL. Copyright © 2011 SciRes. ME 3. Overview of Economic Relations between Turkey and EU The Association Agreement between Turkey and EC put forward two main goals to be fulfilled by Turkey. F ir s tly, the Agreement envisaged three stages that Turkey had to achieve [8]. These stages can be counted as preparatory, transitional and final stages. The preparatory stage covers 1963-1970 intervals and aims to prepare Turkey to the EEC. This process has been planned as a period in which the Community would provide unilateral concessions and financial aid to Tur- key while Turkey would take appropriate actions to im- prove its economy and to prepare itself for the transi- tional stage. The frame of subsequent transitional stage was design- nated by the additional protocol signed on 23 November 1970 and entered into force on 1 January 1973. That pe- riod was going to be completed in two different catego- ries between 12 and 22 years aiming finally to create a customs union between EC and Turkey. Although there is no a definite calendar for it, the agreement also included the possibility of a third final stage which would bring Turkey to full membership. Accession was not an automatic process and dependent on the realization of some concrete objectives. Second main goal depends on the Additional Protocol. According to the related Articles of the Protocol that went into effect in 1970: 1) in connection with the Title 1 and article 2, free movement of goods will be provided, 2) according to the Title 2, freedom of movement for work- ers between Member States of the Community and Tur- key shall be secured by progressive stages in accor- dance with the principles set out in Article 12 of the Agreement of Association between the end of the twelfth and the twenty-second year after the entry into force of that Agreement, 3) in relation to Title 2, EEC and Tur- key shall determine the timetable and rules for the pro- gressive abolition of restrictions on freedom of estab- lishment and on freedom to provide services, 4) Closer alignment of Turkish economic policies to EEC and fi- nancial aids to promote Turkish economic development shall be consider e d. When the Additional Protocol is examined in a de- tailed manner it is obvious that besides freedom to trade of goods and services, it aims free movement of labor and capital, freedom of establishment and to harmonize Turkish economic policies, especially taxes, to EEC. An- other prominent detail of the Association Agreement was Turkey’s acceptance of the EU’s Common External Tar- iff (CET) in its trade with third and non-member coun- tries. In order to reduce the negative effect of all these policies financial aids was provided to Turkey. The beginning of the 1980’s is a turning point for the Turkish economic system. With the 24 January decisions in 1980, Turkey entered into a new economic period by abolishing import substitution policies, which have been implemented for a very long time, and initiating various types of tools of outward-oriented economic policy. Tur- key realized a comprehensive policy changes in all fields of the state government with the abovementioned deci- sions. These new liberal perspective in every stage of the governance and a new set of economic policies resulted in a very soon positive feedback for these policy altera- tions and a considerable confidence to Turkey’s economic and democratic performance. Liberalizing economic po- licies and wave of democratization encouraged Turkey to apply for full membership to EU on April 14, 1987. The application was in line with the Article 237 of the Rome Treaty. According to that article “Any European State may apply to become a member of the Community. It shall address its application to the Council, which shall act unanimously after obtaining the opinion of the Commission”. After more than two and half years, the Commission responded to Turkey’s application on the December 19, 1989. In this response the Commission neither accepted nor directly rejected Turkey’s applica- tion and underlined Turkey’s eligibility for membership but since the implementation of the Single European Act, and the objective of completion of the internal market by the end of 1992, EC couldn’t initiate any new accession negotiations before 1993 [8]. On the other hand, EU em- phasized on some economic and political problems that Turkey has to overcome before acquiring the full mem- bership. Among some major economic problems there were very major structural disparities in agriculture and industry, macroeconomic imbalances, a high level of industrial protectionism, a low level of social protection [9] and some political issues were primarily Cyprus issue, democratic weaknesses and human rights. Nevertheless, in order not to leave Turkey out of the sphere of influ- ence The Commissi on proposed to Turkey Cust oms Union. 4. The Pros and Cons of Customs Union With a comprehensive economic reform performed at the beginning of 1980’s, Turkey abandoned import substitu- tion strategy that had been implemented more than two decades. That was a genuine revolution for the Turkish economy and thereafter an outward-oriented growth stra- tegy was put into effect. As parallel with the 24 January Decisions, before the financial liberalization, trade be- came more liberal and as a first step of that liberalization quantitative restrictions on import were elimin ated . In compliance with the 24 January Decisions, Turkey has made remarkable reductions on import tariffs of the  N. DEMIRCI ET AL. Copyright © 2011 SciRes. ME EU produced industrial goods by 1989. One of the most effective reforms was made in January 1984. Subsequent reforms were held in 1986 and in 1989. Econo my-wide reductions on the customs duty were so large that the nominal protection rate went down from 70 percent in 1984 to 40 percent in 1989 and to 28.25 percent in 1991. That means a decline in effective protection rate from 79 percent in 1984 to 54 percent in 1989 [10]. Import ratio to GNP has also increased from 1980 till 1990 and ac- cording to calculation of Togan, the openness ratio wa s 9 percent in 1980 and that went up to 27.9 percent due to rapid trade expansion by 2000 [11]. Before entering to the Customs Union Turkey had al- ready been reducing tariffs on industrial goods produced by European Union Countries and at the beginning of January 1995, just before the year Customs Union was signed with EU, over 80 percent of all Turkish imports or taxes were free of duties. The implementation had al- ready reached 90 percent of the target on the first twelve year list and 80 percent of that on the second twenty-two year list of the scheduled reductions [9]. After a difficult process, Customs Union agreement was signed on 6 March 1995 between Turkey and EU and that agreement entered into force as of 1 January 1996. According to the Decision No 1/95 Of the EC- Turkey Association Council of 22 December, import or export customs duties and charges having equivalent effect shall be wholly abolished and quantitative restrict- tions on imports and all measures having equivalent effect shall be prohibit ed bet wee n the Comm unit y and Turkey. Section 4 Article 13 explains another important issue that Turkey had to align itself. According to this upon the date of entry into force of this Decision, Turkey shall, in relation to countries which are not members of the Community, align itself on the Common Customs Tariff. On the other hand, without being a full member of European Union participating in Customs Union and especially accepting the common external tariffs of EU revealed some questions whether signing Customs Union with EU is beneficiary or harmful. Another aspect of the Customs Union was that Turkey had to implement the European Union’s Common Customs Tariff on imports of industrial goods from third countries. Besides He has also adopted most of the preferential trade agreements of the EU. It has frequently spoken at the circles of scholars in Turkey that due to not being ready for entrance to the Union, removing all barriers even against to third coun- tries Turkey would encounter a considerable trade loss. To examine this question we develop a computable gen- eral equilibrium model in the next section. In our study we will especially concentrate on common external tariff with rest of the world to measure potential loss or gain of Turkey. 5. Modeling Framework and Simulation Design To analyze the potential impact of a common external tariff in the context of customs union between EU and Turkey, we have used counterfactual simulation with a computable ge neral equilibr ium (CGE) mo del. CGE mod- els atte mpt to turn the abstract models of general equ ilib- rium theory into a practical tool for policy anal ysis. This section provides a brief overview of the CGE approach, the particulars of the model used in this paper. Since CGE models attempt to capture the features of the real-world economies, they incorporate data on the structure of production and trade in the economy under consideration. In general, starting point will be a national input-output table and a set of trade matrices. These data represent the state of the economy in question at one point in time in the base year. Having introduced the basic terminology and provided overview of the way in which CGE models are con- structed and used, we turn to brief overview of the prop- erties of the model used in this paper. 5.1. The GTAP Model The specific model used here is the Global Trade Analy- sis project (GTAP) model. This is a publicly available, mul tiregional CGE model that has been extensively used in the literature. The GTAP model3 is a standard multi-regional, static 3 GTAP stands for the Global Trade An alysis Project, a global network of researchers and policy makers con ducting quantitative analysis of international policy issues. The standard GTAP Model is a multi-re- -gion, multi-sector, computable general equilibrium model, with per- fect competition and con stan t returns to scale. Bilat via the Armington assumption and is implemented using (General Equilibrium Modeling Package). GEMPACK provides soft- ware for calculating accurate solutions of an econo mic model, starting from an algebraic representation of the equa tions of the model. These equations can be written as levels equation s, linearized equations or a mixture of these two Harrison, Pearson, [12 ]. The GTAP dat abase, in its latest version, describes the entire w orld economy as 113 countries (or regions) in terms of 57 sectors, as well as all bilateral trade flows be- tween these regions. This database for ms the basis for a r ange of CGE models that start from the same theoretical framework but are adapted to addressing different economic contexts or research questions. prominent role of GTAP in the trade p olicy debate has insp developments of the da tabase and models to deal with changes over time (the regular model is static and thus does not pro vide trajectories of changes over time), international migration (capturing the flow of persons and remittances between na tions), energy use (capturing the impact of bio-fuels in relation to developments in markets for non-re- newable fuel) and climate change. For the latter, additional databases are developed with more detail on land use (production by agro-eco- logical zones in each region) and carbon sequestration. The latter de- velopments have led to an increasing role of GTAP- the Intergovernmental Panel o n Climate Change (IPCC) to assess po li- cies for limiting greenho use g as emissions. The f ramewo rk of Stan dard GTAP model is well documented in chapter 2 of Hertel (1997) and available on the Internet (http:// www.gtap.agecon.purdue.edu).  N. DEMIRCI ET AL. Copyright © 2011 SciRes. ME CGE where all markets are assumed to be perfectly com- petitive and technologies exhibit constan t returns to scale, model fully documented by Hertel [13]. The GTAP model defines consumers as having iden- tical preferences that allocate income among private con- sumption, government consumption and savings (Cobb- Douglas). The single representative household then maximizes a constant difference of elasticity (CDE) ob- jective function. In each case consumption is of a CES composite of domestically produced and imported goods. The production in each identified sector and in each identified region is represented by a nested constant elas- ticity of substitution (CES) function. The model incur- porates The Armington [14] assumption and as such, each firm uses A CES composite domestically produced and imported intermediate goods in fixed proportions with a value added CES composite based on five en- dowed factors of production (land, natural resources, unskilled labor, skilled labor, and a capital). In addition, this paper introduces a comparative static long-run extension to the GTAP model, which treats capital stock as an endogenous variable. This extension consists of certain modifications to the structural form of the model and the development of a new closure. It is assumed that capital is mobile across regions and thus that rates of return will approach the converging growth rates in the steady state [15]. We adopt microeconomic closure that reflects the choice of time frame. It is important to emphasize that the frame element cannot be interpreted in terms of cal- endar years, but rather in terms of the adjustments that are allowed to take place in the (unobservable) transition to a new equilibrium. In the model closure we adopt a neoclassical approach. 5.2. Data and Aggregation We used version 4 of the GTAP database which is de- tailed in McDougall, Elbehri and Troung [16]. The full database contains information on 66 regions and 50 commodities and has a base year of 1997 the simulations presented here are based on an aggregated version of data consisting 3 regions 7 com moditie s . Within GTAP database, tariffs and other taxes are represented as ad valorem equivalents of the actual ap- plied rates. The GTAP database incorporates extensive information on distortions in good sectors, including trade taxes/subsides, output and input taxes/subsides, and consumption taxes/subsides. The database does not at present account for distortions in trade in services. Tar- iffs and export subsidies are defined on a region-to-re- gion basis, which allows the model to be easily used for analysis regional trading arrangements. This also implies that differing applied rates across regions reflect the dif- ferent import compositions of trade within a given ag- gregation. We focus on the effects on the directly involved coun- tries extending our analysis to the third countries in the context of customs union with EU and Turkey. Sectoral aggregation has been set up such as to allow us to pro- vide a consistent picture of the effects of the CET for both non agricultural commodities. Thus, the 57 GTAP sectors have been aggregated into 7 representative ones of which 3 are manufacture, whi l e the w orld consis t s of 3 regions (Table 1). Manufacture sectors are aggregated as follows; light manufactures are unskilled labor intensive, heavy manufactures are skilled labor intensive, and tech- nical manufactures are capital intensive sectors. The baseline has been updated to the year 1997 since the im- port tariffs for CET have to be captured in the context of custom union with Turkey. Sectoral aggregation strategy in detail was given in Table A1 in Appendix. 5.3. Simulation Procedure and Design Simulations have been designed as to represent key pol- icy elements of the EU enlargement process and they correspond to the cumulative effects of the trade liber- alization. Thus simulation 3 depicting the most complete set of policy shocks applied in our simulations: 1) CET: adoption of the Common External Tariff by Turkey and Third countries. 2) FT: free trade between the EU and Turkey. 3) CET + FT: full trad e scenario —summarizes in one comprehensive outcome results for the two pre- vious cases. We first simulate the formation of a common external tariffs between EU and third countries (outside in the Union) by adopting the these bilateral tariffs between Turkey and third countries from the base year of 1997, holding all other distor tion levels in t he system constant. Because of the likely sensitivity regarding agriculture in Table 1. Aggregation. Sectoral Aggregation Regional Aggregation Production Factors Agriculture Third Countri es Land Natural resource EU Unskilled Food manufacture Turkey Skilled labor Light manufacture Capital Heavy manufacture Natural Resources Technical manufacture Services 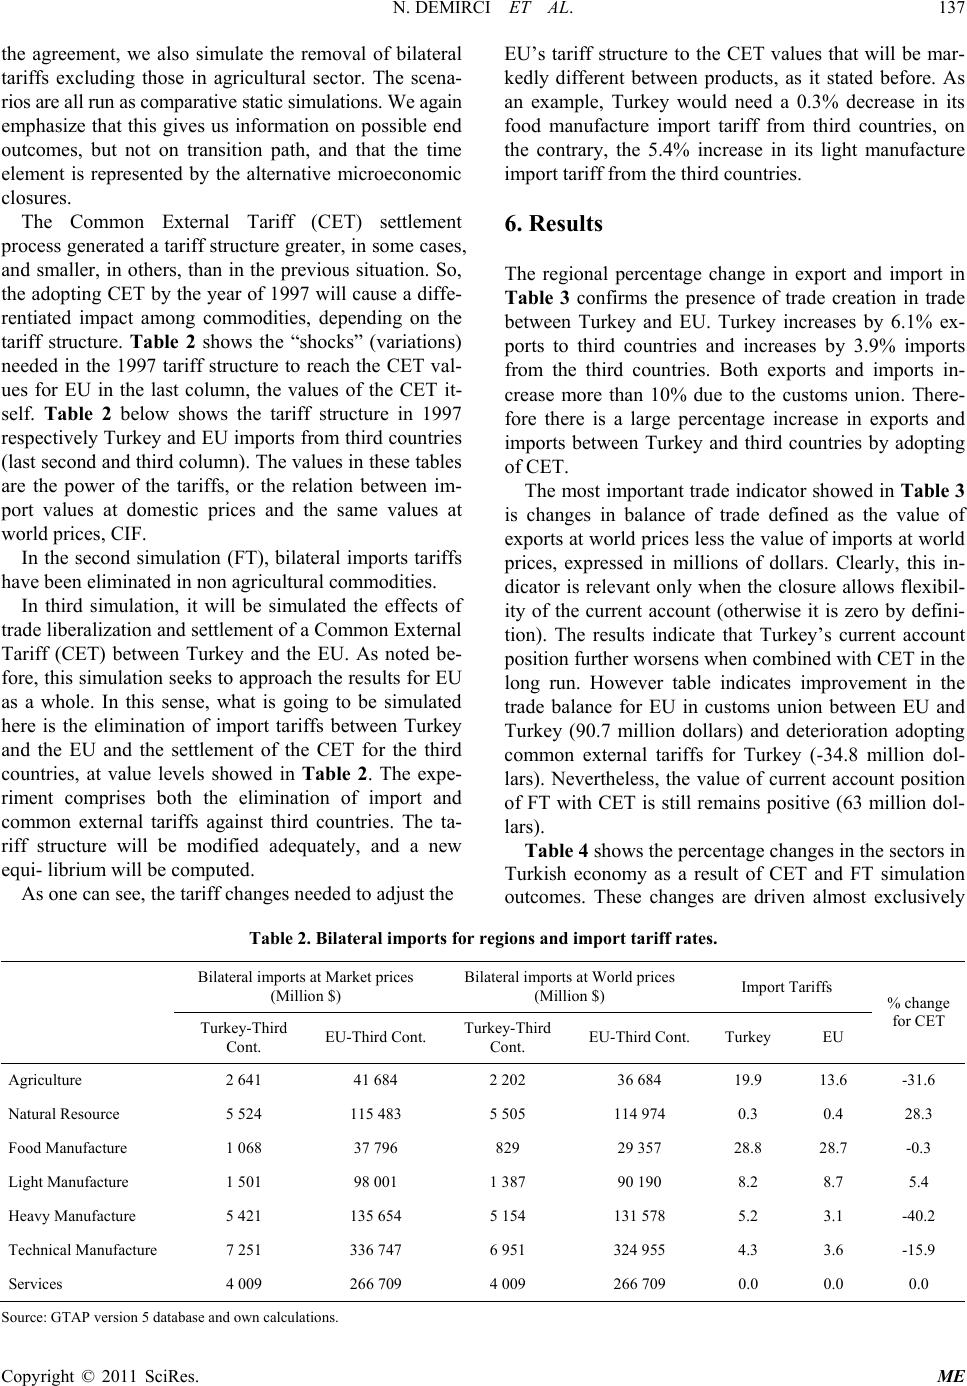 N. DEMIRCI ET AL. Copyright © 2011 SciRes. ME the agreement, we also simulate the removal of bilateral tariffs excluding those in agricultural sector. The scena- rios are all run as comparative static simulations. We again emphasize that this gives us information on possible end outcomes, but not on transition path, and that the time element is represented by the alternative microeconomic closures. The Common External Tariff (CET) settlement process generated a tariff structure greater, in some cases, and smaller, in others, than in the previous situation. So, the adopting CET by the year of 1997 will cause a diffe- rentiated impact among commodities, depending on the tariff structure. Table 2 shows the “shocks” (variations) needed in the 1997 tariff structure to reach the CET val- ues for EU in the last column, the values of the CET it- self. Table 2 below shows the tariff structure in 1997 respectively Turkey and EU imports from third countries (last second and third column). The values in these tables are the power of the tariffs, or the relation between im- port values at domestic prices and the same values at world prices, CIF. In the second simulation (FT), bilateral imports tariffs have been eliminated in non agricultural commodities. In third simulation, it will be simulated the effects of trade liberalization and settlement of a Common External Tariff (CET) between Turkey and the EU. As noted be- fore, this simulation seeks to approach the results for EU as a whole. In this sense, what is going to be simulated here is the elimination of import tariffs between Turkey and the EU and the settlement of the CET for the third countries, at value levels showed in Table 2. The expe- riment comprises both the elimination of import and common external tariffs against third countries. The ta- riff structure will be modified adequately, and a new equi- librium will be computed. As one can see, the tariff changes needed to adjust the EU’s tariff structure to the CET values that will be mar- kedly different between products, as it stated before. As an example, Turkey would need a 0.3% decrease in its food manufacture import tariff from third countries, on the contrary, the 5.4% increase in its light manufacture import tariff from the third countries. 6. Results The regional percentage change in export and import in Table 3 confirms the presence of trade creation in trade between Turkey and EU. Turkey increases by 6.1% ex- ports to third countries and increases by 3.9% imports from the third countries. Both exports and imports in- crease more than 10% due to the customs union. There- fore there is a large percentage increase in exports and imports between Turkey and third countries by adopting of CET. The most important trade indicator showed in Table 3 is changes in balance of trade defined as the value of exports at world prices less the v alue of imports at world prices, expressed in millions of dollars. Clearly, this in- dicator is relevant only when the closure allows flexibil- ity of the current account (otherwise it is zero by defini- tion). The results indicate that Turkey’s current account position further worsens when combined with CET in the long run. However table indicates improvement in the trade balance for EU in customs union between EU and Turkey (90.7 million dollars) and deterioration adopting common external tariffs for Turkey (-34.8 million dol- lars). Nevertheless, the value of current account position of FT with CET is still remains positive (63 million dol- lars). Table 4 shows the percentage changes in the sectors in Turkish economy as a result of CET and FT simulation outcomes. These changes are driven almost exclusively Table 2. Bilateral imports for regions and import tariff rates. Bilateral imports at Market prices (Million $) Bilateral imports at World prices (Million $) Import Tarif fs % change for CET Turkey-Third Cont. EU-Third Cont. Turkey-Third Cont. EU-Third Cont. Turkey EU Agriculture 2 641 41 684 2 202 36 684 19.9 13.6 -31.6 Natural Resource 5 524 115 483 5 505 114 974 0.3 0.4 28.3 Food Manufacture 1 068 37 796 829 29 357 28.8 28.7 -0.3 Light Manufacture 1 501 98 001 1 387 90 190 8.2 8.7 5.4 Heavy Manufacture 5 421 135 654 5 154 131 578 5.2 3.1 -40.2 Technical Manufacture 7 251 336 747 6 951 324 955 4.3 3.6 -15.9 Services 4 009 266 709 4 009 266 709 0.0 0.0 0.0 Source: GTAP version 5 database and own calcul ations.  N. DEMIRCI ET AL. Copyright © 2011 SciRes. ME Table 3. Long run macro and trade results. CET FT CET + FT Turkey Third Country EU Turkey EU Turkey Third Country EU Real GDP % 1.16 0.01 –0.03 3.71 0.005 4.87 –0.01 –0.02 Terms of Trade % –1.38 0.04 –0.04 0.77 0.01 –0.61 0.02 –0.03 GDP deflator % –1.98 0.05 –0.09 0.83 0.01 –1.15 0.02 –0.07 Import Volumes % 3.93 0.09 –0.1 10.58 0.07 14.6 –0.02 0.03 Export Volumes % 6.11 0.06 –0.06 10.67 0.08 16.7 0.03 0.01 Trade Balance Million $ –47.74 82.57 –34.83 –798 90.7 –845 782 63 Equivalent Variation Million$ 954 2 923 –2 673 6241 691 7 196 –1 033 –1 982 Sources: Simulation results. Table 4. Implications of industry outputs of cet: long run. CET FT CET + FT Turkey Third Count. EU Turkey EU Tu rkey Third Count. EU Agriculture 0.92 –0.02 0.05 0.67 0.02 1.59 –0.01 0.07 Natural Resource 6.71 –0.05 0.08 3.41 –0.02 10.12 –0.05 0.07 Food Manufacture 1.11 –0.02 0.03 1.9 0 3.01 –0.04 0.03 Light Manufacture 1.95 –0.09 0.24 22.19 –0.48 24.14 –0.26 –0.24 Heavy Manufacture –4.08 0.14 –0.26 1.71 0.05 –2.37 0.12 –0.21 Technical Manufactu re 2.00 0.01 –0.03 1.42 0.06 3.42 –0.01 0.03 Services 1.47 0.00 –0.02 3.38 0 4.85 –0.02 –0.02 Capital Goods 2.05 0.01 –0.06 5.8 -0.01 7.84 –0.04 –0.06 Sources: Simulation results. by the light manufacture textile, apparel, and natural re- sources sector of forestry, oil, coal and gas. In CET and FT simulation, output of light manufacture increases by 24.1%, and natura l resources increases by 10.1%. Capital goods are the only other productive sector to show any significant changes, and here output increases by 7.8%. Output in the heavy manufacture decreases by 2.37% even though there is an increase by 1.7% in custom un- ion process in this sector. The welfare measure used in the results is the equiva- lent variation (EV) for each regional household, ex- pressed in millions of 1997 US dollars. This can be in- terpreted as the change in regional household income at constant prices that is equivalent to the proposed change. The results indicate that Turkey benefit in net welfare terms under all three simulations. EU’s gains are a very solid $691 million under customs union, a similar out- come to the Third countries gains of $2,923 million in case of CET. The GTAP model allows us to separate different components of a given welfare change into changes in allocative effici ency, endowment effi ciency effect, chan ge in terms of trade and investment/savings effect as shown Table 5. The welfare impact of the adoption of CET for Turkey is shown to be positive (gain) but, for third coun- tries is shown to be negative (loss) . The model also calculates an index of welfare derived directly from the utility function, the Hicksian Equiva- lent Variation (EV), as well as shows its decomposition into parts. This variable, graphed in millions of 1997 US$, is obtained through the product of the initial in- come times the percent variation in the “per capita” util- ity, and can be decomposed in three effects: an allocative effect (AE), endowment efficiency (EE) and a terms of trade effect (TTE). This variable expresses the size of the Hicksian compensation of a price variation. As can be seen in Table 5, the EV is positive for both regions, and considerably greater in third countries than in Turkey, due to the greater size of the third country economies. Analyzing the decomposition, it can be seen that the  N. DEMIRCI ET AL. Copyright © 2011 SciRes. ME Table 5. Welfare implications of CET (US$ Million). CET FT CET + FT Turkey Third Count. EU Turkey EU Turkey Third Count. EU Allocative Efficiency (AE) 557 –602 99 1082 562 1181 –5 –40 Endowment E fficiency (EE) 677 –1232 1704 4828 –125 6532 –2132 –1357 Terms of trade effect(TTE) 1524 –924 –600 336 264 –264 925 –661 IS 165 84 –249 –5 –9 –254 179 75 Total 2 923 –2674 954 6241 691 7196 –1033 –1982 Source: Sim ula tion re sult s. size of the endowment efficiency effect is greater than total EV: 954 millions for Turkey. The terms of trade contribution to EV, however, is negative: -US$ 600 for Turkey. As noted before, there is a worsening in the terms of trade in both countries after the adoption of CET, due to the fall in export p rices. The summing up of the effects result in a positive total EV for the region, indicating an increase in aggregated welfare due to the trade liberalization process. The third countries EV also increase by an amount of US$ 2,923 million. Brazil, then, would appropriate more than half of total EV generated by the integration. As it can be seen, Tables 6-8 show a different situa- tion for Turkey and EU. Moreover, Tables 6-8 below bring a direct measure for both trade creation and diver- sion effect in Turkey and EU in the simulation. The val- ues are calculated by taking the difference between the si mulation and the base year import values in Turkey and EU, by commodity and region. The last column of each table shows the total variation in imports. Table 6. Turkey. Change in import values (CET). Million of US$. Third Countries EU countries Turkey Total Agriculture –26 –5 0 –31 Natural Resource 352 250 0 602 Food Manufacture –25 –24 0 –49 Light Manufacture –296 247 0 –49 Heavy Manufacture 4 387 –4317 0 69 Technical Manufacture 4 411 –4451 0 –40 Services –62 –40 0 –103 Total 8 741 –8 341 0 399 Source: Sim ula tion re sults. In case of the adoption of CET, the import values from EU countries fall in the simulation. There is actually an increase in import values from regions outside EU, what could be seen as trade diversion. While the total imports in Turkey from the EU would fall by US$ 8741 million, the total imports from third countries implementing CET would increase by an amount of US$ 8741 million (Ta- ble 6). In the second experiment, for Turkey, there is an in- crease in imports of US$5728 millions from the EU. This is due mainly to the increase in imports of heavy (US$1020), and technical (US$2728) manufactures from the EU (Table 7). The interesting point here is that all manufacture products are more seriously “diverted” in the trade with EU. This suggests a modification in the route of trade insid e EU after the FT plus CET, with im- port flows of manufactures being reoriented through EU countries, and then to third countries (Table 8). 7. Conclusions In this paper we have simulated the economic effects of Table 7. Turkey. Change in import values (FT). Million of US$. Third Countries EU countries Turkey Total Agriculture 232 64 0 295 Natural resource 284 43 0 328 Food manufacture –295 631 0 337 Light manufacture –59 1000 0 941 Heavy manufacture –460 1020 0 560 Technical manufacture –1233 2728 0 1495 Services 294 242 0 536 Total –1236 5728 0 4492 Source: Sim ula tion re sult s  N. DEMIRCI ET AL. Copyright © 2011 SciRes. ME customs union associated with common external tariff between Turkey and EU. The main emphasis of the pa- per is the effect that wou ld have on the Turkish economy. The simulations were carried out with a GTAP computa- ble general equilibrium model using the GTAP database 5.0, which takes common external tariff in line with Eu- rope Agreements between the Turkey and third countries into account. We distinguished between three scenarios for evaluating the effects of integration. The baseline integration scenario (the EU–Turkey free trade area) covers only reductions in trade barriers in the context of customs union. Then, as a second scenario, we assumed the common external tariff implementing to third coun- tries. In the third scenario, we assumed both customs union and common external tariff to analyze combined effects of them. This paper then uses the GTAP model to assess what the likely benefits from full trade liberalization between Turkey and the EU are likely to be. The results suggest that there will be gains to Turkey of some $7196 million. These gains come about exclusively through its own re- duction in import tariffs to zero on EU imports, and this increased welfare stems mostly from an increased alloca- tive and endowment efficiencies. The EU and other trad- ing partners lose in welfare terms. Although the customs union and common external tariffs are not a zero-sum game, one can argue that Turkey has won but the EU has lost in the context of customs union plus common exter- nal tariff. We note that the GTAP model has not increased any other domestic taxes neutralizing the reduced income the Turkish government faces due to tariff reductions. In ad- dition, the pro-competitive effects of internal market have not been covered in the model due to the lack of data availability. Turkey has been benefiting from the noticeable tariff liberalization as well as improved market conditions in line with EU since it ratified customs union with EU. Therefore, we can say contrary to what is expected and argued in some circles before Turkey has become the net beneficiary of the customs union. Although before entering to the Customs Union Tur- key had already been redu cing tariffs on industr ial goods produced by European Union Countries, it can be con- cluded that more stable macroeconomic conditions and closer cooperation with the EU respecting to fully opera- tion of technical and financial assistance can improve Turkey’s gains from the customs union associated with common external tariff. 8. References [1] A., Lisandro, R. Riezman and J. Whalley, “How Often Are Propositions on the Effects of Regional Trade Agreements Theoretical Curiosa?” Journal of Interna- tional Economics, Vol. 68, No. 1, January 2006, pp. 59- 78. doi:10.1016/j.jinteco.2005.03.003 [2] G. W. Harrison, T. F. Rutherford and D. G. Tarr, “Eco- nomic Implications for Turkey of a Customs Union with the European Union: A Quantitative Based Policy Analy- sis,” The World Bank International Economics De- part- ment International Trade Division, Policy Research Working Paper, No. 1599, May 1996. [3] S. Bekmez, “Sectoral Impacts of Turkish Accession to the European Union: A General Equilibrium Analysis,” Eastern European Economics, Vol. 40, No. 2, April 2002, pp. 57-84. [4] X. Diao, L. R. Terry and A. E. Yeldan, “How Fiscal Mismanagement May Impede Trade Reform: Lessons from An Intertemporal, Multi-Sector General Equilibrium Modal For Turkey,” The Developing Economies, Vol. 37, No.1, March 1999, pp. 59-88. [5] A. Akkoyunlu-Wigley and M., Sevinç “Effects of the Customs Union with the European Union on the Market Structure and Pricing Behaviour of the Turkish Manu- facturing Industry,” Applied Economics, Vol. 38, No. 20, 2006, pp. 2443-2452. doi:10.1080/00036840500427643 [6] M. Schiff and L. A. Winters, “Dynamics and Politics in Regional Integration Arrangements: An Introduction,” The World Bank Economic Review, Vol. 12, No. 2, May 1998, pp. 177-195. [7] R. G. Lipsey, “The Theory of Customs Unions: Trade Diversion and Welfare,” In: J. Bhagwati, P. Krishna and A. Panagariya, Eds., Trading Blocs: Alternative Approaches to Analyzing, Preferential Trade Agreements, MIT, 1999. [8] E. Erdogdu, “Turkey and Europe: Undivided but not United,” Middle East Review of International Affairs, Vol. 6, No. 2, June 2002, pp. 40-51. [9] B. Yilmaz, “The Relations of Turkey with the European Union: Candidate Forever?” Center for European Studies Working Paper Series 167, 2008. [10] H. Olgun and S. Togan, “Trade Liberalization of Interna- tional Trade in Turkey during the 1980s,” The Pakistan Development Review, Part II, Winter 1989, pp. 949 -960. [11] S. Togan, “Turkey: Toward EU Accession,” The World Economy, Vol. 27, No. 7, July 2004, pp. 1013-1045. [12] W. J. Harrison and K. R. Pearson, “Computing Solutions for Large Ge ne ral Equi lib riu m Mo del s U sing GE MPACK,” Computational Economics, Vol. 9, No. 2, 1996, pp. 83-127. [13] T. W. Hertel, “Global Trade Analysis: Modeling a nd Ap- plications,” Cambridge University Press, Cambridge, 1997. [14] P. S. Armington, “A Theory of Demand for Products Distinguished by Place of Production,” IMF Staff Papers 16, 1969, pp.159-176. [15] T. Walmsley, “Long-Run Simulations with GTAP: Illu- strative Results from APEC Trade Liberalization”, GTAP Technical Paper No. 9, 2008. [16] R. A McDougall, A. Elbehri and T. P. Truong, “Global Trade, Assistance and Protection: The GTAP 4 Data Base,” Center for Global Trade Analysis, Purdue University, West Lafayette, 1998. 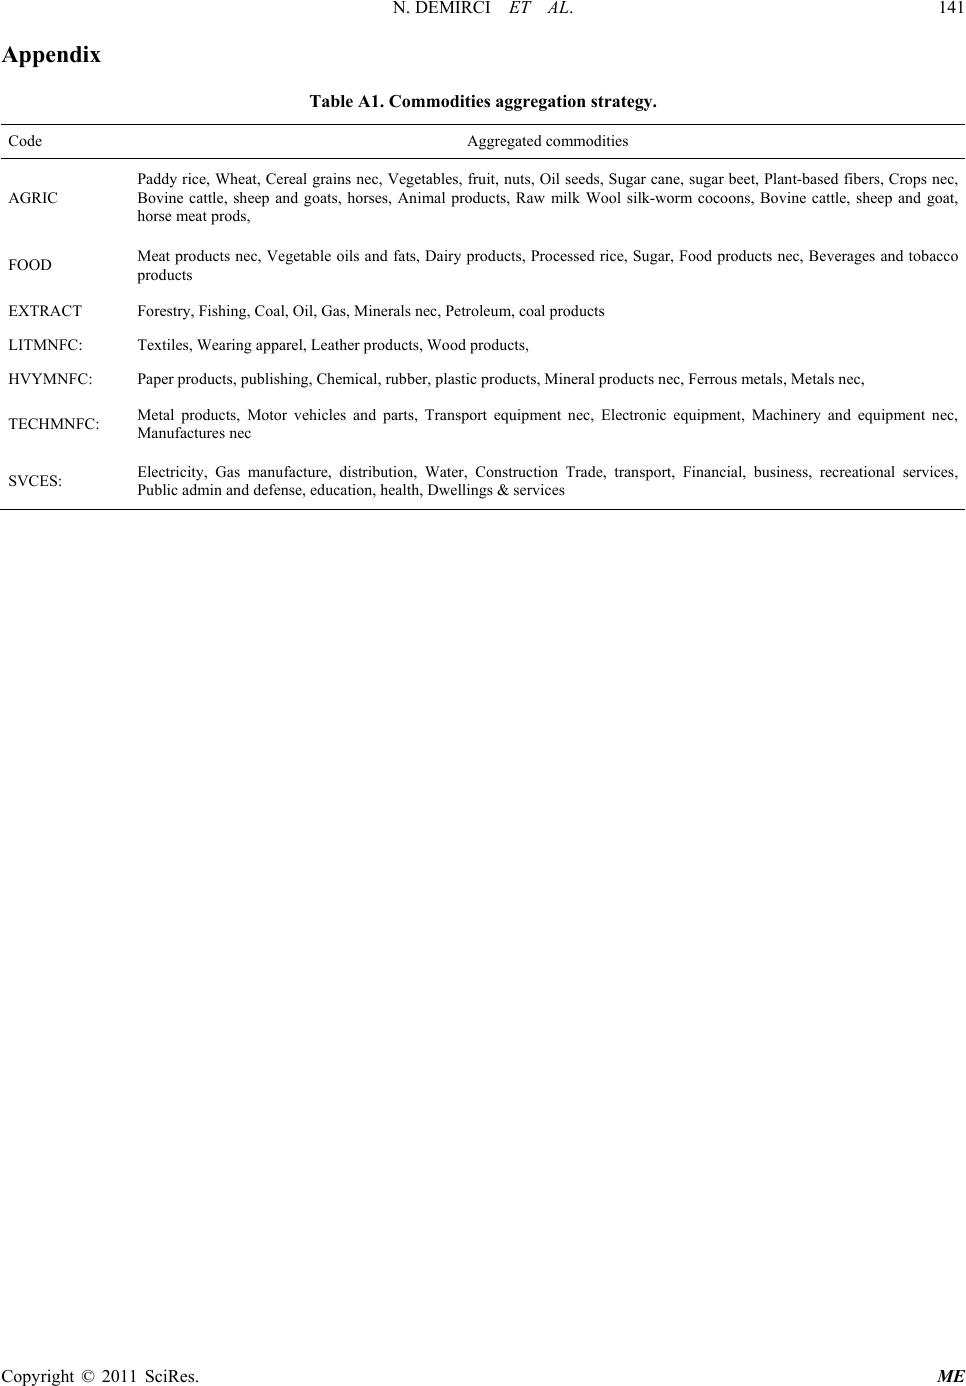 N. DEMIRCI ET AL. Copyright © 2011 SciRes. ME Appendix Table A1. Commodities aggregation strategy. Code Aggregated commodities AGRIC Paddy rice, Wheat, Cereal grains nec, Vegetab les, fruit, nuts, Oil seeds, Sugar cane, sugar beet, Plant-based fibers, Crop s nec, Bovine cattle, sheep and goats, horses, Animal products, Raw milk Wool silk-worm cocoons, Bovine cattle, sheep and goat, horse meat prods, FOOD Meat products nec, Vegetable oils and f ats, Dairy products, Processed rice, Sugar, Food products n ec, Beverages and tobacco products EXTRACT Forestry, Fishing, Coal, Oil, Gas, Minerals nec, Petroleum, coal products LITMNFC: Textiles, Wearing apparel, Leather products, Wood products, HVYMNFC: Paper products, publishing, Chemical, rubber, plastic products, Mineral products nec, Ferrous metals, Metals nec, TECHMNFC: Metal products, Motor vehicles and parts, Transport equipment nec, Electronic equipment, Machinery and equipment nec, Manufactures nec SVCES: Electricity, Gas manufacture, distribution, Water, Construction Trade, transport, Financial, business, recreational services, Public admin and defense, education, health, Dwellings & services
|