Paper Menu >>
Journal Menu >>
 Modern Economy, 2011, 2, 153-162 doi:10.4236/me.2011.22020 Published Online May 2011 (http://www.SciRP.org/journal/me) Copyright © 2011 SciRes. ME Oil Price and Economic Growth in Small Pacific Island Countries Tiru K. Jayaraman1, Evan Lau2 1School of Economics, Faculty of Business and Economics, The University of the South Pacific, Suva, Fiji Islands 2Department of Economics, Faculty of Economics and Business, Universiti Malaysia, Sarawak, Malaysia E-mail: jayaraman_tk@usp.ac.fj, lphevan@feb.unimas.my Received November 22, 2010; revised February 11, 2011; accepted February 17, 2011 Abstract Among the 14 Pacific Island countries (PICs), only Papua New Guinea has fossil fuel resources. None of the remaining 13 PICs has any energy sources. Consequently, all the 13 PICs are totally dependent on oil im- ports for their economic activities. Recent surges and volatility in oil prices have had serious economic re- percussions on economic growth. Since PICs have limited foreign exchange earning capacities, as they have very narrow range of exports and are highly dependent on foreign aid, high oil prices in recent months have seriously tested their economic resilience. This paper applies the recently developed panel analysis proce- dures to five major PICs, namely Fiji, Samoa, Solomon islands, Tonga and Vanuatu with a view to assess the impact of oil price on economic growth. The findings are that oil price, economic growth and international reserve are cointegrated. The study findings are that although in the long run there is no long run causality relationship between these variables, in the short run the causality linkage runs from oil prices and interna- tional reserve to economic growth. The paper concludes with a brief discussion on policy options. Keywords: Oil Price, Economic Sector, Pacific Island Countries (PICs), Panel Analysis 1. Introduction During an eight-year period (2000-2007), oil prices in- creased three-fold. From early January 2008, there were further increases in oil price, which reached the record level in mid 2008 at US$145 per barrel. Among the 14 Pacific island countries (PICs), only Papua New Guinea (PNG) is a producer and net exporter of oil and refined fossil fuels. The commodity price boom, since the begin- ning of the decade with oil price rising along with gold price doubling and copper prices increasing four fold, has been a big boon to PNG, in terms of improvement in terms of trade as well as resultant rise in its export earn- ings (Australian Agency for International Development, [1]). On the other hand, the smaller PICs with no petro- leum resources have been hit hard by surges in world- wide oil prices (United Nations Economic Commission for Asia and Pacific [2], Asian Development Bank [3,4]). Being totally import dependent for all fuel and other energy needs, their trade balances have deteriorated con- siderably during recent years. Aside from rise in oil price, increases in the prices of food grains due to higher demand in their use as feeds- tuff for bio-fuels, have also contributed to inflationary pressures in PICs. The latter are totally dependent on imports of wheat flour and rice as well, since they do not grow any wheat or rice, with the exception of Fiji, where rice production meets around 10% of total consumption. While PNG, which has been running trade surpluses with substantial build-up in its foreign exchange reserves can thus afford food imports at higher prices to meet rising domestic food needs, the ability of smaller PICs to bear imports at higher costs is increasingly constrained by the availability of international reserves. With decline in foreign exchange earnings from their limited export bases, consisting of traditional commodities, such as sugar in the case of Fiji, logs and oil palm in the case of Solomon Islands, and fruits and vegetables such as squash in the case of Samoa and Tonga, beef and kava in the case of Vanuatu, mounting trade deficits of PICs have to be financed by stagnant foreign exchange reserves. The result has been that despite heavy reliance on tourism and foreign aid inflows, PICs have been struggling with earmarking greater resources for critical growth enhanc- 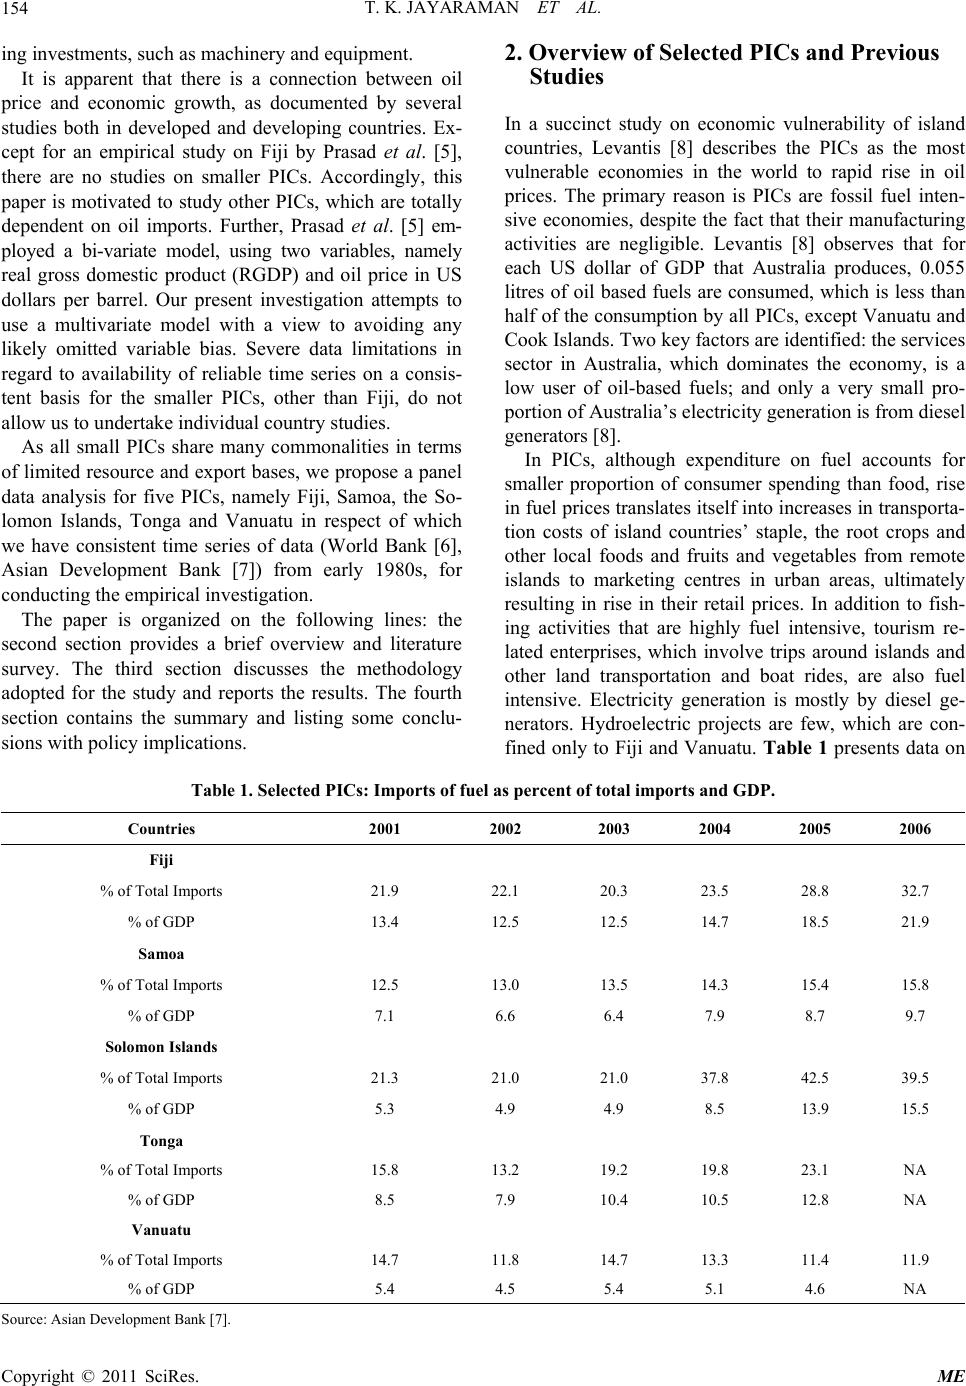 T. K. JAYARAMAN ET AL. Copyright © 2011 SciRes. ME 154 ing investments, such as machinery and equipment. It is apparent that there is a connection between oil price and economic growth, as documented by several studies both in developed and developing countries. Ex- cept for an empirical study on Fiji by Prasad et al. [5], there are no studies on smaller PICs. Accordingly, this paper is motivated to study other PICs, which are totally dependent on oil imports. Further, Prasad et al. [5] em- ployed a bi-variate model, using two variables, namely real gross domestic product (RGDP) and oil price in US dollars per barrel. Our present investigation attempts to use a multivariate model with a view to avoiding any likely omitted variable bias. Severe data limitations in regard to availability of reliable time series on a consis- tent basis for the smaller PICs, other than Fiji, do not allow us to undertake individual country studies. As all small PICs share many commonalities in terms of limited resource and export bases, we propose a panel data analysis for five PICs, namely Fiji, Samoa, the So- lomon Islands, Tonga and Vanuatu in respect of which we have consistent time series of data (World Bank [6], Asian Development Bank [7]) from early 1980s, for conducting the empirical investigation. The paper is organized on the following lines: the second section provides a brief overview and literature survey. The third section discusses the methodology adopted for the study and reports the results. The fourth section contains the summary and listing some conclu- sions with policy implications. 2. Overview of Selected PICs and Previous Studies In a succinct study on economic vulnerability of island countries, Levantis [8] describes the PICs as the most vulnerable economies in the world to rapid rise in oil prices. The primary reason is PICs are fossil fuel inten- sive economies, despite the fact that their manufacturing activities are negligible. Levantis [8] observes that for each US dollar of GDP that Australia produces, 0.055 litres of oil based fuels are consumed, which is less than half of the consumption by all PICs, except Vanuatu and Cook Islands. Two key factors are identified: the services sector in Australia, which dominates the economy, is a low user of oil-based fuels; and only a very small pro- portion of Australia’s electricity generation is from diesel generators [8]. In PICs, although expenditure on fuel accounts for smaller proportion of consumer spending than food, rise in fuel prices translates itself into increases in transporta- tion costs of island countries’ staple, the root crops and other local foods and fruits and vegetables from remote islands to marketing centres in urban areas, ultimately resulting in rise in their retail prices. In addition to fish- ing activities that are highly fuel intensive, tourism re- lated enterprises, which involve trips around islands and other land transportation and boat rides, are also fuel intensive. Electricity generation is mostly by diesel ge- nerators. Hydroelectric projects are few, which are con- fined only to Fiji and Vanuatu. Table 1 presents data on Table 1. Selected PICs: Imports of fuel as percent of total imports and GDP. Countries 2001 2002 2003 2004 2005 2006 Fiji % of Total Imports 21.9 22.1 20.3 23.5 28.8 32.7 % of GDP 13.4 12.5 12.5 14.7 18.5 21.9 Samoa % of Total Imports 12.5 13.0 13.5 14.3 15.4 15.8 % of GDP 7.1 6.6 6.4 7.9 8.7 9.7 Solomon Islands % of Total Imports 21.3 21.0 21.0 37.8 42.5 39.5 % of GDP 5.3 4.9 4.9 8.5 13.9 15.5 Tonga % of Total Imports 15.8 13.2 19.2 19.8 23.1 NA % of GDP 8.5 7.9 10.4 10.5 12.8 NA Vanuatu % of Total Imports 14.7 11.8 14.7 13.3 11.4 11.9 % of GDP 5.4 4.5 5.4 5.1 4.6 NA Source: Asian Development Bank [7]. 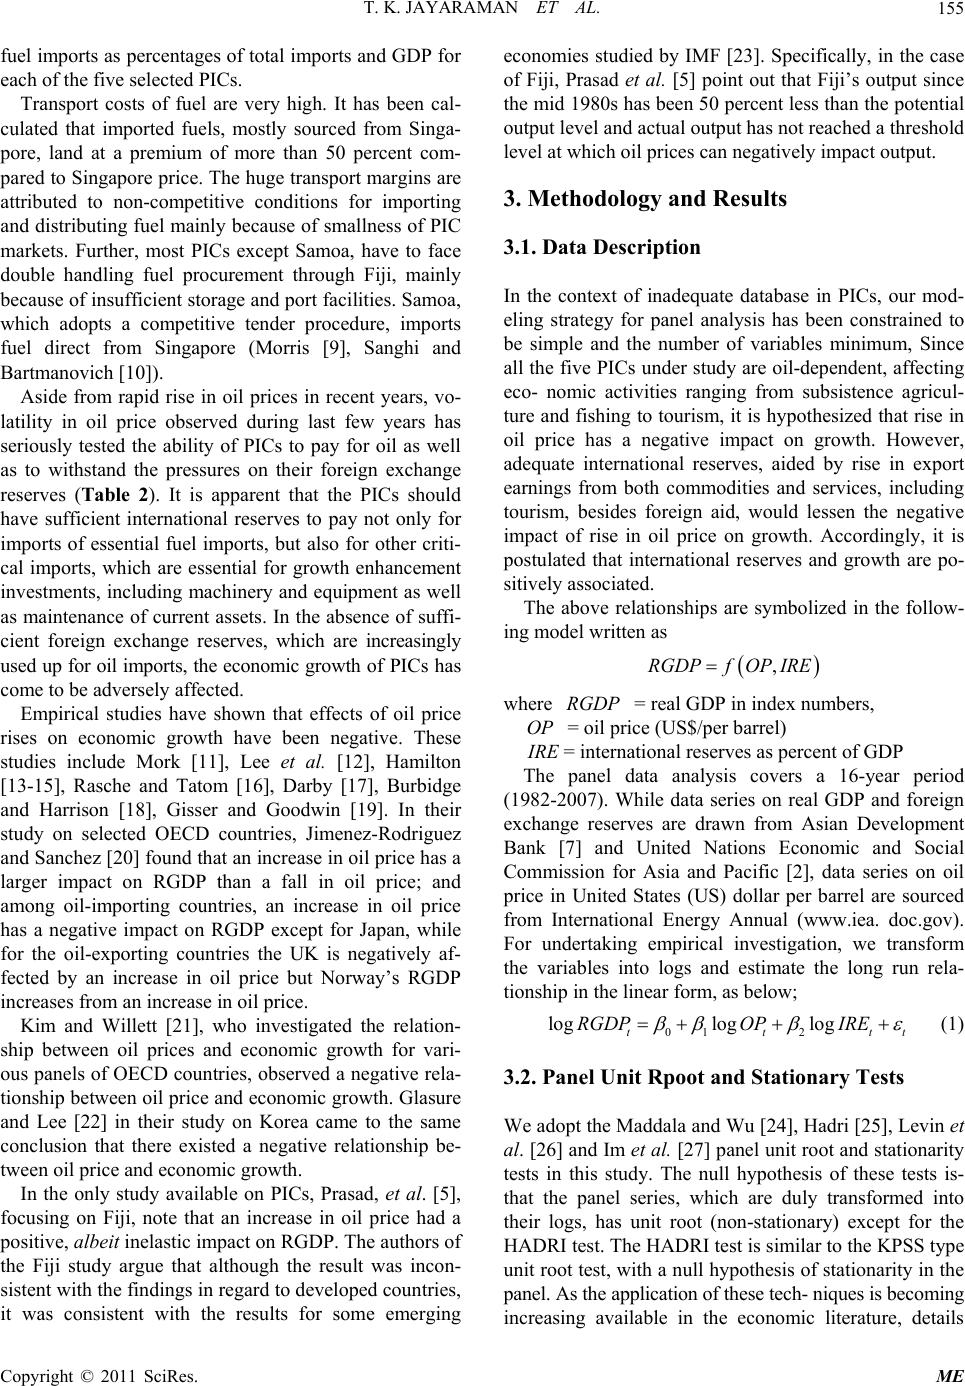 T. K. JAYARAMAN ET AL. Copyright © 2011 SciRes. ME 155 fuel imports as percentages of total imports and GDP for each of the five selected PICs. Transport costs of fuel are very high. It has been cal- culated that imported fuels, mostly sourced from Singa- pore, land at a premium of more than 50 percent com- pared to Singapore price. The huge transport margins are attributed to non-competitive conditions for importing and distributing fuel mainly because of smallness of PIC markets. Further, most PICs except Samoa, have to face double handling fuel procurement through Fiji, mainly because of insufficient storage and port facilities. Samoa, which adopts a competitive tender procedure, imports fuel direct from Singapore (Morris [9], Sanghi and Bartmanovich [10]). Aside from rapid rise in oil prices in recent years, vo- latility in oil price observed during last few years has seriously tested the ability of PICs to pay for oil as well as to withstand the pressures on their foreign exchange reserves (Table 2). It is apparent that the PICs should have sufficient international reserves to pay not only for imports of essential fuel imports, but also for other criti- cal imports, which are essential for growth enhancement investments, including machinery and equipment as well as maintenance of current assets. In the absence of suffi- cient foreign exchange reserves, which are increasingly used up for oil imports, the economic growth of PICs has come to be adversely affected. Empirical studies have shown that effects of oil price rises on economic growth have been negative. These studies include Mork [11], Lee et al. [12], Hamilton [13-15], Rasche and Tatom [16], Darby [17], Burbidge and Harrison [18], Gisser and Goodwin [19]. In their study on selected OECD countries, Jimenez-Rodriguez and Sanchez [20] found that an increase in oil price has a larger impact on RGDP than a fall in oil price; and among oil-importing countries, an increase in oil price has a negative impact on RGDP except for Japan, while for the oil-exporting countries the UK is negatively af- fected by an increase in oil price but Norway’s RGDP increases from an increase in oil price. Kim and Willett [21], who investigated the relation- ship between oil prices and economic growth for vari- ous panels of OECD countries, observed a negative rela- tionship between oil price and economic growth. Glasure and Lee [22] in their study on Korea came to the same conclusion that there existed a negative relationship be- tween oil price and economic growth. In the only study available on PICs, Prasad, et al. [5], focusing on Fiji, note that an increase in oil price had a positive, albeit inelastic impact on RGDP. The authors of the Fiji study argue that although the result was incon- sistent with the findings in regard to developed countries, it was consistent with the results for some emerging economies studied by IMF [23]. Specifically, in the case of Fiji, Prasad et al. [5] point out that Fiji’s output since the mid 1980s has been 50 percent less than the potential output level and actual output has not reached a threshold level at which oil prices can negatively impact output. 3. Methodology and Results 3.1. Data Description In the context of inadequate database in PICs, our mod- eling strategy for panel analysis has been constrained to be simple and the number of variables minimum, Since all the five PICs under study are oil-dependent, affecting eco- nomic activities ranging from subsistence agricul- ture and fishing to tourism, it is hypothesized that rise in oil price has a negative impact on growth. However, adequate international reserves, aided by rise in export earnings from both commodities and services, including tourism, besides foreign aid, would lessen the negative impact of rise in oil price on growth. Accordingly, it is postulated that international reserves and growth are po- sitively associated. The above relationships are symbolized in the follow- ing model written as ,RGDPfOP IRE where RGDP = real GDP in index numbers, OP = oil price (US$/per barrel) I RE = international reserves as percent of GDP The panel data analysis covers a 16-year period (1982-2007). While data series on real GDP and foreign exchange reserves are drawn from Asian Development Bank [7] and United Nations Economic and Social Commission for Asia and Pacific [2], data series on oil price in United States (US) dollar per barrel are sourced from International Energy Annual (www.iea. doc.gov). For undertaking empirical investigation, we transform the variables into logs and estimate the long run rela- tionship in the linear form, as below; 01 2 loglog log tttt RGDPOP IRE (1) 3.2. Panel Unit Rpoot and Stationary Tests We adopt the Maddala and Wu [24], Hadri [25], Levin et al. [26] and Im et al. [27] panel unit root and stationarity tests in this study. The null hypothesis of these tests is- that the panel series, which are duly transformed into their logs, has unit root (non-stationary) except for the HADRI test. The HADRI test is similar to the KPSS type unit root test, with a null hypothesis of stationarity in the panel. As the application of these tech- niques is becoming increasing available in the economic literature, details 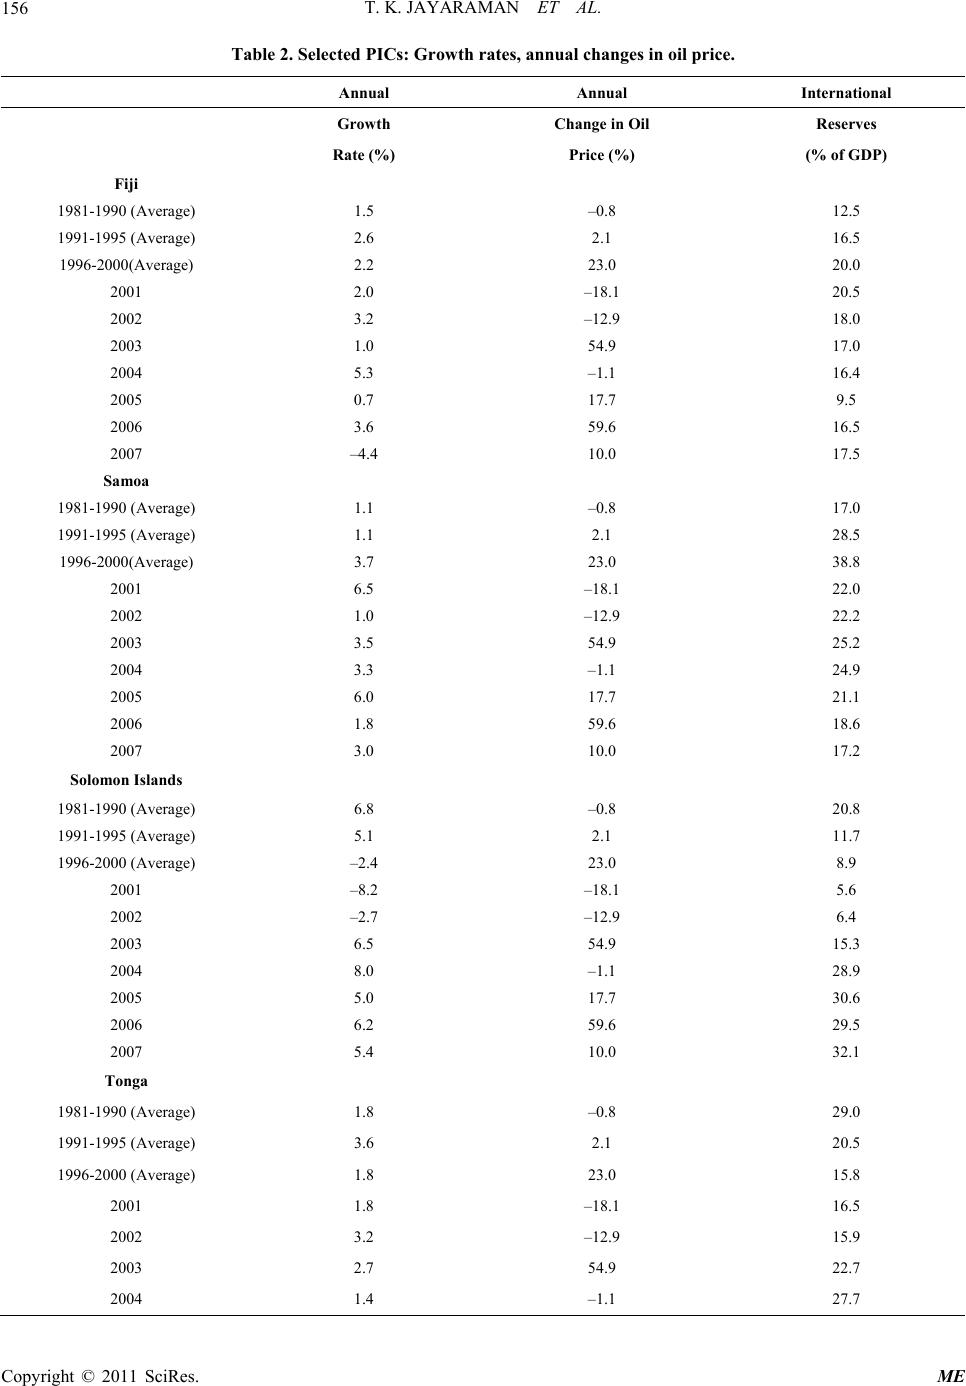 T. K. JAYARAMAN ET AL. Copyright © 2011 SciRes. ME 156 Table 2. Selected PICs: Growth rates, annual change s in oil pr ice . Annual Annual International Growth Change in Oil Reserves Rate (%) Price (%) (% of GDP) Fiji 1981-1990 (Average) 1.5 –0.8 12.5 1991-1995 (Average) 2.6 2.1 16.5 1996-2000(Average) 2.2 23.0 20.0 2001 2.0 –18.1 20.5 2002 3.2 –12.9 18.0 2003 1.0 54.9 17.0 2004 5.3 –1.1 16.4 2005 0.7 17.7 9.5 2006 3.6 59.6 16.5 2007 –4.4 10.0 17.5 Samoa 1981-1990 (Average) 1.1 –0.8 17.0 1991-1995 (Average) 1.1 2.1 28.5 1996-2000(Average) 3.7 23.0 38.8 2001 6.5 –18.1 22.0 2002 1.0 –12.9 22.2 2003 3.5 54.9 25.2 2004 3.3 –1.1 24.9 2005 6.0 17.7 21.1 2006 1.8 59.6 18.6 2007 3.0 10.0 17.2 Solomon Islands 1981-1990 (Average) 6.8 –0.8 20.8 1991-1995 (Average) 5.1 2.1 11.7 1996-2000 (Average) –2.4 23.0 8.9 2001 –8.2 –18.1 5.6 2002 –2.7 –12.9 6.4 2003 6.5 54.9 15.3 2004 8.0 –1.1 28.9 2005 5.0 17.7 30.6 2006 6.2 59.6 29.5 2007 5.4 10.0 32.1 Tonga 1981-1990 (Average) 1.8 –0.8 29.0 1991-1995 (Average) 3.6 2.1 20.5 1996-2000 (Average) 1.8 23.0 15.8 2001 1.8 –18.1 16.5 2002 3.2 –12.9 15.9 2003 2.7 54.9 22.7 2004 1.4 –1.1 27.7 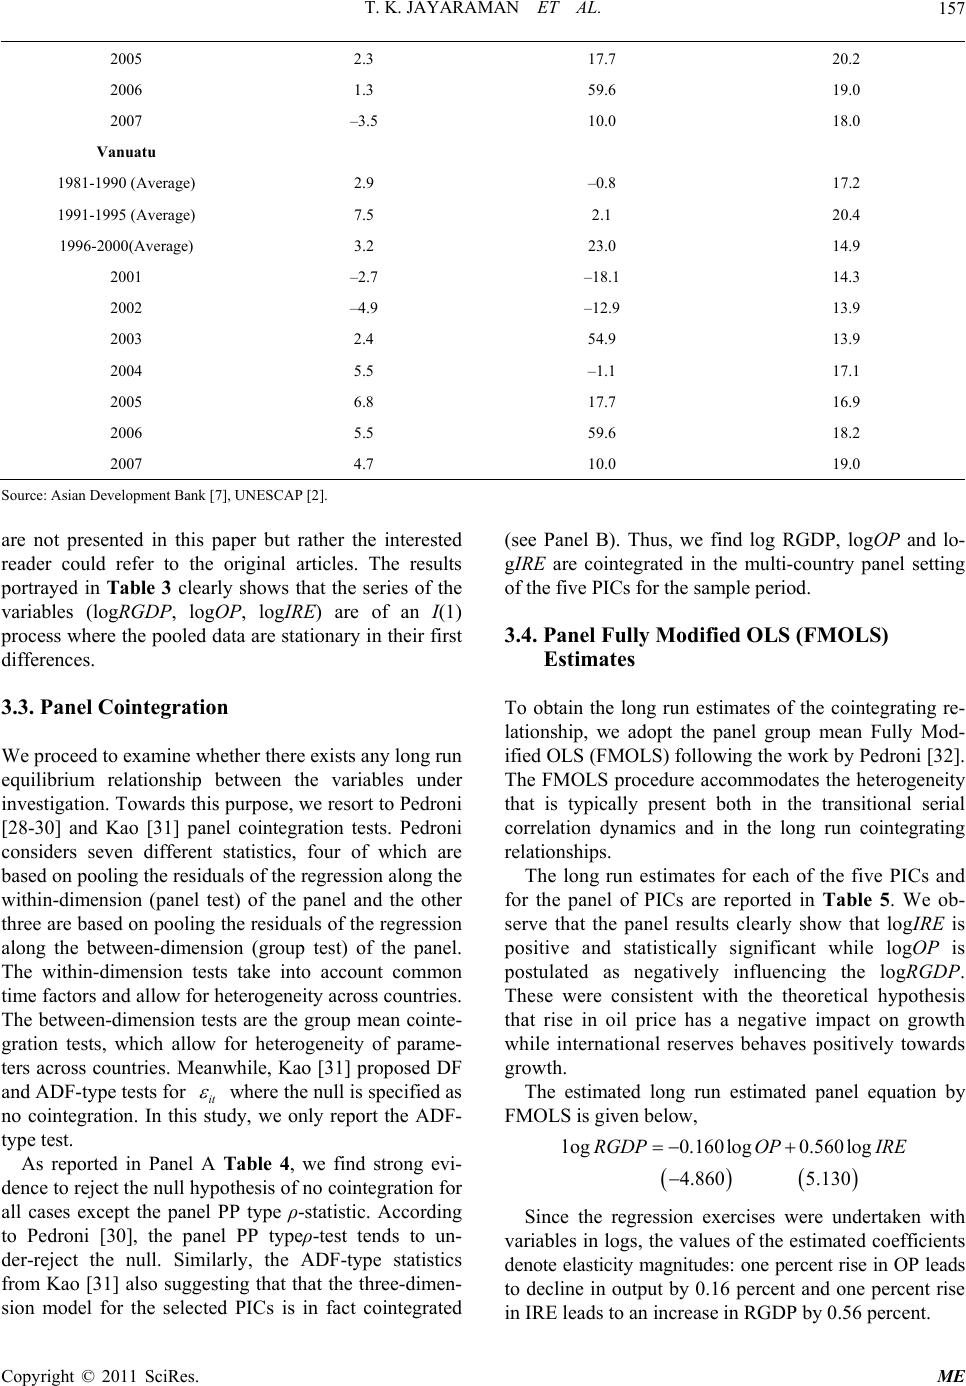 T. K. JAYARAMAN ET AL. Copyright © 2011 SciRes. ME 157 2005 2.3 17.7 20.2 2006 1.3 59.6 19.0 2007 –3.5 10.0 18.0 Vanuatu 1981-1990 (Average) 2.9 –0.8 17.2 1991-1995 (Average) 7.5 2.1 20.4 1996-2000(Average) 3.2 23.0 14.9 2001 –2.7 –18.1 14.3 2002 –4.9 –12.9 13.9 2003 2.4 54.9 13.9 2004 5.5 –1.1 17.1 2005 6.8 17.7 16.9 2006 5.5 59.6 18.2 2007 4.7 10.0 19.0 Source: Asian Development Bank [7], UNESCAP [2]. are not presented in this paper but rather the interested reader could refer to the original articles. The results portrayed in Table 3 clearly shows that the series of the variables (logRGDP, logOP, logIRE) are of an I(1) process where the pooled data are stationary in their first differences. 3.3. Panel Cointegration We proceed to examine whether there exists any long run equilibrium relationship between the variables under investigation. Towards this purpose, we resort to Pedroni [28-30] and Kao [31] panel cointegration tests. Pedroni considers seven different statistics, four of which are based on pooling the residuals of the regression along the within-dimension (panel test) of the panel and the other three are based on pooling the residuals of the regression along the between-dimension (group test) of the panel. The within-dimension tests take into account common time factors and allow for heterogeneity across countries. The between-dimension tests are the group mean cointe- gration tests, which allow for heterogeneity of parame- ters across countries. Meanwhile, Kao [31] proposed DF and ADF-type tests for it where the null is specified as no cointegration. In this study, we only report the ADF- type test. As reported in Panel A Table 4, we find strong evi- dence to reject the null hypothesis of no cointegration for all cases except the panel PP type ρ-statistic. According to Pedroni [30], the panel PP typeρ-test tends to un- der-reject the null. Similarly, the ADF-type statistics from Kao [31] also suggesting that that the three-dimen- sion model for the selected PICs is in fact cointegrated (see Panel B). Thus, we find log RGDP, logOP and lo- gIRE are cointegrated in the multi-country panel setting of the five PICs for the sample period. 3.4. Panel Fully Modified OLS (FMOLS) Estimates To obtain the long run estimates of the cointegrating re- lationship, we adopt the panel group mean Fully Mod- ified OLS (FMOLS) following the work by Pedroni [32]. The FMOLS procedure accommodates the heterogeneity that is typically present both in the transitional serial correlation dynamics and in the long run cointegrating relationships. The long run estimates for each of the five PICs and for the panel of PICs are reported in Table 5. We ob- serve that the panel results clearly show that logIRE is positive and statistically significant while logOP is postulated as negatively influencing the logRGDP. These were consistent with the theoretical hypothesis that rise in oil price has a negative impact on growth while international reserves behaves positively towards growth. The estimated long run estimated panel equation by FMOLS is given below, l og0.160 log0.560 log 4.860 5.130 RGDPOP IRE Since the regression exercises were undertaken with variables in logs, the values of the estimated coefficients denote elasticity magnitudes: one percent rise in OP leads to decline in output by 0.16 percent and one percent rise in IRE leads to an increase in RGDP by 0.56 percent. 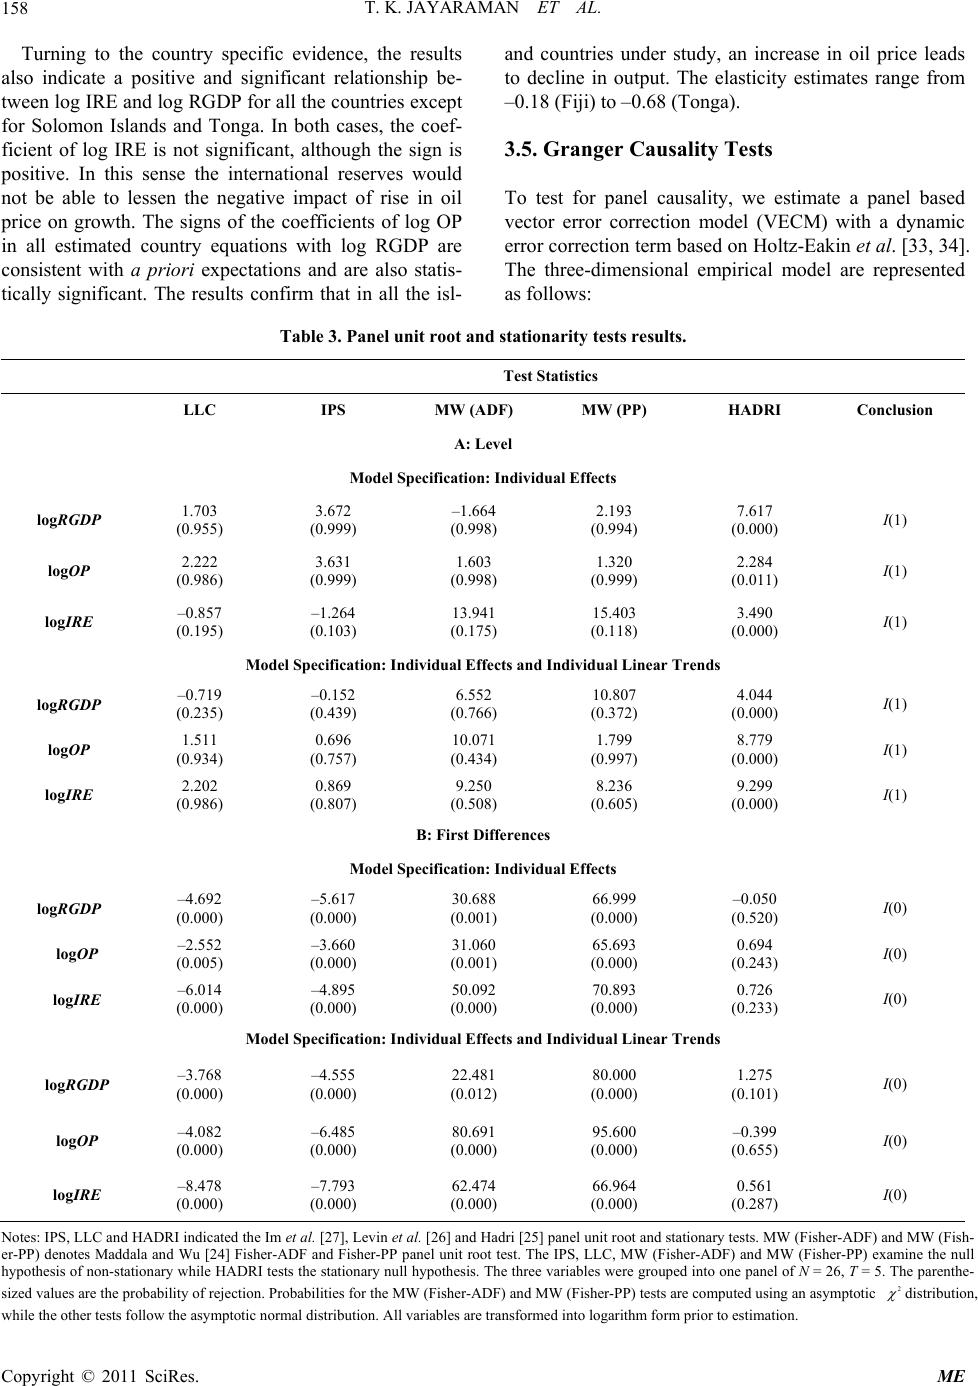 T. K. JAYARAMAN ET AL. Copyright © 2011 SciRes. ME 158 Turning to the country specific evidence, the results also indicate a positive and significant relationship be- tween log IRE and log RGDP for all the countries except for Solomon Islands and Tonga. In both cases, the coef- ficient of log IRE is not significant, although the sign is positive. In this sense the international reserves would not be able to lessen the negative impact of rise in oil price on growth. The signs of the coefficients of log OP in all estimated country equations with log RGDP are consistent with a priori expectations and are also statis- tically significant. The results confirm that in all the isl- and countries under study, an increase in oil price leads to decline in output. The elasticity estimates range from –0.18 (Fiji) to –0.68 (Tonga). 3.5. Granger Causality Tests To test for panel causality, we estimate a panel based vector error correction model (VECM) with a dynamic error correction term based on Holtz-Eakin et al. [33, 34]. The three-dimensional empirical model are represented as follows: Table 3. Panel unit root and stationarity tests re sults. Test Statistics LLC IPS MW (ADF) MW (PP) HADRI Conclusion A: Level Model Specification: Individual Effects logRGDP 1.703 (0.955) 3.672 (0.999) –1.664 (0.998) 2.193 (0.994) 7.617 (0.000) I(1) logOP 2.222 (0.986) 3.631 (0.999) 1.603 (0.998) 1.320 (0.999) 2.284 (0.011) I(1) logIRE –0.857 (0.195) –1.264 (0.103) 13.941 (0.175) 15.403 (0.118) 3.490 (0.000) I(1) Model Specification: Individual Effects and Individual Linear Trends logRGDP –0.719 (0.235) –0.152 (0.439) 6.552 (0.766) 10.807 (0.372) 4.044 (0.000) I(1) logOP 1.511 (0.934) 0.696 (0.757) 10.071 (0.434) 1.799 (0.997) 8.779 (0.000) I(1) logIRE 2.202 (0.986) 0.869 (0.807) 9.250 (0.508) 8.236 (0.605) 9.299 (0.000) I(1) B: First Differences Model Specification: Individual Effects logRGDP –4.692 (0.000) –5.617 (0.000) 30.688 (0.001) 66.999 (0.000) –0.050 (0.520) I(0) log OP –2.552 (0.005) –3.660 (0.000) 31.060 (0.001) 65.693 (0.000) 0.694 (0.243) I(0) logIRE –6.014 (0.000) –4.895 (0.000) 50.092 (0.000) 70.893 (0.000) 0.726 (0.233) I(0) Model Specification: Individual Effects and Individual Linear Trends log RGDP –3.768 (0.000) –4.555 (0.000) 22.481 (0.012) 80.000 (0.000) 1.275 (0.101) I(0) log OP –4.082 (0.000) –6.485 (0.000) 80.691 (0.000) 95.600 (0.000) –0.399 (0.655) I(0) logIRE –8.478 (0.000) –7.793 (0.000) 62.474 (0.000) 66.964 (0.000) 0.561 (0.287) I(0) Notes: IPS, LLC and HADRI indicated the Im et al. [27], Levin et al. [26] and Hadri [25] panel unit root and stationary tests. MW (Fisher-ADF) and MW (Fish- er-PP) denotes Maddala and Wu [24] Fisher-ADF and Fisher-PP panel unit root test. The IPS, LLC, MW (Fisher-ADF) and MW (Fisher-PP) examine the null hypothesis of non-stationary while HADRI tests the stationary null hypothesis. The three variables were grouped into one panel of N = 26, T = 5. The parenthe- sized values are the probability of rejection. Probabilities for the MW (Fisher-ADF) and MW (Fisher-PP) tests are computed using an asymptotic 2 distribution, while the other tests follow the asymptotic normal distribution. All variables are transformed into logarithm form prior to estimation. 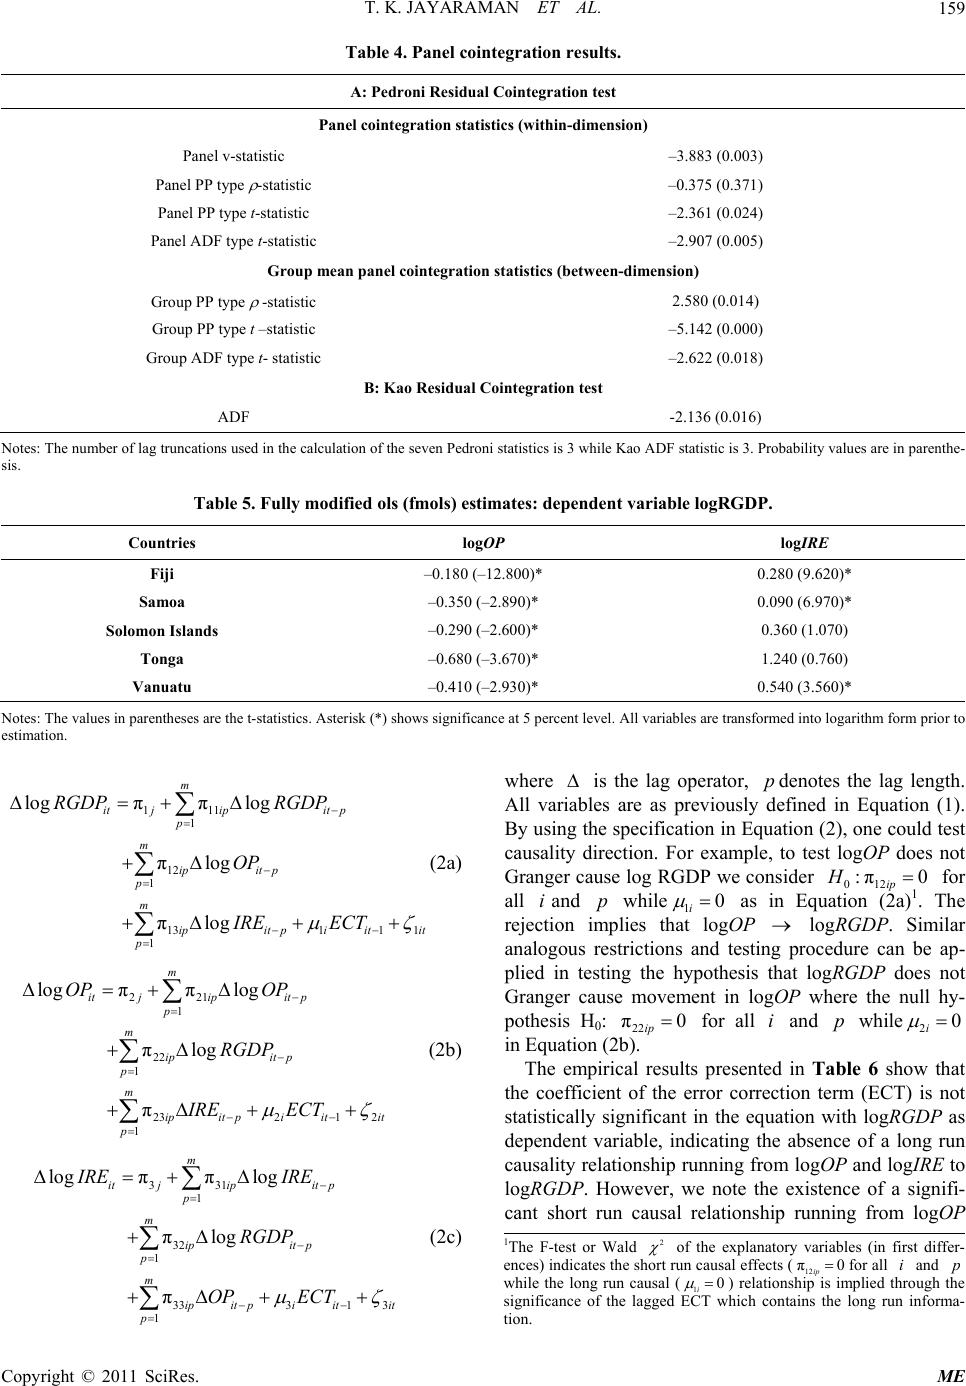 T. K. JAYARAMAN ET AL. Copyright © 2011 SciRes. ME 159 Table 4. Panel cointegration results. A: Pedroni Residual Cointe g ra tion test Panel cointegration statistics (within-dimension) Panel v-statistic –3.883 (0.003) Panel PP type -statistic –0.375 (0.371) Panel PP type t-statistic –2.361 (0.024) Panel ADF type t-statistic –2.907 (0.005) Group mean panel cointegration statistics (between-dimension) Group PP type -statistic 2.580 (0.014) Group PP type t –statistic –5.142 (0.000) Group ADF type t- statistic –2.622 (0.018) B: Kao Residual Cointegrat io n test ADF -2.136 (0.016) Notes: The number of lag truncations used in the calculation of the seven Pedroni statistics is 3 while Kao ADF statistic is 3. Probability values are in parenthe- sis. Table 5. Fully modified ols (fmols) estimates: dependent variable logRGDP. Countries logOP logIRE Fiji –0.180 (–12.800)* 0.280 (9.620)* Samoa –0.350 (–2.890)* 0.090 (6.970)* Solomon Islands –0.290 (–2.600)* 0.360 (1.070) Tonga –0.680 (–3.670)* 1.240 (0.760) Vanuatu –0.410 (–2.930)* 0.540 (3.560)* Notes: The values in parentheses are the t-statistics. Asterisk (*) shows significance at 5 percent level. All variables are transformed into logarithm form prior to estimation. 111 1 12 1 1311 1 1 log ππlog πlog πlog m itjipit p p m ipit p p m ipitpiitit p RGDP RGDP OP IRE ECT (2a) 221 1 22 1 2321 2 1 log ππlog πlog π m itjipit p p m ipit p p m ipit piitit p OP OP RGDP IRE ECT (2b) 331 1 32 1 3331 3 1 log ππlog πlog π m itjipit p p m ipit p p m ipitpiitit p IRE IRE RGDP OP ECT (2c) where is the lag operator, pdenotes the lag length. All variables are as previously defined in Equation (1). By using the specification in Equation (2), one could test causality direction. For example, to test logOP does not Granger cause log RGDP we consider 012 :π0 ip H for all iand p while10 i as in Equation (2a)1. The rejection implies that logOP logRGDP. Similar analogous restrictions and testing procedure can be ap- plied in testing the hypothesis that logRGDP does not Granger cause movement in logOP where the null hy- pothesis H0: 22 π0 ip for all i and p while20 i in Equation (2b). The empirical results presented in Table 6 show that the coefficient of the error correction term (ECT) is not statistically significant in the equation with logRGDP as dependent variable, indicating the absence of a long run causality relationship running from logOP and logIRE to logRGDP. However, we note the existence of a signifi- cant short run causal relationship running from logOP 1The F-test or Wald 2 of the explanatory variables (in first differ- ences) indicates the short run causal effects (12 π0 ip for all i and p while the long run causal (10 i ) relationship is implied through the significance of the lagged ECT which contains the long run informa- tion. 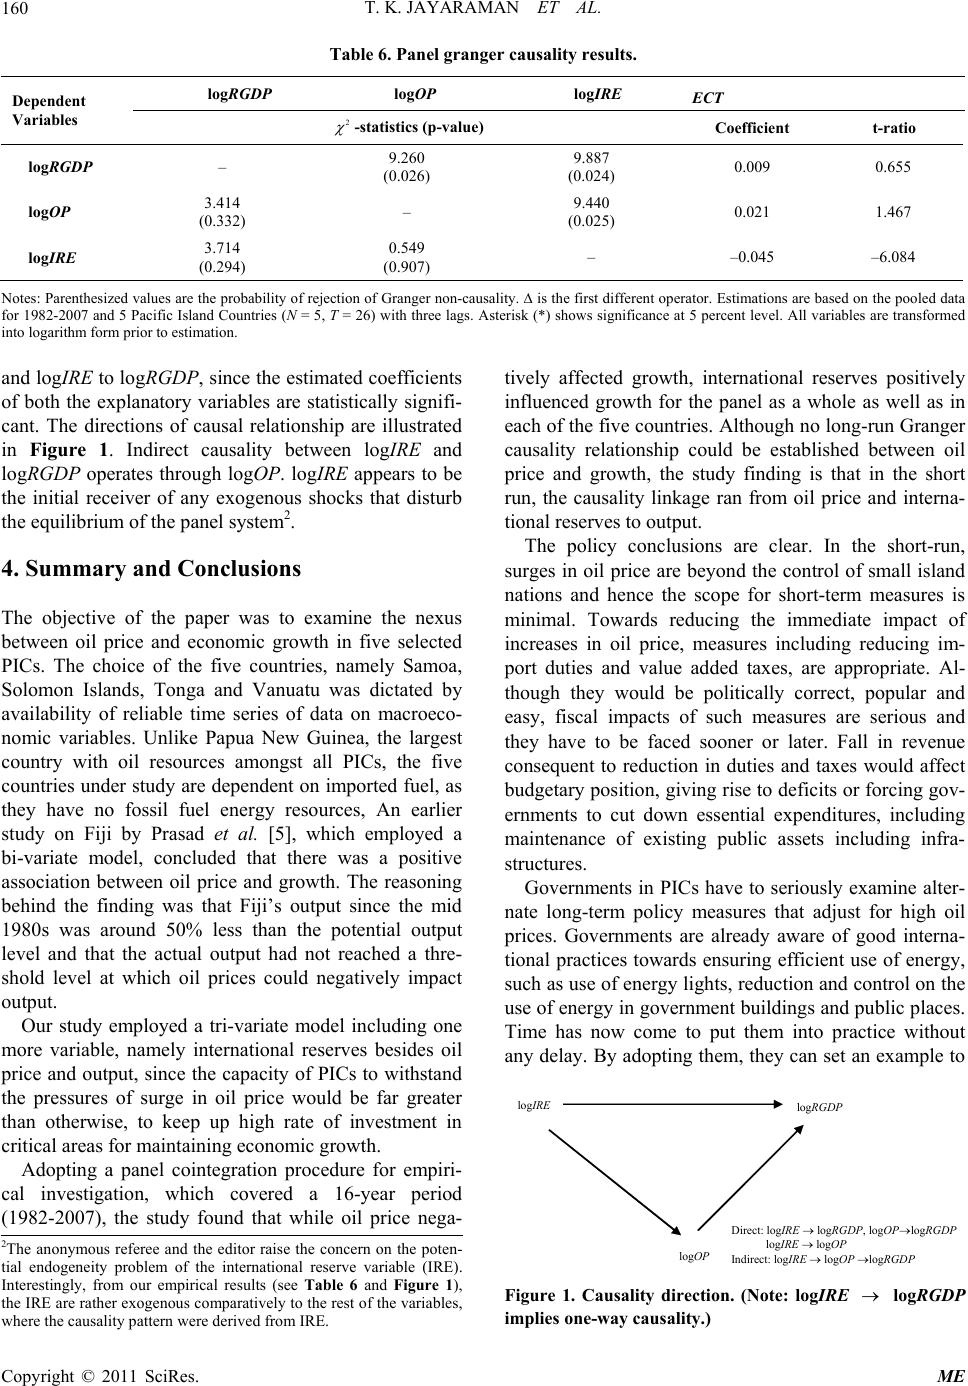 T. K. JAYARAMAN ET AL. Copyright © 2011 SciRes. ME 160 Table 6. Panel granger causality results. Dependent Variables log RGDP log OP log IRE ECT 2 -statistics (p-value) Coefficient t-ratio log RGDP – 9.260 (0.026) 9.887 (0.024) 0.009 0.655 log OP 3.414 (0.332) – 9.440 (0.025) 0.021 1.467 logIRE 3.714 (0.294) 0.549 (0.907) – –0.045 –6.084 Notes: Parenthesized values are the probability of rejection of Granger non-causality. is the first different operator. Estimations are based on the pooled data for 1982-2007 and 5 Pacific Island Countries (N = 5, T = 26) with three lags. Asterisk (*) shows significance at 5 percent level. All variables are transformed into logarithm form prior to estimation. and logIRE to logRGDP , since the estimated coefficients of both the explanatory variables are statistically signifi- cant. The directions of causal relationship are illustrated in Figure 1. Indirect causality between logIRE and logRGDP operates through logOP. logIRE appears to be the initial receiver of any exogenous shocks that disturb the equilibrium of the panel system2. 4. Summary and Conclusions The objective of the paper was to examine the nexus between oil price and economic growth in five selected PICs. The choice of the five countries, namely Samoa, Solomon Islands, Tonga and Vanuatu was dictated by availability of reliable time series of data on macroeco- nomic variables. Unlike Papua New Guinea, the largest country with oil resources amongst all PICs, the five countries under study are dependent on imported fuel, as they have no fossil fuel energy resources, An earlier study on Fiji by Prasad et al. [5], which employed a bi-variate model, concluded that there was a positive association between oil price and growth. The reasoning behind the finding was that Fiji’s output since the mid 1980s was around 50% less than the potential output level and that the actual output had not reached a thre- shold level at which oil prices could negatively impact output. Our study employed a tri-variate model including one more variable, namely international reserves besides oil price and output, since the capacity of PICs to withstand the pressures of surge in oil price would be far greater than otherwise, to keep up high rate of investment in critical areas for maintaining economic growth. Adopting a panel cointegration procedure for empiri- cal investigation, which covered a 16-year period (1982-2007), the study found that while oil price nega- tively affected growth, international reserves positively influenced growth for the panel as a whole as well as in each of the five countries. Although no long-run Granger causality relationship could be established between oil price and growth, the study finding is that in the short run, the causality linkage ran from oil price and interna- tional reserves to output. The policy conclusions are clear. In the short-run, surges in oil price are beyond the control of small island nations and hence the scope for short-term measures is minimal. Towards reducing the immediate impact of increases in oil price, measures including reducing im- port duties and value added taxes, are appropriate. Al- though they would be politically correct, popular and easy, fiscal impacts of such measures are serious and they have to be faced sooner or later. Fall in revenue consequent to reduction in duties and taxes would affect budgetary position, giving rise to deficits or forcing gov- ernments to cut down essential expenditures, including maintenance of existing public assets including infra- structures. Governments in PICs have to seriously examine alter- nate long-term policy measures that adjust for high oil prices. Governments are already aware of good interna- tional practices towards ensuring efficient use of energy, such as use of energy lights, reduction and control on the use of energy in government buildings and public places. Time has now come to put them into practice without any delay. By adopting them, they can set an example to logRGDP logIRE logOP Direct: logIRE logRGDP, logOPlogRGDP logIRE logOP Indirect: logIR E logOP logRGDP Figure 1. Causality direction. (Note: logIRE logRGDP implies one-way causality.) 2The anonymous referee and the editor raise the concern on the poten- tial endogeneity problem of the international reserve variable (IRE). Interestingly, from our empirical results (see Table 6 and Figure 1), the IRE are rather exogenous comparatively to the rest of the variables, where the causalit y p attern were derived from IRE.  T. K. JAYARAMAN ET AL. Copyright © 2011 SciRes. ME 161 commercial firms in the private sector and households. Public utilities in PICs are heavily subsidized by gov- ernments, as they are not allowed to raise electricity ta- riffs. Adjustments in tariffs have to be effected to meet the rise in costs of electricity generation and distribution by the electricity authorities in all PICs. Similar adjust- ments have to be effected in regard to the imports of ve- hicles, which may not be as unpopular as in the case of electricity tariffs. Levying heavy import duties on luxury cars and heavy and small utility vehicles would be ap- propriate, as the incidence of taxes falls on the wealthy. By the same token, mass transport system has to be en- couraged with appropriate incentives. Private sector, which operates bus and other transport have to be en- couraged further with carefully designed incentive sys- tem, which would include reduction in import duties and other concessions in procurement of buses and trucks. In regard to electricity generation, all PICs, except Fiji and Vanuatu, presently rely mainly on diesel generators. Alternate energy resources including solar, hydro and wind power as well bio-gas need to be investigated. Al- though initial capital costs are high for hydropower projects, in the long run operating costs are low and pre- dictable, as compared with high volatility in oil price. Finally, PICs should resort to bulk fuel procurement programme. Presently, each PIC enters into a contract with suppliers of fuel, most of which is imported from Singapore. Instead, a common procurement programme through a competitive tendering process would help in obtaining larger reduction in fuel prices. The Pacific Isl- ands Forum, an intergovernmental regional organisation is already working on the proposal. If the proposal mate- rialises, pressures on international reserves would be reduced to a considerable extent. 5. Acknowledgements The authors are grateful to the anonymous referee and the Editor of this journal for helpful comments and sug- gestions that have substantially improved the quality of the present version. We are thankful for the comments and suggestions of the participnts at the International Borneo Business Conference (IBBC), Universiti Malay- sia Sabah, Kota Kinabalu, Sabah, 15-17 December 2008. All remaining flaws are the responsibility of the authors. 6. References [1] Australian Agency for International Development, “Pa- cific Economic Survey 08, Connecting the Region,” Commonwealth of Australia, Canberra, 2008. [2] United Nations Economic and Social Commission for Asia and Pacific (UNESCAP), “Economic and Social Survey 2008,” UNESCAP, Bangkok, 2008. [3] Asian Development Bank (ADB), “Asian Development Outlook 2008,” Manila, 2008. [4] Asian Development Bank (ADB), “The Challenge of Higher Oil Prices,” In: Asian Development Bank, Eds., Asian Development Outlook 2005 Update, ADB, Manila, 2005, pp. 65-86. [5] A. Prasad, P. K. Narayan and J. Narayan, “Exploring the Oil Price and Real GDP Nexus for a Small Island Econ- omy, the Fiji Islands,” Energy Policy, Vol. 35, No. 12, December 2007, pp. 6506-6513. doi:10.1016/j.enpol.2007.07.032 [6] World Bank, “World Development Indicators 2007, CD ROM,” The World Bank, Washington D.C., 2007. [7] Asian Development Bank (ADB), “Key Indicators of Developing Asian and Pacific Countries,” Manila, 2007. [8] T. Levantis, “Oil Price Vulnerability in the Pacific,” Pa- cific Economic Bulletin, Vol. 23, No. 2, 2008, pp. 214- 225. [9] J. Morris, “Small Island States bulk Fuel Procurement of Petroleum Products: Feasibility Study,” Pacific Islands Forum Secretariat, Suva, 2006. [10] A. Sanghi and A. Bartmanovich, “Harnessing Competi- tive Forces to Reduce Fuelcosts in Small Island Econo- mies,” Pacific Economic Bulletin, Vol. 22, 2007, pp. 175- 179. [11] K. A. Mork, “Oil Shocks and the Macroeconomy When Prices Go up and down: An Extension of Hamilton’s Re- sults,” Journal of Political Economy, Vol. 97, No. 3, 1989, pp. 740-744. doi:10.1086/261625 [12] K. Lee, S. Ni and R. A. Ratti, “Oil Shocks and the Ma- croeconomy: The Role of Price Variability,” Energy Journal, Vol. 16, No. 4, 1995, pp. 39-56. doi:10.5547/ISSN0195-6574-EJ-Vol16-No4-2 [13] J. Hamilton, “Oil and the Macroeconomy since the World War II,” Journal of Political Economy, Vol. 91, No. 2, 1983, pp. 228-248. doi:10.1086/261140 [14] J. Hamilton, “This Is What Happened to the Oil Price— Macroeconomy Relationship,” Journal of Monetary Economics, Vol. 38, No. 2, 1996, pp. 215-220. doi:10.1016/S0304-3932(96)01282-2 [15] J. Hamilton, “What Is an Oil Shock?” Journal of Econo- metrics, Vol. 113, No. 2, April 2003, pp. 363-398. doi:10.1016/S0304-4076(02)00207-5 [16] R. H. Rasche and J. Tatom, “Energy Price Shocks, Ag- gregate Supply and Monetary Policy: The Theory and the International Evidence,” Carnegie Rochester Conference Series on Public Policy, New York, 1981, pp. 9-93. [17] M. R. Darby, “The Price of Oil and World Inflation and Recession,” American Economic Review, Vol. 72, No. 4, 1982, pp. 738-751. [18] J. Burbidge and A. Harrison, “Testing for the Effects of Oil Price Rises Using Vector Autoregressions,” Interna- tional Economics Review, Vol. 25, No. 2, 1984, pp. 459- 484. doi:10.2307/2526209 [19] M. Gisser and T. H. Goodwin, “Crude Oil and the Ma- croeconomy: Tests of Some Popular Notions,” Journal of  T. K. JAYARAMAN ET AL. Copyright © 2011 SciRes. ME 162 Money, Credit and Banking, Vol. 18, No. 1, 1986, pp. 95-103. doi:10.2307/1992323 [20] R. Jiménez-Rodriguez and M. Sánchez, “Oil Price Shock and Real GDP Growth: Empirical Evidence for Some OECD Countries,” Applied Economics, Vol. 37, No. 2, 2005, pp. 201-228. doi:10.1080/0003684042000281561 [21] S. Kim and T. D. Willett, “Is the Negative Correlation between Inflation and Economic Growth? An Analysis of the Effect of the Oil Supply Shocks,” Applied Economics Letters, Vol. 7, No. 3, 2000, pp. 141-147. doi:10.1080/135048500351681 [22] Y. U. Glasure and A.-R. Lee, “The Impact of Oil Prices on Income and Energy,” International Advances in Eco- nomic Research, Vol. 8, No. 2, 2002, pp. 148-154. doi:10.1007/BF02295345 [23] IMF, “The Impact of High Oil Prices on the Global Economy,” Research Department, IMF, Washington DC, 2000. [24] G. S. Maddala and S. W. Wu, “A Comparative Study of Unit Root Tests with Panel Data and a New Simple Test,” Oxford Bulletin of Economics and Statistics, Vol. 61, Special Issue, 1999, pp. 631-652. doi:10.1111/1468-0084.61.s1.13 [25] K. Hadri, “Testing for Stationarity in Heterogeneous Panel Data,” Econometrics Journal, Vol. 3, No. 2, 2000, pp. 148-161. doi:10.1111/1368-423X.00043 [26] A. Levin, C.-F. Lin and C.-S. J. Chu, “Unit Root Tests in Panel Data: Asymptotic and Finite Sample Properties,” Journal of Econometrics, Vol. 108, No. 1, 2002, pp. 1-24. doi:10.1016/S0304-4076(01)00098-7 [27] K. S. Im, M. H. Pesaran and Y. Shin, “Testing for Unit Roots in Heterogeneous Panels,” Journal of Econometrics Vol. 115, No. 1, 2003, pp. 53-74. doi:10.1016/S0304-4076(03)00092-7 [28] P. Pedroni, “Critical Values for Cointegration Tests in Heterogeneous Panels with Multiple Regressors,” Oxford Bulletin of Economics and Statistics. Vol. 61, Special Is- sue, 1999, pp. 653-670. doi:10.1111/1468-0084.61.s1.14 [29] P. Pedroni, “Purchasing Power Parity Tests in Cointe- grated Panels,” The Review of Economics and Statistics, Vol. 83, No. 4, 2001, pp. 727-731. doi:10.1162/003465301753237803 [30] P. Pedroni, “Panel Cointegration: Asymptotic and Finite Sample Properties of Pooled Time Series Tests with an Application to the PPP Hypothesis,” Econometric Theory, Vol. 20, No. 3, 2004, pp. 597-625. doi:10.1017/S0266466604203073 [31] C. Kao, “Spurious Regression and Residual-Based Tests for Cointegration in Panel Data,” Journal of Econometrics, Vol. 90, No. 1, 1999, pp. 1-44. doi:10.1016/S0304-4076(98)00023-2 [32] P. Pedroni, “Fully Modified OLS for Heterogeneous Cointegrated Panels,” Advances in Econometrics, Vol. 15, 2000, pp. 93-130. doi:10.1016/S0731-9053(00)15004-2 [33] D. Holtz-Eakin, W. Newey and H. S. Rosen, “Estimating Vector Autoregressions with Panel Data,” Econometrica, Vol. 56, No. 6, 1988, pp. 1371-1395. doi:10.2307/1913103 [34] D. Holtz-Eakin, W. Newey and H. S. Rosen, “The Reve- nues-Expenditure Nexus: Evidence from Local Govern- ment Data,” International Economic Review, Vol. 30, No. 2, 1989, pp. 415-429. doi:10.2307/2526655 |