Vol.3, No.5, 365-370 (2011) Natural Science
http://dx.doi.org/10.4236/ns.2011.35049
Copyright © 2011 SciRes. OPEN ACCESS
A suggested statistical approach for dealing with the
non-significant interactions between treatments
Zakaria Mohamed Sawan
Cotton Research Institute, Agricultural Research Center, Ministry of Agriculture and Land Reclamation, Giza, Egypt;
zmsawan@hotmail.com
Received 21 January 2011; revised 20 February 2011; accepted 20 March 2011.
ABSTRACT
A field experiment was conducted to study the
effect of nitrogen (N) fertilizer and foliar appli-
cation of potassium (K) and Mepiquat Chloride
(MC) on yield of cotton. Seed cotton yield per
plant and seed cotton and lint yield per hectare;
have been increased due to the higher N rate
and use of foliar application of K and MC. No
significant interactions were found among the
variables in the present study (N, K and MC)
with respect to characters under investigation.
Generally, interactions indicated that, the fa-
vorable effects ascribed to the application of N;
spraying cotton plants with K combined with
MC on cotton productivity, were more obvious
by applying N at 143 kg per hectare, and com-
bined with spraying cotton plants with K at 957 g
per hectare and also with MC at 48 + 24 g active
ingredient per hectare. Sensible increases were
found in seed cotton yield per hectare (about
40%) as a result of applying the same combina-
tion. However, this interaction did not reach the
level of significance, so, statistical approach for
dealing with the non-significant interactions
between treatments, depending on the Least
Significant Difference values has been sug-
gested, to provide an opportunity to disclosure
of the interaction effects regardless of their in-
significance. As a matter of fact the original
formula used in calculating the significance of
interactions suffers a possible shortage, which
can be eliminated through applying the new
suggested formula.
Keywords: Cotton Yield; Mepiquat Chloride;
Nitrogen; Non-Significant Interactions; Potassium
1. INTRODUCTION
Managing the balance of vegetative and reproductive
growth is the essence of managing a cotton crop. It is
well known from numerous fertilizer experiments that
the yield of field crop has been dependent strongly on
the supply of mineral nutrients [1-3]. Excess of vegeta-
tive growth, poor bud development, shedding of fruiting
forms, and growth imbalance between the source and
sink are responsible for the unpredictable behavior of the
crop. Several approaches have tried-out to break this
yield plateau, among them the application of plant
growth regulators (PGR’s), particularly Mepiquat Chlo-
ride (MC) that has received greater attention recent years
[4,5].
The objective of this study was to evaluate the effects
of N fertilization rate, foliar K application, and MC ap-
plication on the yield of cotton with the aim to identify
production treatments that may improve the yield. Also,
we suggested a statistical approach for dealing with the
non-significant interactions between treatments depend-
ing on the Least Significant Difference values, regard-
less of statistical insignificance.
2. MATERIALS AND METHODS
A Field experiment was conducted at the Agricultural
Research Center, Ministry of Agriculture in Giza (30˚N,
31˚28'E and 19 m altitude), Egypt using the cotton cul-
tivar “Giza 86” (Gossypium barbadense L.) in I and II
seasons. The soil texture in both seasons was a clay loam,
with an alluvial substratum, (pH = 8.10, 44.75% clay,
27.40% silt, 20.00% fine sand, 3.00% coarse sand,
2.85% calcium carbonate and 1.85% organic matter).
Each experiment included 16 treatment combinations of:
1) two N rates (95 and 143 kg N per hectare), which
were applied as ammonium nitrate (NH4NO3, 33.5% N)
at two equal doses, 6 and 8 weeks after planting. Each
application (in the form of pinches beside each hill) was
followed immediately by irrigation. 2) four K rates (0,
319, 638 and 957 g K per hectare) were applied as po-
tassium sulfate (K2SO4, “40% K”) as a foliar spray, 70
and 95 days after planting (during square initiation and
Z. M. Sawan / Natural Science 3 (2011) 365-370
Copyright © 2011 SciRes. OPEN ACCESS
366
boll development stage). The solution volume applied
was 960 L per hectare. 3) two rates from the PGR,
1,1-dimethylpiperidinium chloride (Mepiquat Chloride
“MC” or “Pix”) were foliar applied (75 days after plant-
ing at 0 or 48 g active ingredient per hectare, 90 days
after planting at 0 and 24 g active ingredient per hectare)
where the solution volume applied was also 960 L per
hectare. The K and MC were applied to the leaves with
uniform coverage using a knapsack sprayer. The pres-
sure used was 0.4 kg per cm2, resulting in a nozzle out-
put of 1.43 L per min. The application was carried out
between 9.0 and 11.0 h.
A randomized complete block design with four repli-
cations was used for both experiments. Seeds were
planted on 3 April, in season I and 20 April, in season II.
Plot size was 1.95 × 4 m including three ridges (beds)
(after the precaution of border effect was taken into con-
sideration). Hills were spaced 25 cm apart on one side of
the ridge, with seedlings thinned to two plants hill1 six
weeks after planting. This provided a plant density of
123 000 plants per hectare. The total amount of irriga-
tion applied during the growing season (surface irriga-
tion) was about 6 000-m3 per hectare. The first irrigation
was applied three weeks after planting, with the second
three weeks later. Thereafter, plots were irrigated every
two weeks until the end of the season (October 11, in
season I and October 17, in season II, respectively), for a
total of nine irrigations. On the basis of soil test results,
phosphorus (P) fertilizer was applied at the rate of 24 kg
P per hectare as calcium super phosphate during land
preparation. The K fertilizer was applied at the rate of
47 kg K per hectare as potassium sulfate before the first
irrigation (the recommended level for semi-fertile soil).
Fertilization (P and K), along with pest and weed man-
agement was carried out during the growing season, ac-
cording to the local practice performed at the experi-
mental station.
In both seasons, ten plants were randomly taken from
the center ridge of each plot to determine the seed cotton
yield in g per plant. First hand picking was made on 20
and 26 September and final picking on 11 and 17 Octo-
ber in season I, and season II, respectively. Total seed
cotton yield of each plot (including ten plant sub sam-
ples) was ginned to determine seed cotton and lint yield
(kg per hectare).
Results were analyzed as a factorial experiment in a
randomized complete block design for the studied char-
acters each season and the combined statistical analysis
for the two seasons, following the procedure outlined by
Snedecor and Cochran [6]. The Least Significant Dif-
ference (L.S.D.) test method, at 5% level of significance
was used to verify the significance of differences among
treatment means and the interactions to determine the
optimum combination of N, K and MC.
3. RESULTS AND DISCUSSION
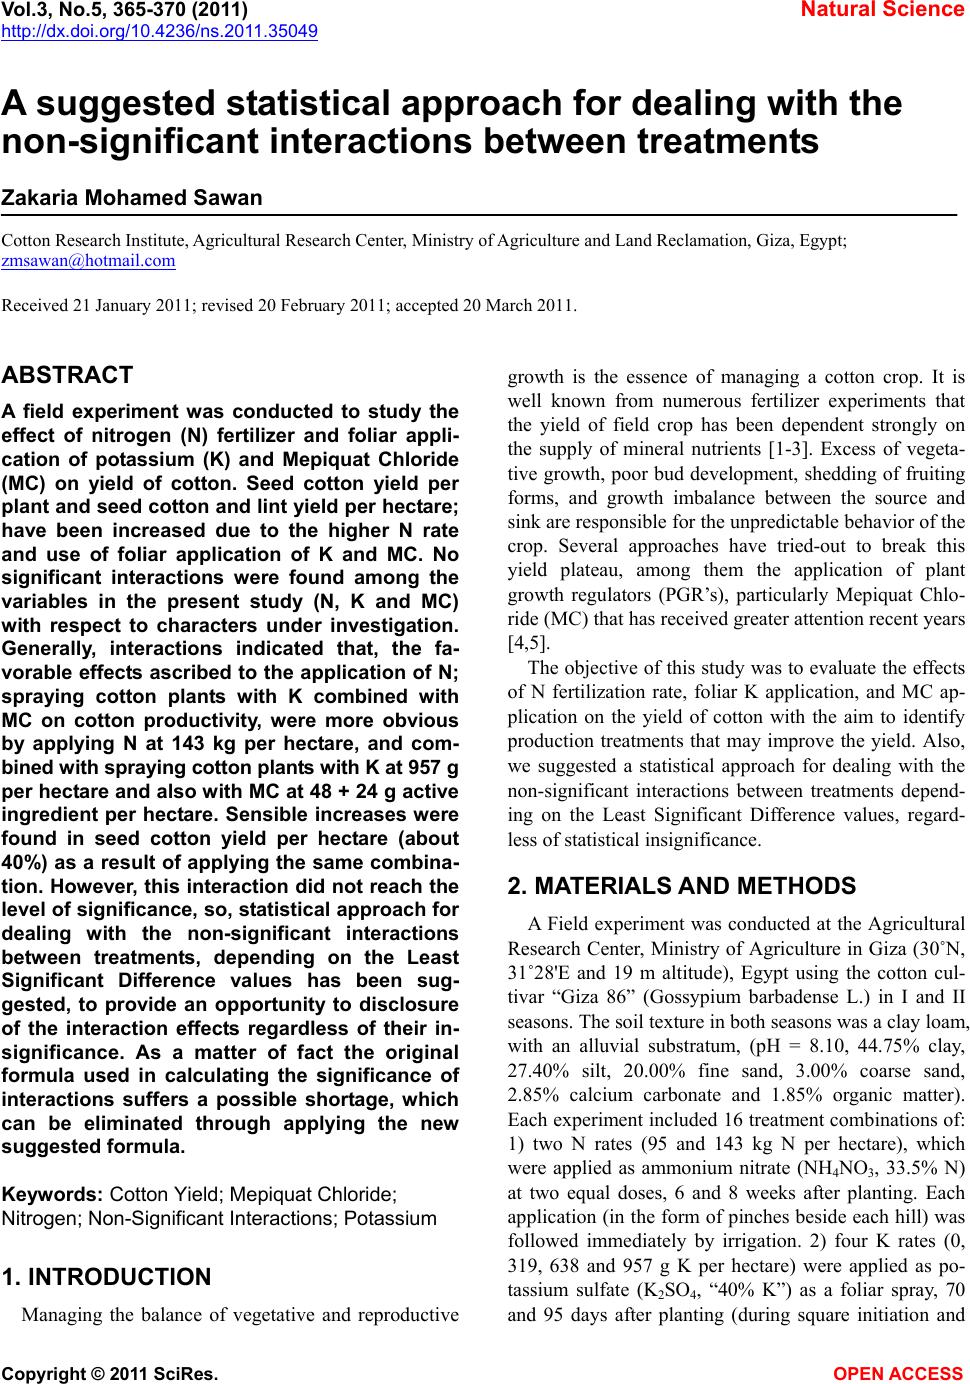
Results from the analysis of variance for yield (com-
bined data of the two seasons) are presented in Table 1.
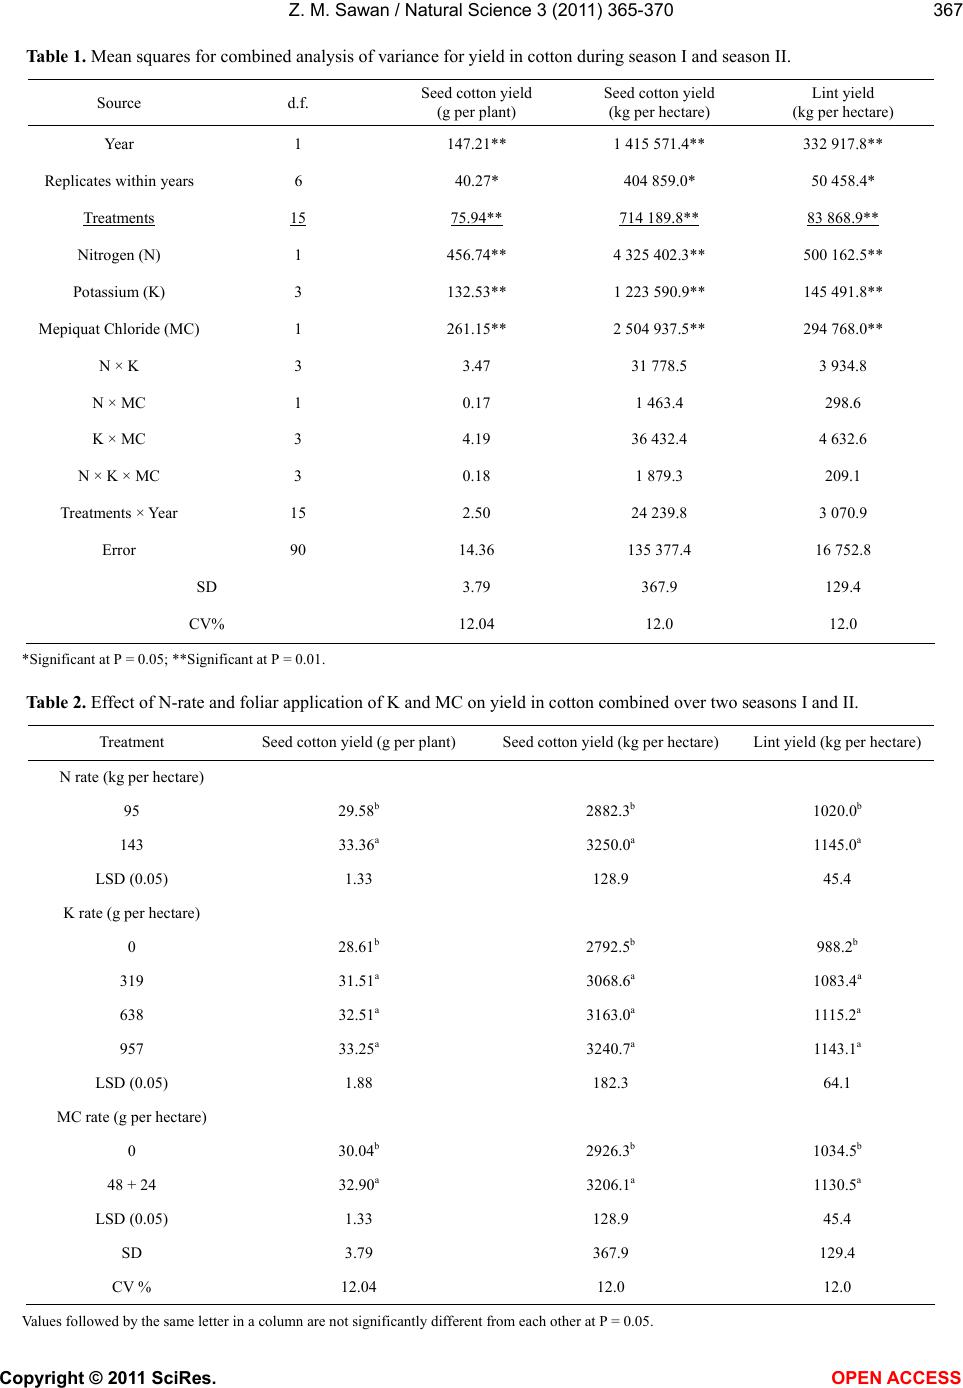
3.1. Effects of Main Treatments on Yield
Seed cotton yield per plant, as well as seed cotton and
lint yield per hectare, were increased by as much as 12.8,
12.8, and 12.3%, respectively, when the nitrogen rate
was increased (Table 2). There were both increased boll
numbers and boll weight, which was attributed to the
fact that N is an important nutrient for control of new
growth and preventing abscission of squares and bolls
and is also essential for photosynthetic activity [7,8].
When K was applied at all three K rates (319, 638 and
957 g K per hectare), seed cotton yield plant1 and seed
cotton and lint yield ha1 were also increased. These
increases could be attributed to the favorable effects of K
on yield components, i.e. number of opened bolls per
plant, and boll weight, leading consequently to higher
cotton yield [9,10]. Mepiquat Chloride, significantly
increased seed cotton yield per plant, as well as seed
cotton and lint yield per hectare (by 9.5, 9.6, and 9.3%,
respectively), compared to the untreated control. These
results may be attributed to the promoting effect of this
substance that has beneficial and supplemental affects
leading to yield enhancement (boll retention and boll
weight) [11].
3.2. Effects of Interactions between
Treatments on Yield
No significant interactions were found among the
variables in the present study (N rates, K rates and MC)
with respect to the characters under investigation. Gen-
erally, interactions indicated that, the favorable effects
accompanied the application of N; spraying cotton plants
with K combined with MC on cotton productivity, was
more obvious by applying N at 143 kg per hectare, and
combined with spraying cotton plants with K at 957 g
per hectare and also with MC at 48 + 24 g active ingre-
dient per hectare. Regarding the non-significant interac-
tion effects, sensible increases were found in seed cotton
yield per hectare (about 40%) as a result of applying the
same combination.
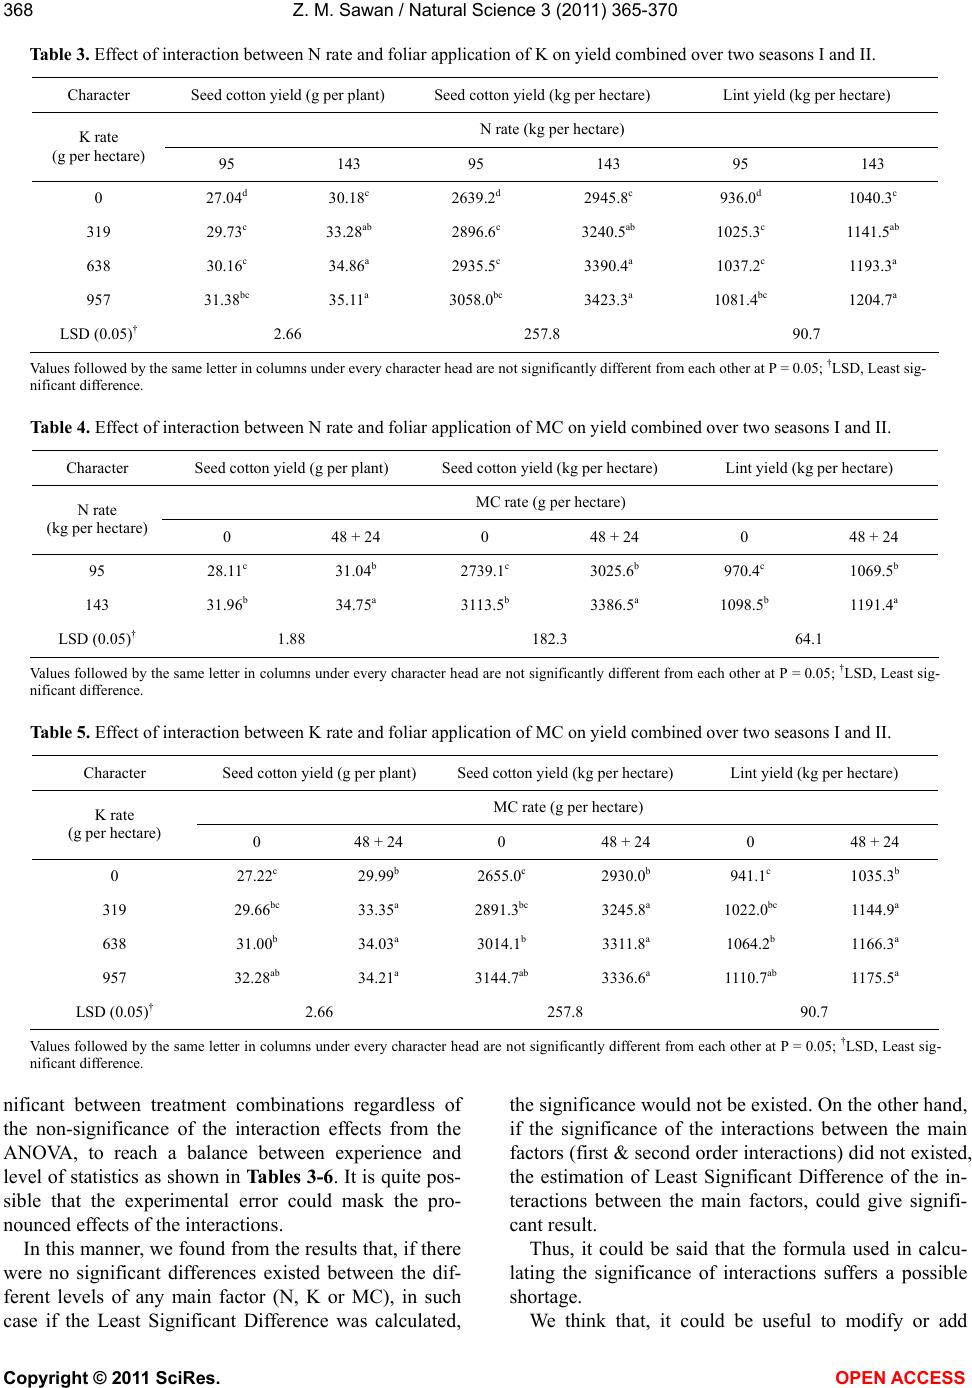
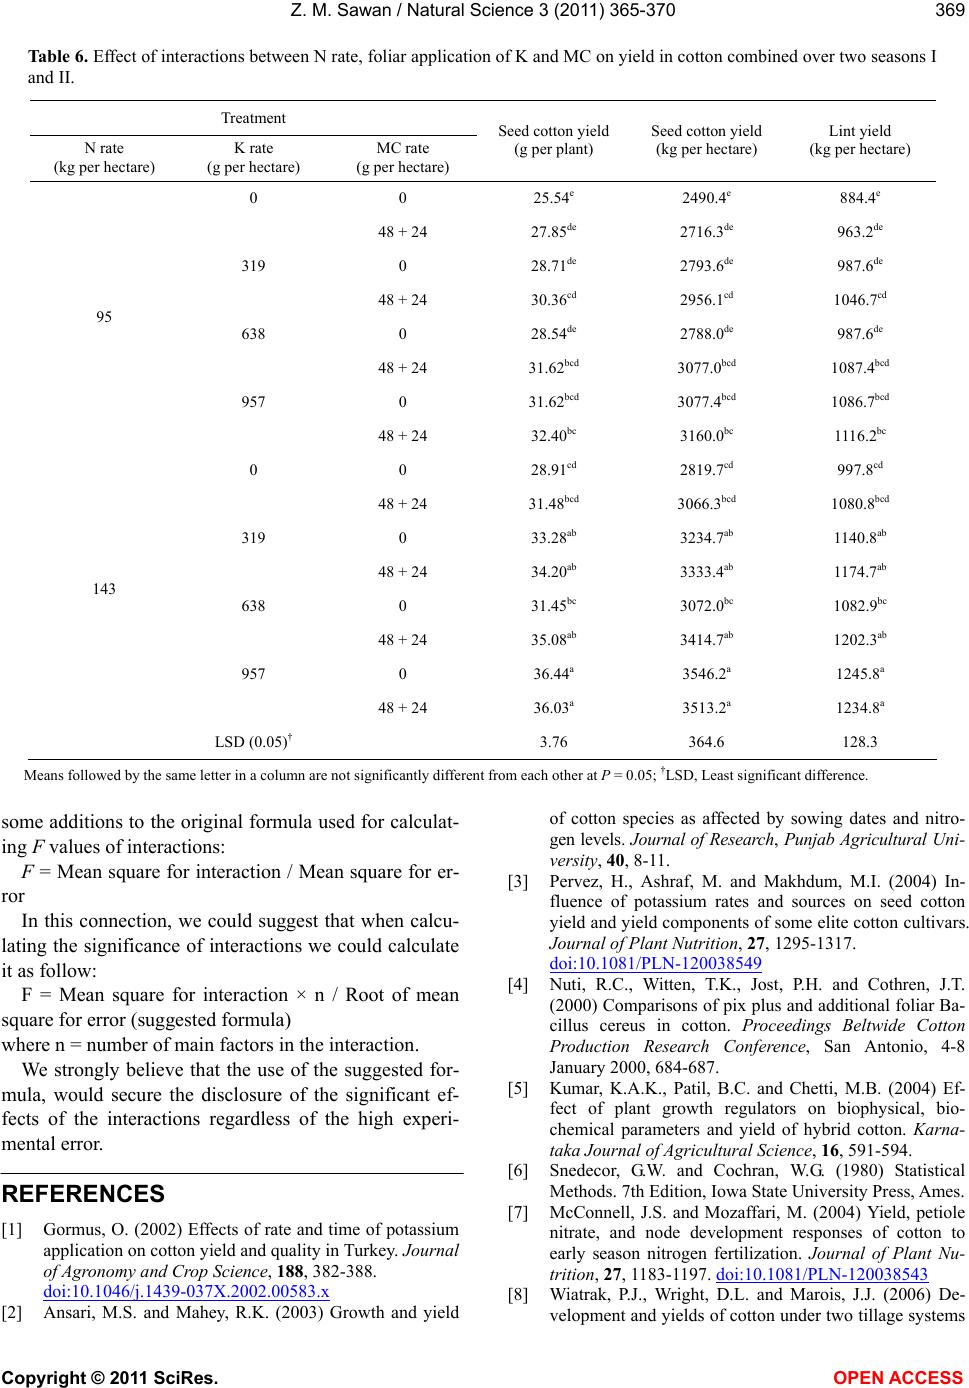
In this experiment there are sensible differences be-
tween the interactions, i.e. the first order (Tables 3-5),
and the second order (Table 6). However, these interac-
tions did not reach the level of significance, so, sug-
gested statistical approach for dealing with the non-sig-
nificant interactions between treatments, depending on
the Least Significant Difference values to verify the sig-
Z. M. Sawan / Natural Science 3 (2011) 365-370
Copyright © 2011 SciRes. OPEN ACCESS
367
Table 1. Mean squares for combined analysis of variance for yield in cotton during season I and season II.
Source d.f.
Seed cotton yield
(g per plant)
Seed cotton yield
(kg per hectare)
Lint yield
(kg per hectare)
Year 1 147.21** 1 415 571.4** 332 917.8**
Replicates within years 6 40.27* 404 859.0* 50 458.4*
Tr eatments 15 75.94** 714 189.8** 83 868.9**
Nitrogen (N) 1 456.74** 4 325 402.3** 500 162.5**
Potassium (K) 3 132.53** 1 223 590.9** 145 491.8**
Mepiquat Chloride (MC) 1 261.15** 2 504 937.5** 294 768.0**
N × K 3 3.47 31 778.5 3 934.8
N × MC 1 0.17 1 463.4 298.6
K × MC 3 4.19 36 432.4 4 632.6
N × K × MC 3 0.18 1 879.3 209.1
Treatments × Year 15 2.50 24 239.8 3 070.9
Error 90 14.36 135 377.4 16 752.8
SD 3.79 367.9 129.4
CV% 12.04 12.0 12.0
*Significant at P = 0.05; **Significant at P = 0.01.
Table 2. Effect of N-rate and foliar application of K and MC on yield in cotton combined over two seasons I and II.
Treatment Seed cotton yield (g per plant) Seed cotton yield (kg per hectare) Lint yield (kg per hectare)
N rate (kg per hectare)
95 29.58b 2882.3b 1020.0b
143 33.36a 3250.0a 1145.0a
LSD (0.05) 1.33 128.9 45.4
K rate (g per hectare)
0 28.61b 2792.5b 988.2b
319 31.51a 3068.6a 1083.4a
638 32.51a 3163.0a 1115.2a
957 33.25a 3240.7a 1143.1a
LSD (0.05) 1.88 182.3 64.1
MC rate (g per hectare)
0 30.04b 2926.3b 1034.5b
48 + 24 32.90a 3206.1a 1130.5a
LSD (0.05) 1.33 128.9 45.4
SD 3.79 367.9 129.4
CV % 12.04 12.0 12.0
Values followed by the same letter in a column are not significantly different from each other at P = 0.05.
Z. M. Sawan / Natural Science 3 (2011) 365-370
Copyright © 2011 SciRes. OPEN ACCESS
368
Table 3. Effect of interaction between N rate and foliar application of K on yield combined over two seasons I and II.
Character Seed cotton yield (g per plant) Seed cotton yield (kg per hectare) Lint yield (kg per hectare)
N rate (kg per hectare)
K rate
(g per hectare) 95 143 95 143 95 143
0 27.04d 30.18c 2639.2d 2945.8c 936.0d 1040.3c
319 29.73c 33.28ab 2896.6c 3240.5ab 1025.3c 1141.5ab
638 30.16c 34.86a 2935.5c 3390.4a 1037.2c 1193.3a
957 31.38bc 35.11a 3058.0bc 3423.3a 1081.4bc 1204.7a
LSD (0.05) 2.66 257.8 90.7
Values followed by the same letter in columns under every character head are not significantly different from each other at P = 0.05; LSD, Least sig-
nificant difference.
Table 4. Effect of interaction between N rate and foliar application of MC on yield combined over two seasons I and II.
Character Seed cotton yield (g per plant) Seed cotton yield (kg per hectare) Lint yield (kg per hectare)
MC rate (g per hectare)
N rate
(kg per hectare) 0 48 + 24 0 48 + 24 0 48 + 24
95 28.11c 31.04b 2739.1c 3025.6b 970.4c 1069.5b
143 31.96b 34.75a 3113.5b 3386.5a 1098.5b 1191.4a
LSD (0.05) 1.88 182.3 64.1
Values followed by the same letter in columns under every character head are not significantly different from each other at P = 0.05; LSD, Least sig-
nificant difference.
Table 5. Effect of interaction between K rate and foliar application of MC on yield combined over two seasons I and II.
Character Seed cotton yield (g per plant) Seed cotton yield (kg per hectare) Lint yield (kg per hectare)
MC rate (g per hectare)
K rate
(g per hectare) 0 48 + 24 0 48 + 24 0 48 + 24
0 27.22c 29.99b 2655.0c 2930.0b 941.1c 1035.3b
319 29.66bc 33.35a 2891.3bc 3245.8a 1022.0bc 1144.9a
638 31.00b 34.03a 3014.1b 3311.8a 1064.2b 1166.3a
957 32.28ab 34.21a 3144.7ab 3336.6a 1110.7ab 1175.5a
LSD (0.05) 2.66 257.8 90.7
Values followed by the same letter in columns under every character head are not significantly different from each other at P = 0.05; LSD, Least sig-
nificant difference.
nificant between treatment combinations regardless of
the non-significance of the interaction effects from the
ANOVA, to reach a balance between experience and
level of statistics as shown in Tables 3-6. It is quite pos-
sible that the experimental error could mask the pro-
nounced effects of the interactions.
In this manner, we found from the results that, if there
were no significant differences existed between the dif-
ferent levels of any main factor (N, K or MC), in such
case if the Least Significant Difference was calculated,
the significance would not be existed. On the other hand,
if the significance of the interactions between the main
factors (first & second order interactions) did not existed,
the estimation of Least Significant Difference of the in-
teractions between the main factors, could give signifi-
cant result.
Thus, it could be said that the formula used in calcu-
lating the significance of interactions suffers a possible
shortage.
We think that, it could be useful to modify or add
Z. M. Sawan / Natural Science 3 (2011) 365-370
Copyright © 2011 SciRes. OPEN ACCESS
369
Table 6. Effect of interactions between N rate, foliar application of K and MC on yield in cotton combined over two seasons I
and II.
Treatment
N rate
(kg per hectare)
K rate
(g per hectare)
MC rate
(g per hectare)
Seed cotton yield
(g per plant)
Seed cotton yield
(kg per hectare)
Lint yield
(kg per hectare)
0 0 25.54e 2490.4e 884.4e
48 + 24 27.85de 2716.3de 963.2de
319 0 28.71de 2793.6de 987.6de
48 + 24 30.36cd 2956.1cd 1046.7cd
638 0 28.54de 2788.0de 987.6de
48 + 24 31.62bcd 3077.0bcd 1087.4bcd
957 0 31.62bcd 3077.4bcd 1086.7bcd
95
48 + 24 32.40bc 3160.0bc 1116.2bc
0 0 28.91cd 2819.7cd 997.8cd
48 + 24 31.48bcd 3066.3bcd 1080.8bcd
319 0 33.28ab 3234.7ab 1140.8ab
48 + 24 34.20ab 3333.4ab 1174.7ab
638 0 31.45bc 3072.0bc 1082.9bc
48 + 24 35.08ab 3414.7ab 1202.3ab
957 0 36.44a 3546.2a 1245.8a
143
48 + 24 36.03a 3513.2a 1234.8a
LSD (0.05) 3.76 364.6 128.3
Means followed by the same letter in a column are not significantly different from each other at P = 0.05; LSD, Least significant difference.
some additions to the original formula used for calculat-
ing F values of interactions:
F = Mean square for interaction / Mean square for er-
ror
In this connection, we could suggest that when calcu-
lating the significance of interactions we could calculate
it as follow:
F = Mean square for interaction × n / Root of mean
square for error (suggested formula)
where n = number of main factors in the interaction.
We strongly believe that the use of the suggested for-
mula, would secure the disclosure of the significant ef-
fects of the interactions regardless of the high experi-
mental error.
REFERENCES
[1] Gormus, O. (2002) Effects of rate and time of potassium
application on cotton yield and quality in Turkey. Journal
of Agronomy and Crop Science, 188, 382-388.
doi:10.1046/j.1439-037X.2002.00583.x
[2] Ansari, M.S. and Mahey, R.K. (2003) Growth and yield
of cotton species as affected by sowing dates and nitro-
gen levels. Journal of Research, Punjab Agricultural Uni-
versity, 40, 8-11.
[3] Pervez, H., Ashraf, M. and Makhdum, M.I. (2004) In-
fluence of potassium rates and sources on seed cotton
yield and yield components of some elite cotton cultivars.
Journal of Plant Nutrition, 27, 1295-1317.
doi:10.1081/PLN-120038549
[4] Nuti, R.C., Witten, T.K., Jost, P.H. and Cothren, J.T.
(2000) Comparisons of pix plus and additional foliar Ba-
cillus cereus in cotton. Proceedings Beltwide Cotton
Production Research Conference, San Antonio, 4-8
January 2000, 684-687.
[5] Kumar, K.A.K., Patil, B.C. and Chetti, M.B. (2004) Ef-
fect of plant growth regulators on biophysical, bio-
chemical parameters and yield of hybrid cotton. Karna-
taka Journal of Agricultural Science, 16, 591-594.
[6] Snedecor, G.W. and Cochran, W.G. (1980) Statistical
Methods. 7th Edition, Iowa State University Press, Ames.
[7] McConnell, J.S. and Mozaffari, M. (2004) Yield, petiole
nitrate, and node development responses of cotton to
early season nitrogen fertilization. Journal of Plant Nu-
trition, 27, 1183-1197. doi:10.1081/PLN-120038543
[8] Wiatrak, P.J., Wright, D.L. and Marois, J.J. (2006) De-
velopment and yields of cotton under two tillage systems
Z. M. Sawan / Natural Science 3 (2011) 365-370
Copyright © 2011 SciRes. OPEN ACCESS
370
and nitrogen application following white lupine grain
crop. Journal Cotton Science, 10, 1-8.
[9] Pettigrew, W.T., Meredith, W.R. Jr. and Young, L.D.
(2005) Potassium fertilization effects on cotton lint yield,
yield components, and reniform nematode populations.
Agronomy Journal, 97, 1245-1251.
doi:10.2134/agronj2004.0321
[10] Sharma, S.K. and Sundar, S. (2007) Yield, yield attributes
and quality of cotton as influenced by foliar application
of potassium. Journal of Cotton Research and Develop-
ment, 21, 51-54.
[11] Prakash, R., Prasad, M. and Pachauri, D.K. (2001) Effect
of nitrogen, chlormequat chloride and FYM on growth
yield and quality of cotton (Gossypium hirsutum L.).
Annals of Agricultural Research, 22, 107-110.