J. Biomedical Science and Engineering, 2011, 4, 403-409
doi:10.4236/jbise.2011.45051 Published Online May 2011 (http://www.SciRP.org/journal/jbise/
JBiSE
).
Published Online May 2011 in SciRes. http://www.scirp.org/journal/JBiSE
MicrobMatcher: a microbial comparison software based on
matrix-assisted laser desorption/ionization with time-of-flight
mass spectrometry
Yizhen Fu, Feng Liu*, Yalu Ye
Depatment of Software Engineering, Wuhan University, Wuhan, China.
Email: wolflf@126.com, fafaisland@gmail.com, shell.yeyalu@gmail.com
Received 10 March 2011; revised 25 March 2011; accepted 25 April 2011.
ABSTRACT
Matrix-assisted Laser Desorption/Ionization with
Time-of-flight Mass Spectrometry (MALDI-TOFMS)
was investigated as a method for the rapid identifica-
tion of species. Current demand in microbial identi-
fication is how to compare unknown strains to the
known one quickly, semi-automatically and accu-
rately. In this paper, we present a software tool that
allows flexibly microbial matching in a user-friendly
way, by letting the users to customize comparison
parameters including: in vitro transcription enzyme,
mass tolerance, minimum fragment length, intensity
threshold and corresponding weights. We provide
three spectral scoring functions to compute the affin-
ity between the species. Therefore, the precision of
microbial comparison increases. To test and verify
this tool, we employed experimental spectral data
based on MALDI-TOFMS and the gene sequences of
E.coli and Salmonella. This software is written in
Java for cross-platform intention.
Keywords: Microbial Comparison; Matrix-Assisted
Laser Desorption/Ionization with Time-of-Flight
Mass Spectrometry
1. INTRODUCTION
MALDI-TOFMS is an analytical technique that meas-
ures the mass-to-charge ratio of charged particles. It is
used for determining masses of particles, for determining
the elemental composition of a sample or molecule, and
for elucidating the chemical structures of molecules,
such as peptides and other chemical compounds. With
the development of this technology, microbial identifica-
tion by mass cataloging has attracted considerable atten-
tion owing to its high efficiency and automation. Mean-
while, there is a current demand that to compare mass
spectrometric observables with theoretical fragmentation
patterns, and further to determine the genetic affinity
between the sample gene and genes of known species in
the database quickly, semi-automatically and accurately.
Within this context, our paper presents a software tool
that allows flexibly microbial matching in a user-friendly
way. When it comes to the matching speed and accuracy,
this software provides three spectral scoring functions to
compute the coincidence between the species. As for the
semi-automation, the tool allows the users to customize
comparison parameters including: transcription enzyme,
mass tolerance, minimum fragment length, intensity
threshold and corresponding weight.
To test and verify this tool, we employed the experi-
mental spectra data based on MALDI-TOFMS and the
gene sequences of E.coli and Salmonella.
The remainder of the document is structured as fol-
lows. We present three algorithms for computing the
coincidence between the sample gene and genes of
known species in Section 2, followed by the description
and the verification of the software separately in Section
3 and Section 4. Subsequently, related work is discussed
in Section 5. Finally, Section 6 concludes.
2. ALGORITHM
2.1. Overall Algorithm
The overall algorithm in comparison process is as fol-
low:
1) Amend the gene sequence of the known reference
species according to the transcription enzyme. To form
the theoretical gene sequence, if the promoter is T7, the
nucleotide sequence “TTCTATAGTGTCACCTAAAT”
will be added to the original one, while If the promoter is
Sp6, reverse and complement(A-T, G-C) the original
gene sequence, and then add the nucleotide sequence
“CCCTATAGTGAGTCGTATTAC” as its subsequence.
2) Cut the theoretical gene sequence after every base
G’, omitting the fragments which have less than L nu-
Y. Z. Fu et al. / J. Biomedical Science and Engineering 4 (2011) 403-409
404
cleotides. L is determined by the user.
3) Calculate the mass of all fragments (also referred to
as ‘fingerprint biomarkers’) from the sequence and then
form the sequence’s mass vector. The mass of every
fragment is:
-329.2 305.2
361.2 18.0148 1.0072
MfragmentAG
T
 
 Da
(1)
A, G, C and T separately stand for the one-to-one total
number of Adenylic acid, Guanylic acid, Cytidylic acid
and Thymidylic acid in each fragment.
4) Take the mass vector of the gene sequence and cal-
culate the score indicating their similarity by using one
of the spectral scoring functions introduced below.
2.2. The First Spectral Scoring Function
The first spectral scoring function [1] in our work is as
follow:
Let N denote the total number of fingerprint bio-
markers in the given theoretical gene sequence. A vector
u of length N is constructed. The elements of u contain
0’s and 1’s. The ith element of u is 0 if the ith fingerprint
peak is not observed in the blinded sample and 1 if the
mass of ith fragment is observed within tolerance in the
blinded sample. The number of 1’s in u (or sum of all
elements of u) indicates the number of fingerprint bio-
markers observed in the blinded sample.
For each blinded sample and each reference species,
likelihood is computed based on the number of frag-
ments observed in the blinded sample. This likelihood is
a value between 0 and 1. If the likelihood is close to 1,
then the reference bacterium is determined to be present.
If the likelihood is close to 0, then the blinded sample
does not contain the significant fingerprint biomarkers,
and the reference is determined to be absent.
2.3. The Second Spectral Scoring Function
Based on the first method, the second spectral scoring
function [2] in our work allows the user to define two
intensities, partitioning the whole experimental peaks
into three parts: the first peaks list, whose intensities are
higher than the larger defined intensity; the second peaks
list, whose intensities are between the two defined inten-
sities; and the third peaks list, whose intensities are
lower than the smaller defined intensity. Furthermore,
users can assign the credibility for the three intervals of
peaks, and give weights for them separately, but the
weighted sum must be one. This method considers the
reliability of the intensities and involves the users’ ex-
perience. The scoring function is as follow:
11223 3DMPWMPW MPWN (1)
where:
MP1 is the number of the matched fragments between
the theoretical fragments and the experimental peaks
whose intensities are higher than the larger defined in-
tensity.
MP2 is the number of the matched fragments between
the theoretical fragments and the experimental peaks
whose intensities are lower than the larger defined inten-
sity and higher than the smaller defined intensity.
MP3 is the number of the matched fragments between
the theoretical fragments and the experimental peaks
whose intensities are lower than the smaller defined in-
tensity.
W1, W2 and W3 are separately the credibility of the
three intervals of peaks corresponding to MP1, MP2 and
MP3.
N is the total number of fingerprint biomarkers in the
given theoretical gene sequence.
A higher score indicates more genetic affinity, indi-
cating a higher possibility of being the same species.
2.4. The Third Spectral Scoring Function
The third spectral scoring function [2,3] in our work is
as follow:
 
2*MM
C
M
MMM

  (3)
The scalar product (often referred to as a ‘dot-product’)
of two mass in the function is defined as:
12
11
δ
NN
ij
ij
M
Mm

m
 
 (4)
where M is the mass vector of one sample’s fragmenta-
tion, which has N1 fragments with mi standing for the
mass of the ith fragment, while M' is the mass vector of
the other sample’s fragmentation, which has N2 frag-
ments with standing for the jth fragment. The discrete
delta function δ is:

1; δ
δ
0; otherwise
k
k
(5)
Given inevitable experimental inaccuracy, the discrete
delta function δ can be further modified to be:

1;t o l era n c e
δ
0;otherwise
k
k
(6)
Based on the formulas, the inner-product is greater if
the two samples have more fragments of the same mass.
The spectral scoring function normalizes the in-
ner-product value to a range between zero and one, and a
high value of the spectral scoring function indicates a
higher possibility of being the same species.
C
opyright © 2011 SciRes. JBiSE
Y. Z. Fu et al. / J. Biomedical Science and Engineering 4 (2011) 403-409
Copyright © 2011 SciRes.
405
3. SOFTWARE tion of the experimental inaccuracy by means of adopt-
ing tolerance, and finally provides the comparison con-
sequence of the selected method. For further research, it
is available for users to save the comparison result as a
txt report file. Figures 2, 3 and 4 separately represent the
user interfaces of the three scoring methods in the soft-
ware.
To perform microbial comparison, the software uses the
exported ASCII Spectrometry .txt file from DataEx-
plorer (Figure 1), whose data is the mass-intensity spec-
trometry result from MALDI-TOFMS, and the theoretic
gene sequence of the known reference species, either .txt
file imported from the local file system or direct text
pasted in the blank box, as inputs. The software offers
three spectral scoring functions mentioned above, and
users can choose one of them to calculate the coinci-
dence between the experimental data and the theoretic
DNA sequence. In all the three methods, users are free to
customize some conditional parameters in their mass-
spectrometry experiment, including: in vitro transcrip-
tion enzyme-either T7 or Sp6, mass tolerance, minimum
fragment length and intensity threshold. In addition, in
Method 2, users can customize the intensity range and
corresponding weight according to their previous ex-
perience of the importance of the peaks among the rela-
tive intensity scope. Subsequently, the software parses
the input file, generates peak lists after filtering peak
values below the intensity threshold, with the considera-
4. VERIFICATION
This paper presents two parts of experiments, the nega-
tive control and the positive one, to verify the accuracy
and the utility of the software.
In the negative control, we divide it into two parts,
and in each part we use five sets of data from five sepa-
rate experiments of one species and the DNA sequence
of another species as input to test the consequence of
inconsistence. For example, we calculate the coincidence
between the theoretic sequence of E.coli and each set of
the experimental data of Salmonella. To ensure justice,
we control the experimental conditions with the same
parameters. Ta b l e 1 shows the results of these negative
control experiments.
Figure 1. Mass-intensity spectrometry of the experimental gene in DataExplorer.
JBiSE
Y. Z. Fu et al. / J. Biomedical Science and Engineering 4 (2011) 403-409
406
Figure 2. The user interface of Method 1.
Figure 3. The user interface of Method 2.
C
opyright © 2011 SciRes. JBiSE
Y. Z. Fu et al. / J. Biomedical Science and Engineering 4 (2011) 403-409
Copyright © 2011 SciRes.
407
Figure 4. The user interface of Method 3.
Table 1. The results of the negative control experiments.
Coincidence
Negative
Control Theoretic
Sequence Experimental
Data Method 1 Method 2 Method 3
E.coli Salmonella (1) 0 0.005 925 925 925 925 9300
E.coli Salmonella (2) 0 0.002 962 962 962 962 9600
E.coli Salmonella (3) 0 0.005 925 925 925 925 9300
E.coli Salmonella (4) 0 0.004 444 444 444 444 44000
Part I
E.coli Salmonella (5) 0 0.005 925 925 925 925 9300
Salmonella E.coli (1) 0.035 714 285 714 285 700.032 142 857 142 857 101.75E-04
Salmonella E.coli (2) 0.035 714 285 714 285 700.032 142 857 142 857 102.42E-04
Salmonella E.coli (3) 0 0 0
Salmonella E.coli (4) 0.035 714 285 714 285 700.032 142 857 142 857 102.92E-04
Part II
Salmonella E.coli (5) 0.035 714 285 714 285 700.032 142 857 142 857 100.001 472 754 050 073 6400
We find that the results of the coincidence are all too
low for the microbe to be classified as the certain species
of the theoretic sequence. In other words, it demonstrates
that the experimental species is probably not the same
kind as the theoretical species, which accords with our
expectation.
Meanwhile, in the positive control, we divide it into
two parts as well, and we use five sets of data from five
separate experiments of one species and the DNA se-
quence of the same species as input. For instance, the
coincidence between the theoretic sequence of E.coli and
its experimental data is calculated. Also, the circum-
stance of each experiment remains the same as to ensure
fairness. Table 2 shows the results of the positive control
JBiSE
Y. Z. Fu et al. / J. Biomedical Science and Engineering 4 (2011) 403-409
408
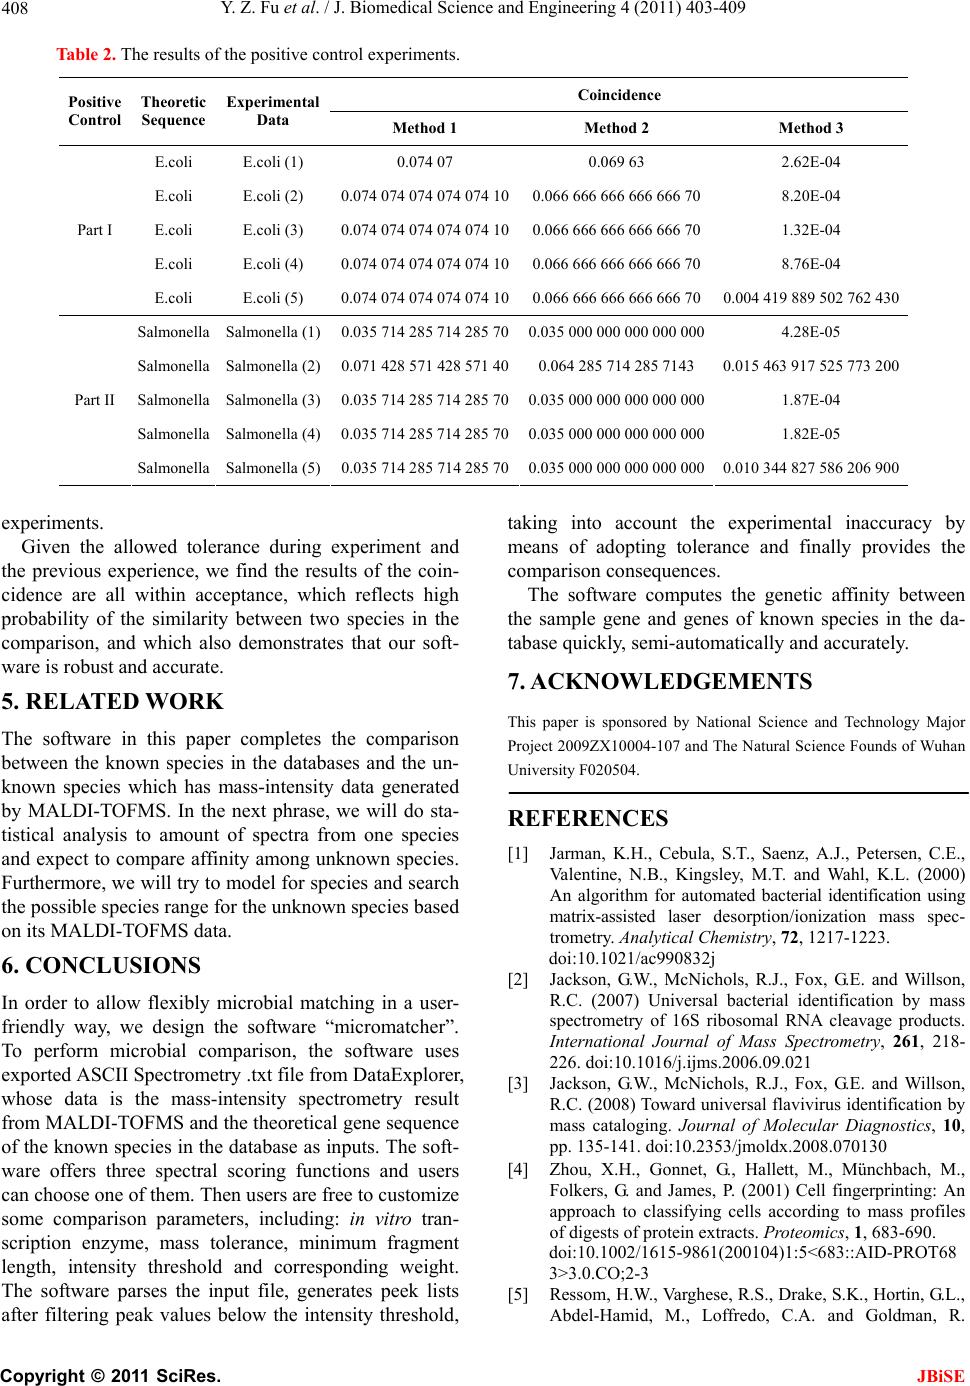
Table 2. The results of the positive control experiments.
Coincidence
Positive
Control Theoretic
Sequence Experimental
Data Method 1 Method 2 Method 3
E.coli E.coli (1) 0.074 07 0.069 63 2.62E-04
E.coli E.coli (2) 0.074 074 074 074 074 100.066 666 666 666 666 708.20E-04
E.coli E.coli (3) 0.074 074 074 074 074 100.066 666 666 666 666 701.32E-04
E.coli E.coli (4) 0.074 074 074 074 074 100.066 666 666 666 666 708.76E-04
Part I
E.coli E.coli (5) 0.074 074 074 074 074 100.066 666 666 666 666 700.004 419 889 502 762 430
Salmonella Salmonella (1) 0.035 714 285 714 285 700.035 000 000 000 000 0004.28E-05
Salmonella Salmonella (2) 0.071 428 571 428 571 400.064 285 714 285 7143 0.015 463 917 525 773 200
Salmonella Salmonella (3) 0.035 714 285 714 285 700.035 000 000 000 000 0001.87E-04
Salmonella Salmonella (4) 0.035 714 285 714 285 700.035 000 000 000 000 0001.82E-05
Part II
Salmonella Salmonella (5) 0.035 714 285 714 285 700.035 000 000 000 000 0000.010 344 827 586 206 900
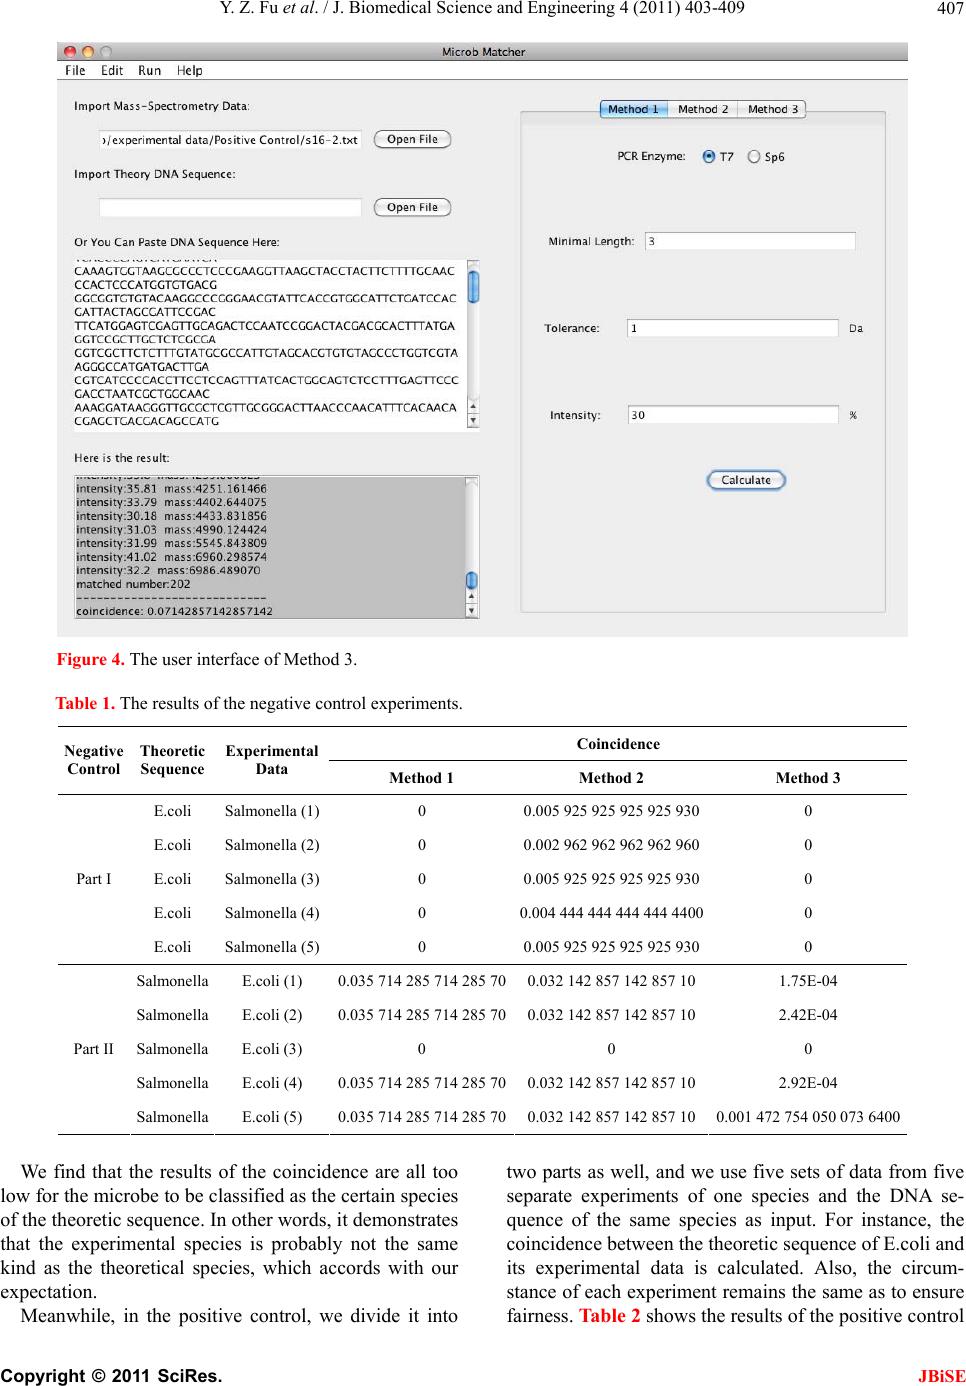
experiments.
Given the allowed tolerance during experiment and
the previous experience, we find the results of the coin-
cidence are all within acceptance, which reflects high
probability of the similarity between two species in the
comparison, and which also demonstrates that our soft-
ware is robust and accurate.
5. RELATED WORK
The software in this paper completes the comparison
between the known species in the databases and the un-
known species which has mass-intensity data generated
by MALDI-TOFMS. In the next phrase, we will do sta-
tistical analysis to amount of spectra from one species
and expect to compare affinity among unknown species.
Furthermore, we will try to model for species and search
the possible species range for the unknown species based
on its MALDI-TOFMS data.
6. CONCLUSIONS
In order to allow flexibly microbial matching in a user-
friendly way, we design the software “micromatcher”.
To perform microbial comparison, the software uses
exported ASCII Spectrometry .txt file from DataExplorer,
whose data is the mass-intensity spectrometry result
from MALDI-TOFMS and the theoretical gene sequence
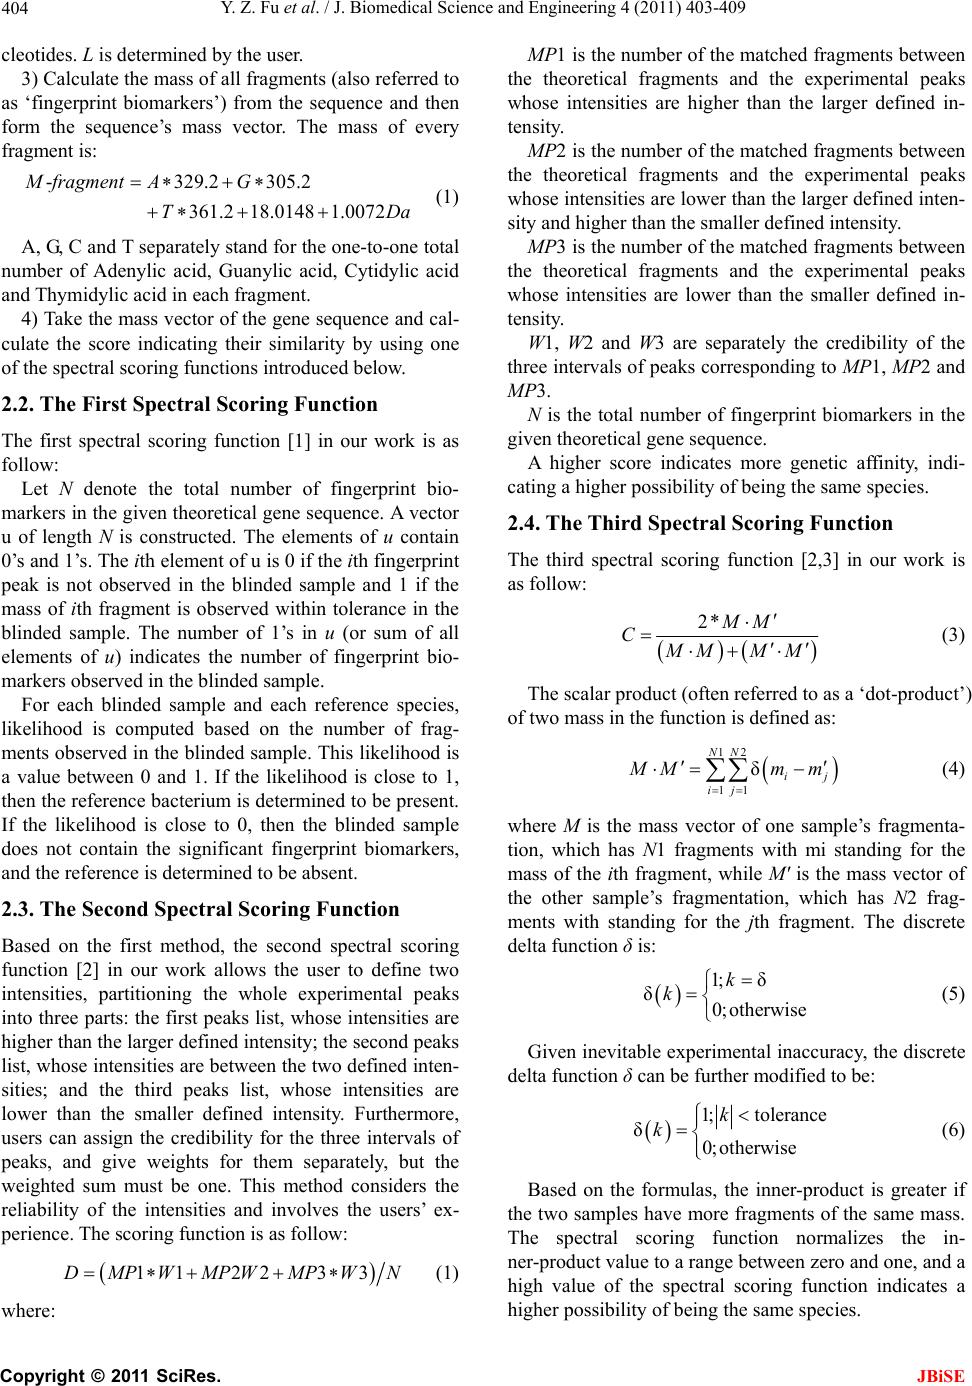
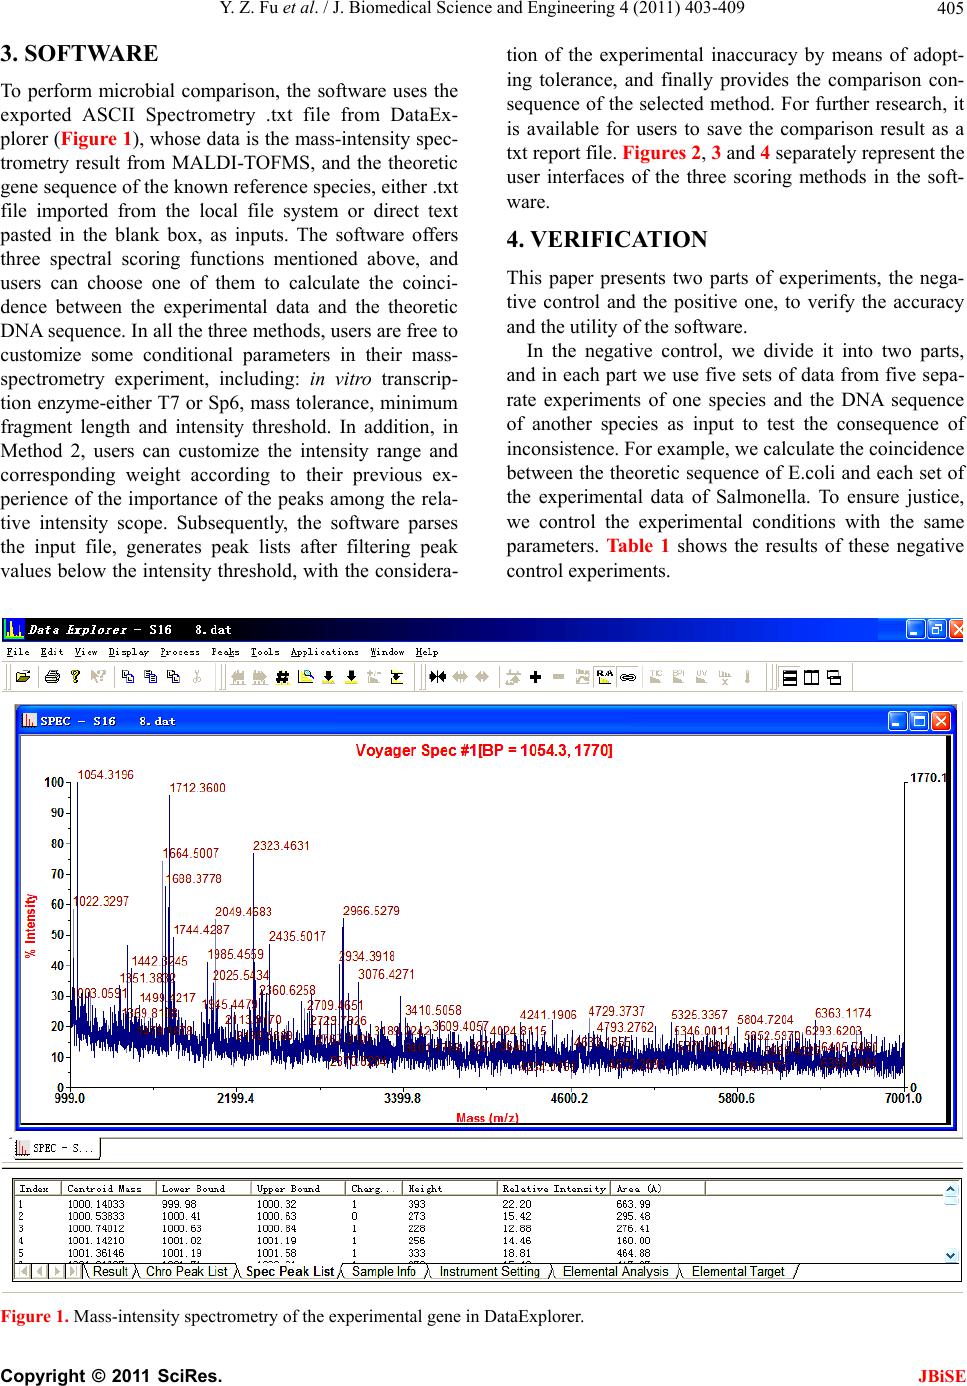
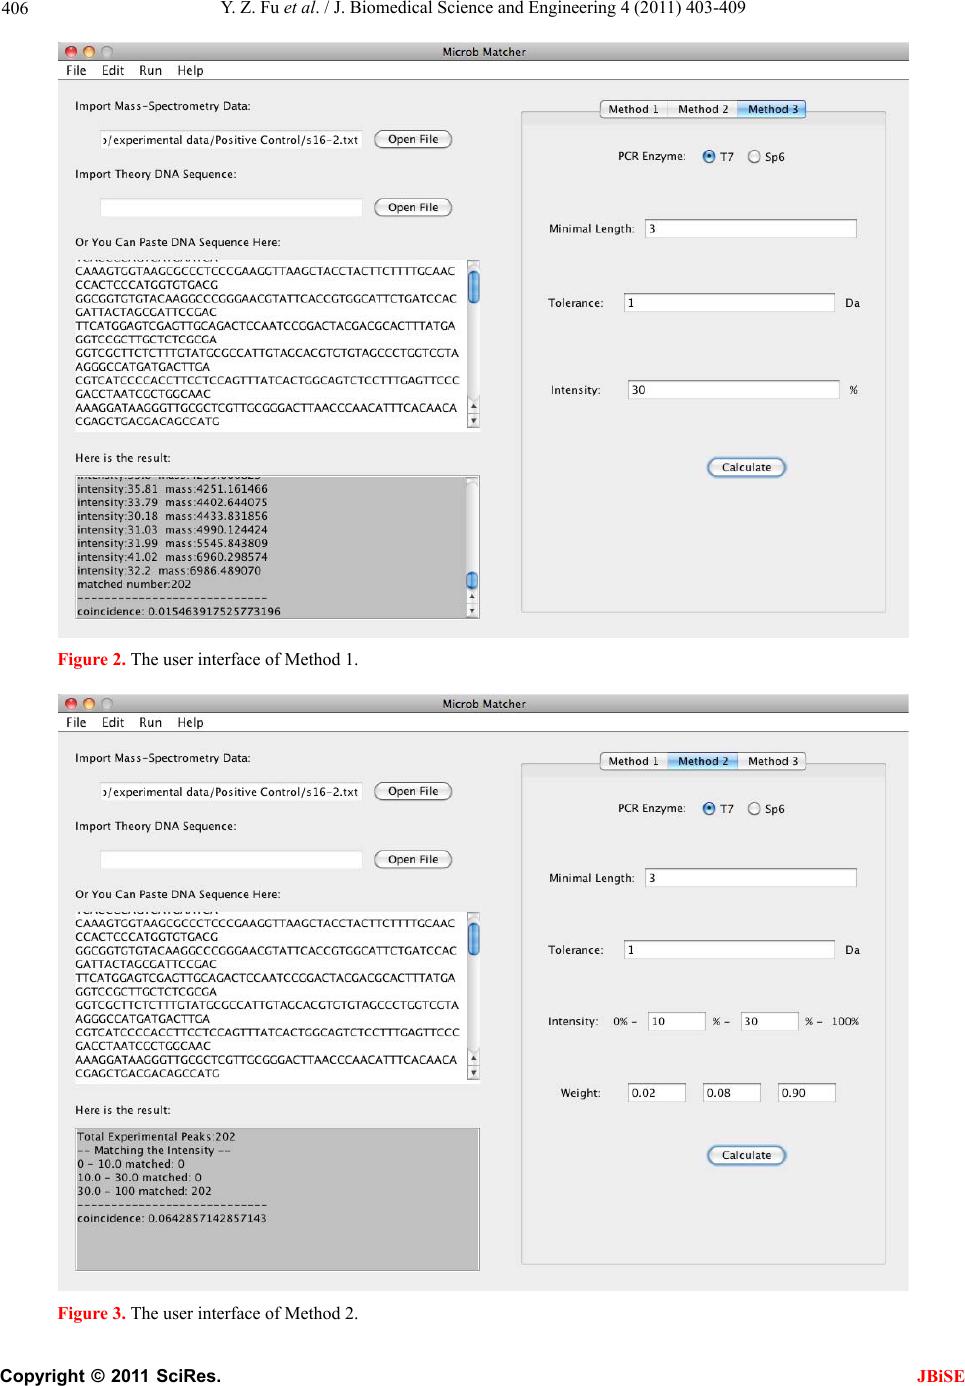
of the known species in the database as inputs. The soft-
ware offers three spectral scoring functions and users
can choose one of them. Then users are free to customize
some comparison parameters, including: in vitro tran-
scription enzyme, mass tolerance, minimum fragment
length, intensity threshold and corresponding weight.
The software parses the input file, generates peek lists
after filtering peak values below the intensity threshold,
taking into account the experimental inaccuracy by
means of adopting tolerance and finally provides the
comparison consequences.
The software computes the genetic affinity between
the sample gene and genes of known species in the da-
tabase quickly, semi-automatically and accurately.
7. ACKNOWLEDGEMENTS
This paper is sponsored by National Science and Technology Major
Project 2009ZX10004-107 and The Natural Science Founds of Wuhan
University F020504.
REFERENCES
[1] Jarman, K.H., Cebula, S.T., Saenz, A.J., Petersen, C.E.,
Valentine, N.B., Kingsley, M.T. and Wahl, K.L. (2000)
An algorithm for automated bacterial identification using
matrix-assisted laser desorption/ionization mass spec-
trometry. Analytical Chemistry, 72, 1217-1223.
doi:10.1021/ac990832j
[2] Jackson, G.W., McNichols, R.J., Fox, G.E. and Willson,
R.C. (2007) Universal bacterial identification by mass
spectrometry of 16S ribosomal RNA cleavage products.
International Journal of Mass Spectrometry, 261, 218-
226. doi:10.1016/j.ijms.2006.09.021
[3] Jackson, G
.W., McNichols, R.J., Fox, G.E. and Willson,
R.C. (2008) Toward universal flavivirus identification by
mass cataloging. Journal of Molecular Diagnostics, 10,
pp. 135-141. doi:10.2353/jmoldx.2008.070130
[4] Zhou, X.H., Gonnet, G., Hallett, M., Münchbach, M.,
Folkers, G. and James, P. (2001) Cell fingerprinting: An
approach to classifying cells according to mass profiles
of digests of protein extracts. Proteomics, 1, 683-690.
doi:10.1002/1615-9861(200104)1:5<683::AID-PROT68
3>3.0.CO;2-3
[5] Ressom, H.W., Varghese, R.S., Drake, S.K., Hortin, G.L.,
Abdel-Hamid, M., Loffredo, C.A. and Goldman, R.
C
opyright © 2011 SciRes. JBiSE
Y. Z. Fu et al. / J. Biomedical Science and Engineering 4 (2011) 403-409 409
(2007) Peak selection from MALDI-TOF mass spectra
using ant colony optimization. Bioinformatics, 23,
619-626. doi:10.1093/bioinformatics/btl678
[6] Jackson, G
.W., McNichols, R.J., Fox, G.E. and Willson,
R.C. (2007) Bacterial genotyping by 16S rRNA mass
cataloging. BMC Bioinformatics, 7, 321.
doi:10.1186/1471-2105-7-321
[7] Zhang, Z.D., Jackson, G.W., Fox, G.E. and Willson, R.C.
(2006) Microbial identification by mass cataloging. BMC
Bioinformatics, 7, 117. doi:10.1186/1471-2105-7-117
[8] Jones, N.C. and Pevzner, P.A. (2004) An introduction to
bioinformatics algorithms, Chapter 6. MIT Press, Cam-
bridge.
C
opyright © 2011 SciRes. JBiSE