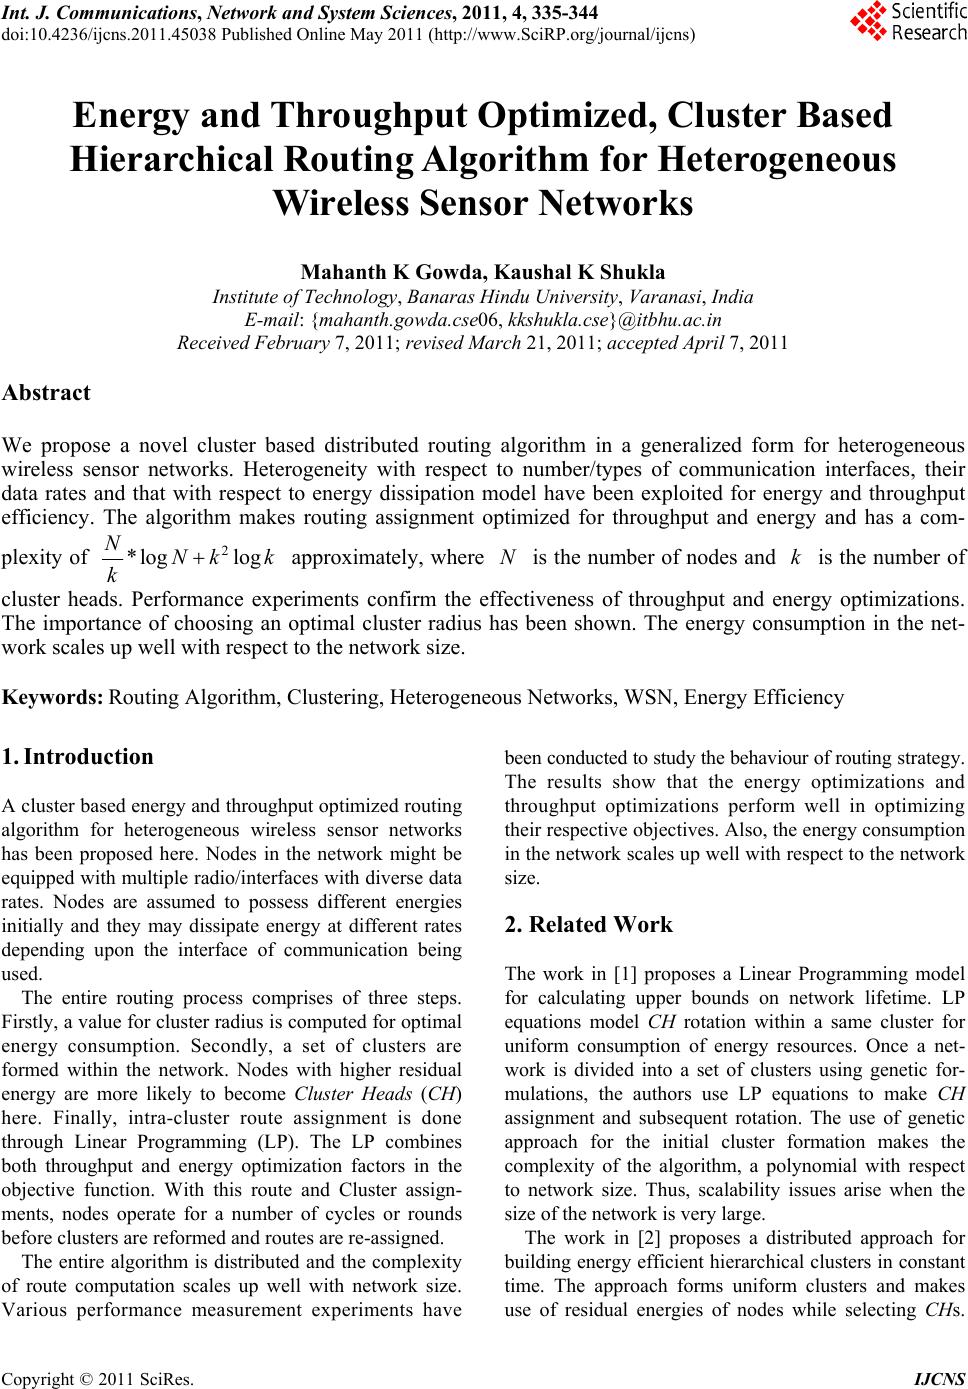
 Int. J. Communications, Network and System Sciences, 2011, 4, 335-344 doi:10.4236/ijcns.2011.45038 Published Online May 2011 (http://www.SciRP.org/journal/ijcns) Copyright © 2011 SciRes. IJCNS Energy and Throughput Optimized, Cluster Based Hierarchical Routing Algorithm for Heterogeneous Wireless Sensor Networks Mahanth K Gowda, Kaushal K Shukla Institute of Technology, Banaras Hindu University, Va ranasi, India E-mail: {mahanth.gowda.cse06, kkshukla.cse}@itbhu.ac.in Received February 7, 2011; revised March 21, 2011; accepted April 7, 2011 Abstract We propose a novel cluster based distributed routing algorithm in a generalized form for heterogeneous wireless sensor networks. Heterogeneity with respect to number/types of communication interfaces, their data rates and that with respect to energy dissipation model have been exploited for energy and throughput efficiency. The algorithm makes routing assignment optimized for throughput and energy and has a com- plexity of 2 *loglog N k kk approximately, where is the number of nodes and is the number of k cluster heads. Performance experiments confirm the effectiveness of throughput and energy optimizations. The importance of choosing an optimal cluster radius has been shown. The energy consumption in the net- work scales up well with respect to the network size. Keywords: Routing Algorithm, Clustering, Heterogeneous Networks, WSN, Energy Efficiency 1. Introduction A cluster based energy and throughput optimized routing algorithm for heterogeneous wireless sensor networks has been proposed here. Nodes in the network might be equipped with multiple radio/interfaces with diverse data rates. Nodes are assumed to possess different energies initially and they may dissipate energy at different rates depending upon the interface of communication being used. The entire routing process comprises of three steps. Firstly, a value for cluster radius is computed for optimal energy consumption. Secondly, a set of clusters are formed within the network. Nodes with higher residual energy are more likely to become Cluster Heads (CH) here. Finally, intra-cluster route assignment is done through Linear Programming (LP). The LP combines both throughput and energy optimization factors in the objective function. With this route and Cluster assign- ments, nodes operate for a number of cycles or rounds before clusters are reformed and routes are re-assigned. The entire algorithm is distributed and the complexity of route computation scales up well with network size. Various performance measurement experiments have been conducted to study the behaviour of routing strategy. The results show that the energy optimizations and throughput optimizations perform well in optimizing their respective objectives. Also, the energy consumption in the network scales up well with respect to the network size. 2. Related Work The work in [1] proposes a Linear Programming model for calculating upper bounds on network lifetime. LP equations model CH rotation within a same cluster for uniform consumption of energy resources. Once a net- work is divided into a set of clusters using genetic for- mulations, the authors use LP equations to make CH assignment and subsequent rotation. The use of genetic approach for the initial cluster formation makes the complexity of the algorithm, a polynomial with respect to network size. Thus, scalability issues arise when the size of the network is very large. The work in [2] proposes a distributed approach for building energy efficient hierarchical clusters in constant time. The approach forms uniform clusters and makes use of residual energies of nodes while selecting CHs.  M. K GOWDA ET AL. 336 Nevertheless, there is a fair chance for nodes with lower energies to get grouped within a same cluster. This happens when nodes exhibit high degree of heterogeneity with respect to energies and having a high spatial density. The work related with uniform cluster formation in [3] focuses on forming closely packed clusters with packing efficiency close to hexagonal close packing. Such cluster formations are effective in homogeneous networks with nodes having similar energy values, similar energy consumption functions and similar data loads. On a hete- rogeneous network, some non-uniform clusters biased towards energy rich nodes should have scope for for- mation. The work on hierarchical cluster based routing in [4] proposes a distributed algorithm which first distributes the network into random clusters. Then, a set of high energy nodes within clusters are selected which serve as CHs. They also formulate a genetic algorithm for the initial cluster formation. The application of genetic approach makes the algorithm cost intensive for large networks. The approach in [5] is for homogeneous networks. They formulate a set of Linear Programming equations to minimize the maximum cluster size in the network, since this is equivalent to minimizing energy consum- ption in a homogeneous network. The work in [6], proposes a strategy to organize raw sensor nodes into clusters for energy efficient commu- nication among nodes in the organized cluster. They calculate two parameters p (probability for a node becoming CH and set up CH election) and k (cluster hop radius). A set of mathematical equations are set up with these two as variables and these equations have been optimized to minimize total energy and thereby deriving optimal values for p and k. Based on these values they formulate a single level and multi-level cluster based routing algorithms. We use the results of this work to derive the optimal cluster radius which is required for formation of clusters. The work in [7], formulates a set of Integer Program- ming equations for cluster assignment for optimal network lifetime. They then propose a heuristic algorithm for routing. However, the formulation doesn’t consider nodes with multiple/radio interfaces. Also, the ILP (integer linear programming) and the heuristics use variables whose order is a polynomial with respect to the size of the network. Dearth of published work in handling node hetero- geneity in a generalized manner together with the idea of tuning the degree of conflicting optimization objectives of energy and throughput, have been the major sources of motivation to carry out the work. 3. Problem Description and Model The nodes in the network are deployed randomly over a field in an adhoc mode. There is a base-station which offloads the sensory information collected by nodes to a wired network. The nodes sense information periodically and communicate amongst themselves to pass their data to the base-station. Given the data load that nodes must sense periodically, the problem is to route the data so that the life-time of the network and throughput are optimized to a degree specified by the design parameter (managed by the network administrator). Nodes have multiple interfaces for communication with differing data rates, energy dis- sipation models. 4. The Routing Approach The routing strategy involves three steps. Firstly, an optimal cluster radius based on analysis and approxi- mations in [6] is chosen. Then, the entire network is divided into a set of clusters with nodes having higher residual energy having higher probability of becoming CHs. Then, a set of Linear Programming equations are solved within each cluster to assign routes for each node within a cluster towards the CH . These equations con- sider multiple radio/interfaces, their data rates, residual energy values of nodes, throughput of delivery etc into consideration while making route computations. These steps are explained in detail in the subsections to follow. 4.1. Optimal Cluster Radius Selection Selection of an optimal cluster radius for minimum energy consumption is of prime importance. This has been done on the basis of work in [6]. The approach and how it has been adopted to our work has been briefed here. Assume that nodes are distributed randomly with a density of in a spatial 2-dimensional square area. Now let be a random variable representing the number of sensors in a square area of side with mean N 2a (A = 4). Given nodes, if is the probability that a node is a CH, then there will be CHs in the area. Let i denote the length of the segment from node i (co-ordinates i 2 anpnp D ,i) to the base-station which has been assumed to be at the centre of the square area without loss of generality. The expected value of is given by y i D 22 2 1 ==d= 0.765 4 iii A EDN nxyAa a The other terms - , , , , ENnv N0 , 1 , , 1 C Copyright © 2011 SciRes. IJCNS  M. K GOWDA ET AL. Copyright © 2011 SciRes. IJCNS 337 2 C, , - are treated as defined in [6]. 3 Now, let the plane be divided into cells with each CH belonging to one (center) cell. Figure 1 shows such an example. Let us assume that each non-CH joins the nearest cluster. Now the plane can be visualized as a set of exclusive zones of clusters. For this model, although there are minor changes in Equations (4), (6), (7) and (8) of [6], the final result of [6] still holds as shown below. C 1C Caggregated information to the processing center is denoted by , then, 3C 2 0.765 3= =*=0.765 npa E CNnrnpar r Note the modifications that have been done with computations of and in order to accommodate the square distance energy consumption. 3C1C Define C to be the total energy spent in the system. Then, We use the square distance power consumption, i.e. the energy of transmission is proportional to the square of the distance transmitted. Now, if is the average hop distance and is the average energy consumption for transmitting equal data by all nodes in a cluster cell, then is given by r 1C 1.5 == 2=3= 1 =0.765 2 ECN nECN nECN n npr pnpar p 2 = 1= =*== v v ELN n Nnr rELNn r E CRemoving the conditioning on N yields, 1 === 0.765 2 1 =0.765 2 pr ECEECNnENpar p pr Apar p The first term in the product involved in the above equation = v ELN n r is the expected number of hops and the second term is multiplied because the energy value is a square function of transmission dis- tance. 2 r EC is minimized by a value of that is a solu- tion of p Since there are such cluster cells, the total energy spent , by all non - CHs in the square area is given by np 2C3 21=0cp p 2= =1=ECNnnpECNn where =3.06ca . This is same as Equation (9) in [6]. Accordingly, the real solution for given by p If the total energy spent by CHs to communicate the 2 1 13 22 3 11 33 22 22733274 12 =33 2 322733274 optimal ccc pcc cccc 1 Here, we have clusters and let us assume that these clusters take shapes of squares of equal area as shown in Figure 1. Now, the optimal cluster radius cluster is approximated as half diagonal distance of such a square. *optimal np R 2 =2 clus t er optimal a Rnp 4.2. Cluster Formation Methodology Once, an optimal cluster radius has been chosen, the network is divided into a set of exclusive clusters. The following steps outline the algorithm for cluster for- mation. Sorting. All nodes in the network are arranged in decreasing order of residual energy. Initially all nodes in the network are unclustered. Cluster formation. The node with highest residual energy among unclustered nodes is chosen as a CH. All nodes around it falling within the chosen cluster radius (which are neither CHs nor members of other clusters) become members of this cluster. Termination. The previous step is continued until each and every node in the network is either a CH or a member of a cluster. Although the above algorithm runs in a polynomial order of the size of the network, it can be parallelized. The above algorithm has been presented for the purpose of better comprehension of the cluster assignment strategy. The distributed version of the above algorithm is given below. Sorting. Here, the nodes are sorted in decreasing order of residual energy in a distributed manner.  M. K GOWDA ET AL. 338 Figure 1. Sets of clusters with CHs at respective centres. Initially a set of nodes are selected randomly (which are distributed uniformly across the network) which participate in sorting. Once the first round is complete, the CHs of current round participate in sorting for cluster election for the next round. =optimal knp k The nodes can perform distributed sorting by using quick sort algorithm presented in Subsection 9.4 of [8]. k Cluster Head Selection. After sorting, let CHs labelled as hold attributes for 12 ,,, k CH CHCH first, second set of th kn k nodes. If re- ,in E presents the residual energy of node in , then ,,. Also, ,, th n ix i CH i> < ia ib EEabj> < jy EE . Based upon the chosen cluster radius range, a set of CHs which do not fall within a distance of range from each other are now selected from the sorted list. R R The following is the algorithm at CHi which has a list of i ln k sorted nodes and is the dis- ,mn d tance between and nodes in . th m ls th ni l for to do =1m.1 iize 1.for to ls do =nm d i if then ize ,mn cluster R .lremoven i end if end for end for if then .>2 i lsizek l modify i such that only the first 2 elements of the list are kept, rest are discarded k end if This is followed by the below algorithm. ji start: 0it if then %2=1j if >log 1it k then goTo end end if 2it ti receive From ,t tl /*receive the list of node t*/ append , it ll for to do =1m.1 i lsize 1for =nm to ls do . i if ize ,mn cluster Rd then .lremoven i end if end for end for if then .>2 i lsize k l modify i such that only the first 2k elements of the list are kept, rest are discarded end if 1it it 1 2 j j else send To (i − 2it,li)/*send list to node i − 2it*/ goto end end if goTo start end: if then =1i send information to the nodes in to start CH advertisements within . 1 l cluster R end if The algorithm is analogous to parallel maxi- mum-element determination among a series of numbers. At each step, each number is compared with its neighbour in the series. The winners (greater number in the comparison) go to the next round and the algorithm is terminated at the maximum element.In our algorithm, node-lists of CHs (i and CH CH , where ) are com- pared and those nodes in <ij l are discarded which come in the range of nodes of i. This is because nodes in have higher residual energies than those in l i l l. During this merging, i proceeds with the next round taking a maximum of nodes in its list. The algorithm terminates with 1 holding the potential candidates which form Cluster Heads for the next round. CH 2k CH Copyright © 2011 SciRes. IJCNS  M. K GOWDA ET AL.339 Cluster Spawning. These CHs now spawn their clusters by selecting the nodes that fall within a distance of range R from them. If a node falls within range R of two or more of the above CHs, then it will join the cluster of the CH with the largest residual energy among them. The following is the algorithm used by i node . 0hi Energy myCH i ghestResidual if received a message from for sending advertisements then 1 CH broadcast CH advertisement within cluster R highes tResidualEnergy myResidualEnergy end if while do time CHelectionTime Receive an advertisement adv from node if .>adv residualEnergy highestResidualEnergy then highestResidualEnergy .adv residualEnergy myCH j end if end while Each of the non-CHs acknowledge their res- pective CHs CHelectionTime is a suitable predefined time for which the spawning takes place. Figure 2 shows the initial network with nodes un- clustered. Unclustered nodes are shown in green. Figure 3 shows how clusters are built based upon residual energy values. A node among the unclustered nodes with highest residual energy spawns a new cluster. This con- tinues until every node in the network is clustered. CHs are marked red while non CHs are shown yellow. 4.3. Intra Cluster Route Assignment through Linear Programming The LP formulations presented here are for a single cluster. These equations are solved for each and every cluster separately. The variables and parameters used in the LP for- mulation are tabulated in Table 1 for quick reference. The column T indicates the type of the term - whether it is a variable or a parameter. Optimizatio n fu nction: minimize =1 *1* N i i E linkSum where, 01 . Constraints: Equations representing constraints mostly dictate data Figure 2. Initial unclustered network. Figure 3. Cluster formation based on residual energy. balancing among nodes involved in routing. These equa- tions take diverse aspects into account like multiple radio/ interfaces, energy, link data rate, throughput etc. = ii totaldb recvdi (1) Total data received at a node should be equal to the sum of data forwarded by all other nodes to the node Copyright © 2011 SciRes. IJCNS 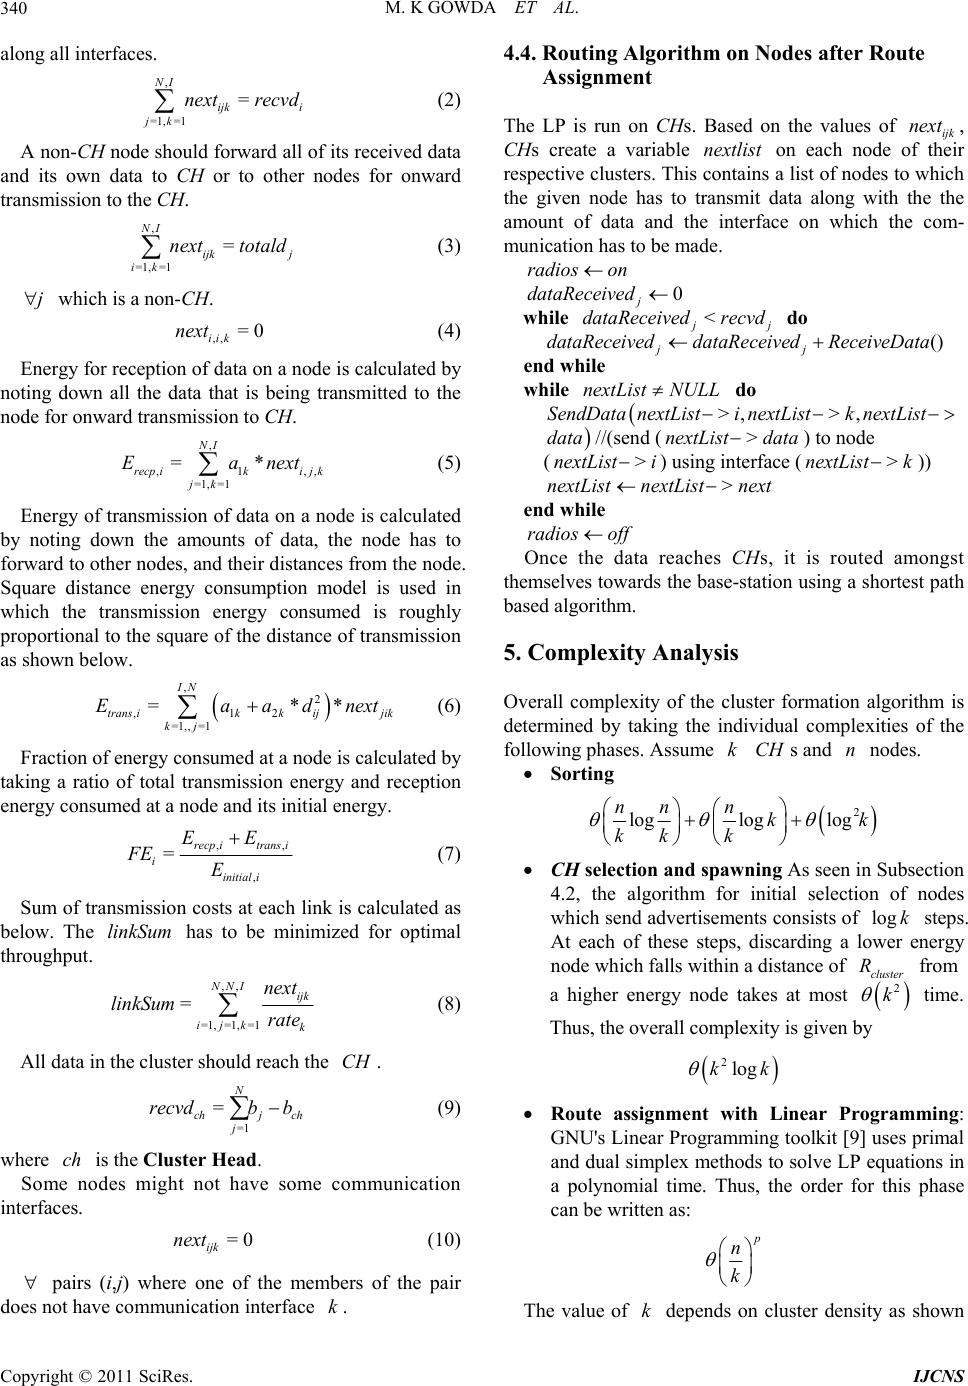 M. K GOWDA ET AL. 340 ,, along all interfaces. , =1, =1 = NI ijk i jk next recvd (2) A non-CH node should forward all of its received data and its own data to CH or to other nodes for onward transmission to the CH. , =1, =1 = NI ijk j ik next totald (3) j which is a non-CH. ,, =0 iik next (4) Energy for reception of data on a node is calculated by noting down all the data that is being transmitted to the node for onward transmission to CH. , ,1 =1, =1 =* NI recp ikijk jk Ea next (5) Energy of transmission of data on a node is calculated by noting down the amounts of data, the node has to forward to other nodes, and their distances from the node. Square distance energy consumption model is used in which the transmission energy consumed is roughly proportional to the square of the distance of transmission as shown below. , 2 ,12 =1,, =1 =** IN trans ikkijjik kj Eaadnext (6) Fraction of energy consumed at a node is calculated by taking a ratio of total transmission energy and reception energy consumed at a node and its initial energy. , , =recpitrans i iinitial i EE FE E , (7) Sum of transmission costs at each link is calculated as below. The has to be minimized for optimal throughput. linkSum ,, =1, =1, =1 = NNI ijk ijk k next linkSum rate (8) All data in the cluster should reach the . CH =1 = N chj ch j recvdb b (9) where is the Cluster Head. ch Some nodes might not have some communication interfaces. =0 ijk next (10) pairs (i,j) where one of the members of the pair does not have communication interface . k 4.4. Routing Algorithm on Nodes after Route Assignment The LP is run on CHs. Based on the values of ijk, CHs create a variable on each node of their respective clusters. This contains a list of nodes to which the given node has to transmit data along with the the amount of data and the interface on which the com- munication has to be made. next nextlist radios on 0 j dataRecei ved while < j recvd aReceived dataReceive dataReceived do () jj datd ReceiveData end while while nextListNULL do >,> ,SendDatanextListi nextListknextList data >nextList data >nextList i //(send () to node ( ) using interface (>nextList k )) >nextList nextListnext end while radios off Once the data reaches CHs, it is routed amongst themselves towards the base-station using a shortest path based algorithm. 5. Complexity Analysis Overall complexity of the cluster formation algorithm is determined by taking the individual complexities of the following phases. Assume s and nodes. kCH n Sorting 2 loglog log nn nkk kkk CH selection and spawning As seen in Subsection 4.2, the algorithm for initial selection of nodes which send advertisements consists of log k steps. At each of these steps, discarding a lower energy node which falls within a distance of cluster R from a higher energy node takes at most k 2 time. Thus, the overall complexity is given by 2logkk Route assignment with Linear Programming: GNU's Linear Programming toolkit [9] uses primal and dual simplex methods to solve LP equations in a polynomial time. Thus, the order for this phase can be written as: n k The value of depends on cluster density as shown k Copyright © 2011 SciRes. IJCNS  M. K GOWDA ET AL.341 earlier in Subsection 4.1. In any case, the distributed approach brings down the complexity of the algorithm. 6. Advantages of the Approach Some of the advantages of our approach are listed below: Since nodes have a precomputed routing assign- ment via LP solution, most of the non-CHs can turn their radios on/off appropriately to conserve energy. Non-CHs are exempted from the overhead of maintaining routing state. Thus, they can run with constrained memory. Reconfiguration and re-formation of clusters perio- dically ensures uniform consumption of energy re- sources across CHs. LP based solution ensures uni- form energy consumption within clusters. Generalized approach taking care of multiple node heterogeneity like multiple radio/interfaces, energy values, data transmission rates etc in the formu- lation. A tunable design parameter is provided to the end user to specify the degree of performance of the algorithm with respect to conflicting optimiza- tion requirements - throughput vs energy. 7. Results It has to be noted that our research work with distributed clustering algorithm is very much different from other published work. It is a novel approach treating hete- rogeneity with respect to multiple node interfaces, data transfer rates, initial energy values and power consump- tion models. The tunable design parameter can be used to vary the degree of performance of the algorithm with respect to throughput optimizations and energy optimizations. Thus, the performance evaluation done in this section evaluate the algorithm with respect to its own parameter settings. The results show that the energy optimizations and throughput optimizations perform well in optimizing their respective objectives. Also, the energy consumption in the network scales up well with respect to the network size. Implementation of the algorithms discussed in the docu- ment have been done on ns3 wireless networks. [10]. 7.1. Some Definitions Network Lifetime: The network is assumed to be dead when atleast 1% of nodes in the network have depleted their energy completely. Accordingly, the Network Lifetime has been defined as the diffe- rence between the point of time at which 1% nodes deplete their energy and the point of time at which the network starts its operation. Datapercycle: Nodes in the network operate in cycles. During each cycle, a node has to transmit some information to its CH . The amount of data per cycle which a node is supposed to sense and transmit is termed as Datapercycle. Cycle Time: The total time taken by all nodes in the network to finish with the transmission of their Datapercycle to their CHs. The network operates in rounds or cycles. During each cycle , every node has to transmit its to its for the onward transmission to the Base Sta- tion. The energy spent during such transmissions has been accounted for analysis in various experiments. After each cycle, clusters are reformed and routes are reassigned. Datapercycle CH 7.2. Network Characteristics Network characteristics have been summarized in Table 2. Nodes for simulation were generated randomly on a square area and were assigned initial energies randomly in the specified range. Several plots (exp 1, exp 2, exp 3) have been made for the same experiment by initializing the seed value of the random node generator with different values. 7.3. Route Assignment Consider the following cluster of nodes – 318, 280, 298, 299, 319, 320, 321, 335, 336, 337, 349 with node 318 as the CH. Other parameters defined for these nodes are shown in Table 3. In the table, id, i , i stand for identities of nodes, their x-coordinates and y-coordinates respectively. Also, holds the number of interfaces a node can have while and have been defined in Table 1. y ,i intf i binitial E Solving LP for the above cluster yields values for ijk and i which have been tabulated in Tables 4 and 5. Values for other possible ijk ’s and i’s which are not listed in these tables were found to be 0. next recvd next recvd Since the value of the tunable design parameter that was used in this experiment was 0.0001, almost all of the nodes use the interface for communication which was available on all of them. q Now, if the algorithm in Subsection 4.4 is applied to node 336, it receives 34 units of data (25 and 9 respectively from nodes 320 from 337 along interface ). Once the data is received, the node transmits 44 (34 received plus 10 of its own) units of data to node 319 on q Copyright © 2011 SciRes. IJCNS  M. K GOWDA ET AL. 342 Table 1. Terms and definitions. Term Definition T ij d distance between th and th nodes ijp i b Amount of data to be sensed and transmitted to basestation by th node during each round ip i recvd Total data received by node from other nodes during a round for forwarding to i CH v i totald sum of and i recvd i bv ,,ijk next Amount of data to be forwarded by node to node i on interface k during a round v 1,k a A parameter of interface k’s energy function p 2,k a A parameter of interface k’s energy function p ,recp i E Total energy spent for reception by node during a round iv ,trans i E Total Energy spent for transmission by node during a round iv i E Fraction of energy consumed on node during the operation of a round iv ,initial i E Initial energy of node before the start of the round for which optimal assignment is being done. i p k rate rate of data transmission of th interface kp linkSum sum of ratios of data transferred along links by nodes and the data transfer rate of the corresponding link v tunable design parameter which can be set values between 0 and 1 p interface . q 7.4. Plot of Network Lifetime versus A plot of Network Lifetime on y-axis versus (the design parameter introduced in Subsection 4.3) on -axis for two random experiments is shown in Figure 4. The network lifetime has been measured in terms of number of NS3 Simulation seconds. A high value of makes the lifetime optimization part of the optimization function in LP formulation to dominate, and a low value makes the throughput optimization part to dominate. The results of the experiment which depict this behaviour is shown in the graph. 7.5. Plot of Cycle Time versus A plot of Cycle Time on y-axis versus on x-axis for Table 2. Network characteristics. Network Parameter Value Number of nodes ranging from 270 – 1020 over all experiments Number of interfaces per nodeAll have interface1 and 40% have interface2 also datarate 1 interface 1 Mbps datarate 2 interface 2 Mbps datapercycle 1-2 KB 1 a for 1 interface 4 2 a for 1 interface 1 1 a for 2 interface 8 2 a for 2 interface 2 Area of deployment 106 m2 Initial Energy of nodes 300 - 1000 units Table 3. Illustration of routing assignment. id i i y i b intf i E 318 568 690 10 q,r 520 280 693 614 8 q 364 298 510 631 8 q 457 299 560 646 7 q,r 327 319 622 676 8 q 441 320 688 697 7 q 347 321 710 695 10 q,r 202 335 629 731 10 q 426 336 637 708 10 q 75 337 690 723 9 q 308 349 653 767 6 q,r 267 three random experiments is shown in Figure 5. Cycle Times have been measured in terms of number of NS3 Simulation seconds. A low value of makes through- put optimization part to dominate and consequently the cycle time is low for such values. On the other hand, for high values of , the cycle time goes up. The results are depicted in the graph. 7.6. Plot of Energy Consumed versus Node Density A plot of total energy consumed in the network versus Node Density for 1 cycle of operation (at optimal cluster radius as derived in Subsection 4.1 ) is done in Figure 6. Copyright © 2011 SciRes. IJCNS  M. K GOWDA ET AL.343 Table 4. LP solution for nextijk. i j k nextijk 388 299 q 15 318 319 q 68 299 298 q 8 319 335 q 16 319 336 q 44 320 280 q 8 320 321 q 10 335 349 q 6 336 320 q 25 336 337 q 9 Table 5. LP solution for recvdi. i recvdi 318 83 299 8 319 60 320 18 335 6 336 34 Plots for three random experiments have been shown. Energy values calculated as per Equations (5) and (6) have been scaled down by a constant value of 300 000. Node density has been shown in terms of number of nodes per 106 m 2 square area. The plot shows that the total energy consumed in the network scales up well with respect to the network size. 7.7. Plot of Energy Consumed vs Cluster Radius for Different Node Densities Figure 7 shows the plot of energy consumed vs cluster radius for different node densities. Node densities have been shown as number of nodes per 106 m 2 for each of the different curves. Curves have expected shapes with minimas. However there is a discrepancy between theo- retical optimal cluster radius and actual optimal cluster radius which can be explained on the basis of the following reasons. The theoretical analysis and derivation assumes uniform clusters, whereas actual clusters formed are non uniform with variable number of nodes. Figure 4. Plot of lifetime vs . Figure 5. Plot of cycletime vs . Figure 6. Plot of energy vs node density. The theoretical analysis assumes square clusters, whereas the actual clusters which are formed can have any shape. Results of experiments show that 1.5 times the theo- retical cluster radius should be a good approximation for the actual optimal cluster radius for our network. Copyright © 2011 SciRes. IJCNS  M. K GOWDA ET AL. Copyright © 2011 SciRes. IJCNS 344 Figure 7. Plot of energy consumed vs cluster radius for dif- ferent node densities. 8. Conclusions and Future Works In this work, we have discussed the design, implemen- tation and results of a hierarchical throughput and energy optimized, cluster based routing algorithm for hetero- geneous wireless sensor networks. Firstly, the algorithm selects an optimal value for cluster radius, based on random variable analysis and approximations. Then, cluster assignment based on residual energies of nodes are made in a distributed manner using the cluster radius computed. Finally, Linear Programming equations are used for optimal intra-cluster routing assignment. The formulation considers multiple radios, interfaces, energy values, throughput of delivery etc of nodes into account. Also, there is a tunable design parameter which can be varied depending upon the requirements of perfor- mance optimizations - throughput vs energy. Various performance measurement experiments have been conducted and the results have been reported. These results show that the energy optimizations and through- put optimizations perform well in optimizing their res- pective objectives. The significance of choosing an opti- mal cluster radius has been shown. Also, the energy con- sumption in the network scales up well with respect to the network size. In the near future, we would like work on the follow- ing aspects: Design of a message prioritization scheme such that throughput optimized paths are reserved for prior most messages while, ordinary ones can take energy optimized paths. Extension of the algorithm to support a generalized multi-level cluster hierarchy. Invention of suitable techniques for handling security and privacy. 9. References [1] M. Qin and R. Zimmermann, “Studying Upper Bounds on Sensor Network Lifetime by Genetic Clustering,” Distributed Computing in Sensor Systems, Vol. 3560, 2005, p. 465. doi:10.1007/11502593_40 [2] P. Ding, J. Holliday and A. Celik, “Distributed En- ergy-Effcient Hierarchical Clustering for Wireless Sensor Networks,” Distributed Computing in Sensor Systems, Vol. 3560, 2005, pp. 466-467. doi:10.1007/11502593_25 [3] H. Chan and A. Perrig, “Ace: An Emergent Algorithm for Highly Uniform Cluster Formation,” Wireless Sensor Networks, Vol. 2920, 2004, pp. 154-171. doi:10.1007/978-3-540-24606-0_11 [4] S. Hussain and A. W. Matin, “Hierarchical Cluster-Based Routing in Wireless Sensor Networks,” The 5th Interna- tional Conference on Information Processing in Sensor Networks, Nashville, 19-21 April 2006. [5] W. Z. Wang, W.-Z. Song, X.-Y. Li and M.-N. Kosha, “Distributed Computing in Sensor Systems: Third IEEE International Conference,” Springer, Berlin, 2007. [6] S. Bandyopadhyay and E. J. Coyle, “An Energy Effcient Hierarchical Clustering Algorithm for Wireless Sensor Networks,” INFOCOM 2003 The 22nd Annual Joint Conference of the IEEE Computer and Communications Societies, San Francisco, 30 March - 3 April 2003, pp. 1713-1723. [7] A. Bari, A. Jaekel and S. Bandyopadhyay, “Clustering Strategies for Improving the Lifetime of Two-Tiered Sensor Networks,” Computer Communications, Vol. 31, No. 14, 2008, pp. 3451-3459. doi:10.1016/j.comcom.2008.05.038 [8] A. Grama, A. Gupta, G. Karypis and V. Kumar, “Intro- duction to Parallel Computing,” Addison-Wesley Long- man Publishing Co., Boston, 2003. [9] GNU Linear Programming Kit, 2011. http://www.gnu.org/software/glpk [10] The ns-3 Network Simulator, 2011. www.nsnam.org
|