 Applied Mathematics, 2011, 2, 551-555 doi:10.4236/am.2011.25072 Published Online May 2011 (http://www.SciRP.org/journal/am) Copyright © 2011 SciRes. AM Multi-Item EOQ Model with Both Demand-Dependent Unit Cost and Varying Leading Time via Geometric Programming Kotb A. M. Kotb1, Hala A. Fergany2 1Department of Mathematics and Statistics, Faculty of Science, Taif University, Taif, Saudi Arabia 2Department of Mathematical Statistics, Faculty of Science, Tanta University, Tanta, Egypt E-mail: kamkotp2@yahoo.com Received March 10, 2011; revised March 17, 2011; accepted March 21, 2011 Abstract The objective of this paper is to derive the analytical solution of the EOQ model of multiple items with both demand-dependent unit cost and leading time using geometric programming approach. The varying purchase and leading time crashing costs are considered to be continuous functions of demand rate and leading time, respectively. The researchers deduce th e optimal order quantity, the demand rate and the leading time as de- cision variables then the optimal total cost is obtained. Keywords: Inventory, Geometric Programming, Leading Time, Demand-Dependent, Economic Order Quantity 1. Introduction The problem of the EOQ model with demand-dependent unit cost had been treated by some researchers. Cheng [1] studied an EOQ model with demand-dependent unit cost of single-item. The problem of inventory models involv- ing lead time as a decision variable have been succinctly described by Ben-Daya and Abdul Raouf [2]. Abou- El-Ata and Kotb [3] developed a crisp inventory model under two restrictions. Also, Teng and Yang [4] exam- ined deterministic inventory lot-size models with time-varying demand and cost under generalized holding costs. Other related studies were written by Jung and Klein [5], Das et al. [6] and Mandal et al. [7]. Recently, Kotb and Fergany [8] discussed multi-item EOQ model with varying holding cost: a geometric programming approach. The aim of this paper is to derive the optimal solution of EOQ inventory model and minimize the total cost function based on the values of demand rate, order quan- tity and leading ti me using geometric programmin g tech- nique. In the final a numerical example is solved to illus- trate the model. 2. Notations and Assumptions To construct the model of this problem, we define the following variables: r D = Annual demand rat e (decision variabl e). r C C = Unit pu rchase (pr oduction ) cost. hr = Unit holding (inventory carrying) cost per item per unit time. or C = Ordering cost. SS = r L = Safety stock. n = Number of different items carried in inventory. r L Q = Leading rate time (decision variable). r = Production (order) quantity batch (decision vari- able). TC ,, rrr DQL = Average annual total cost. For the rth item. The following basic assumptions about the model are made: 1) Demand rate is uniform over time. r 2) Time horizon is finite. D 3) No shortages are allowed. 4) Unit production cost , b pr rpr r CD CD 1,2 3,,,1 r, nb b is inversely related to the de- mand rate . W here is called the price elasticity. 5) Lead time crashing cost is related to the lead time by a function of the form ,1,2,3,,, rr RLL rn 0,00 5. . where , are real constants selected to provide the best fit of the estimated cost func- 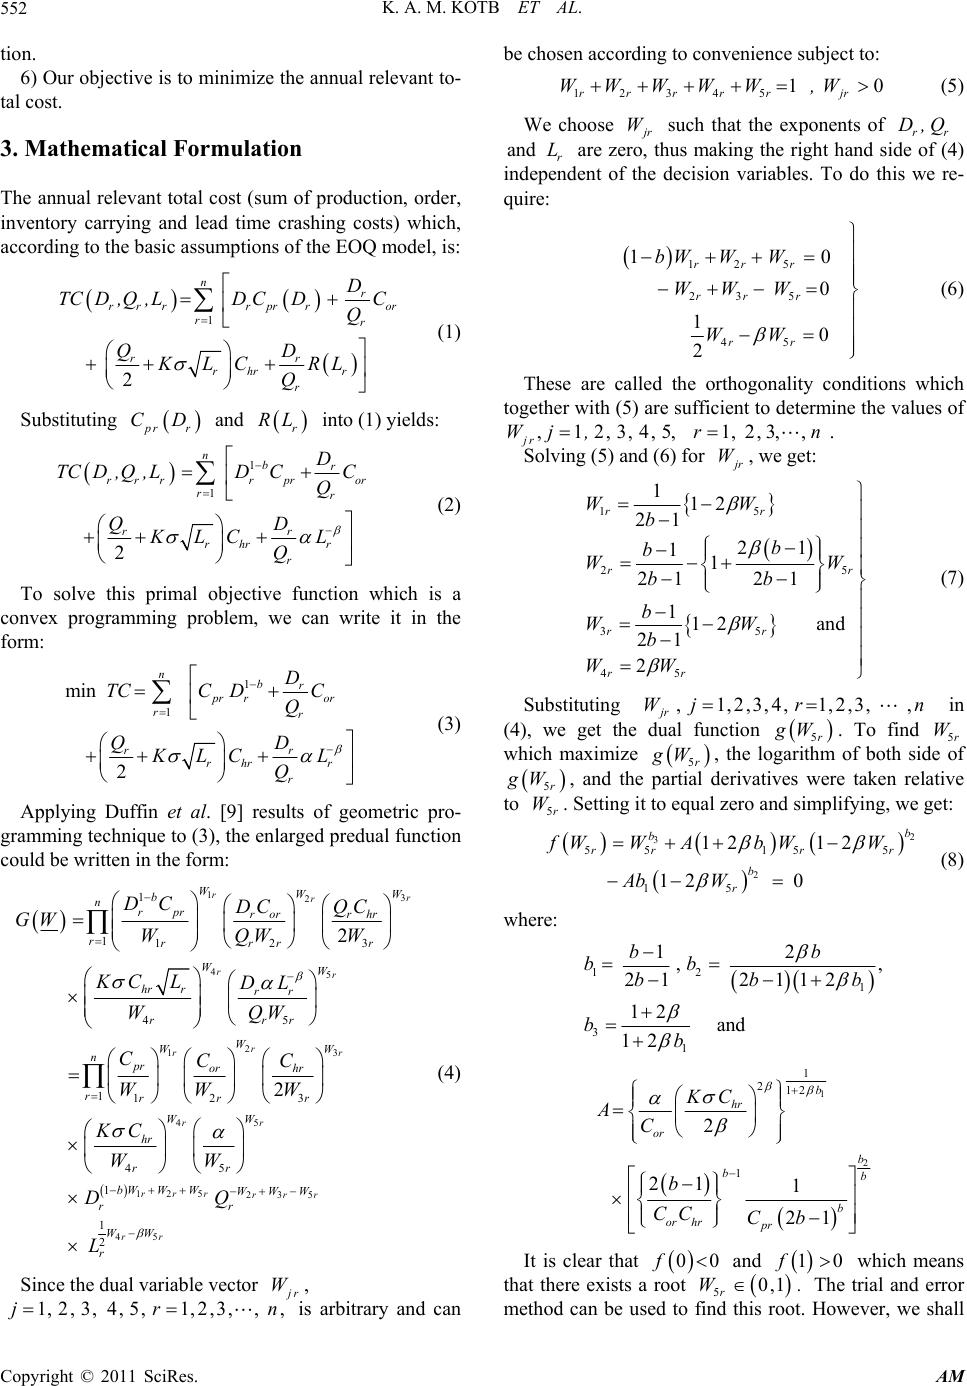 K. A. M. KOTB ET AL. 552 tion. 6) Our objective is to minimize th e annual relevant to- tal cost. 3. Mathematical Formulation The annual relevant total cost (sum of production, order, inventory carrying and lead time crashing costs) which, according to the basic assumptions of the EOQ model, is: 1 2 nr rrrrpr ror rr rr rhrr r D TC D,Q,LDCDC Q QD KLC RL Q (1) Substituting rr CD and r RL into (1) yields: 1 1 2 nbr rr rrpror rr rr rhrr r D TC D,Q,LDCC Q QD KLC L Q (2) To solve this primal objective function which is a convex programming problem, we can write it in the form: 1 1 min 2 nbr pr ror rr rr rhrr r D TCC DC Q QD KLC L Q (3) Applying Duffin et al. [9] results of geometric pro- gramming technique to (3), the enlarged predual function could be written in the form: 13 2 45 2 13 5 4 1 1123 45 112 3 45 1 2 2 rr r rr r rr r r WW W b nrpr ror rhr rrrr r WW hr rrr rrr W WW npr or hr rrr r W W hr rr bW r DC DC QC GW WQWW KC LDL WQW CCC WW W KC WW D 125 235 45 1 2 rrr rrr rr WW WWW r WW r Q L (4) Since the dual variable vector r, is arbitrary and can be chosen according to convenience subject to: W ,1,2,3,4, 5,1,2,3,,jr n 0 12345 1 rrrrr jr WWWWW ,W (5) We choose r such that the exponents of rr are zero, thus making the right hand side of (4) independent of the decision variables. To do this we re- quire: WD,Q and r L 12 5 23 5 45 10 0 10 2 rrr rr r rr bW WW WW W WW (6) These are called the orthogonality conditions which together with (5) are sufficient to determine the v alues of ,12,3,4,5, jr Wj, 1,2, 3,,rn . Solving (5) and (6) for r W, we get: 15 25 35 45 112 21 21 11 21 21 112 and 21 2 rr rr rr rr WW b b b WW bb b WW b WW (7) Substituting ,1,2,3,4, 1,2,3,, jr Wj rn 5r gW in (4), we get the dual function . To find 5r W which maximize 5r gW , the logarithm of both side of 5r gW 5r W, and the partial derivatives were taken relative to . Setting it to equal zero and simplifying, we get: 2 3 2 5515 5 15 12 12 12 0 b b rrr r b r fWW AbWW Ab W (8) where: 12 1 31 12 ,, 21 2112 12 and 12 bb bb bb bb b 1 2 1 212 1 2 21 1 21 b hr or b bb b or hrpr KC AC b CC Cb It is clear that 00f and which means that there exists a root 10f 5r. The trial and error method can be used to find this root. However, we shall 0,1W Copyright © 2011 SciRes. AM 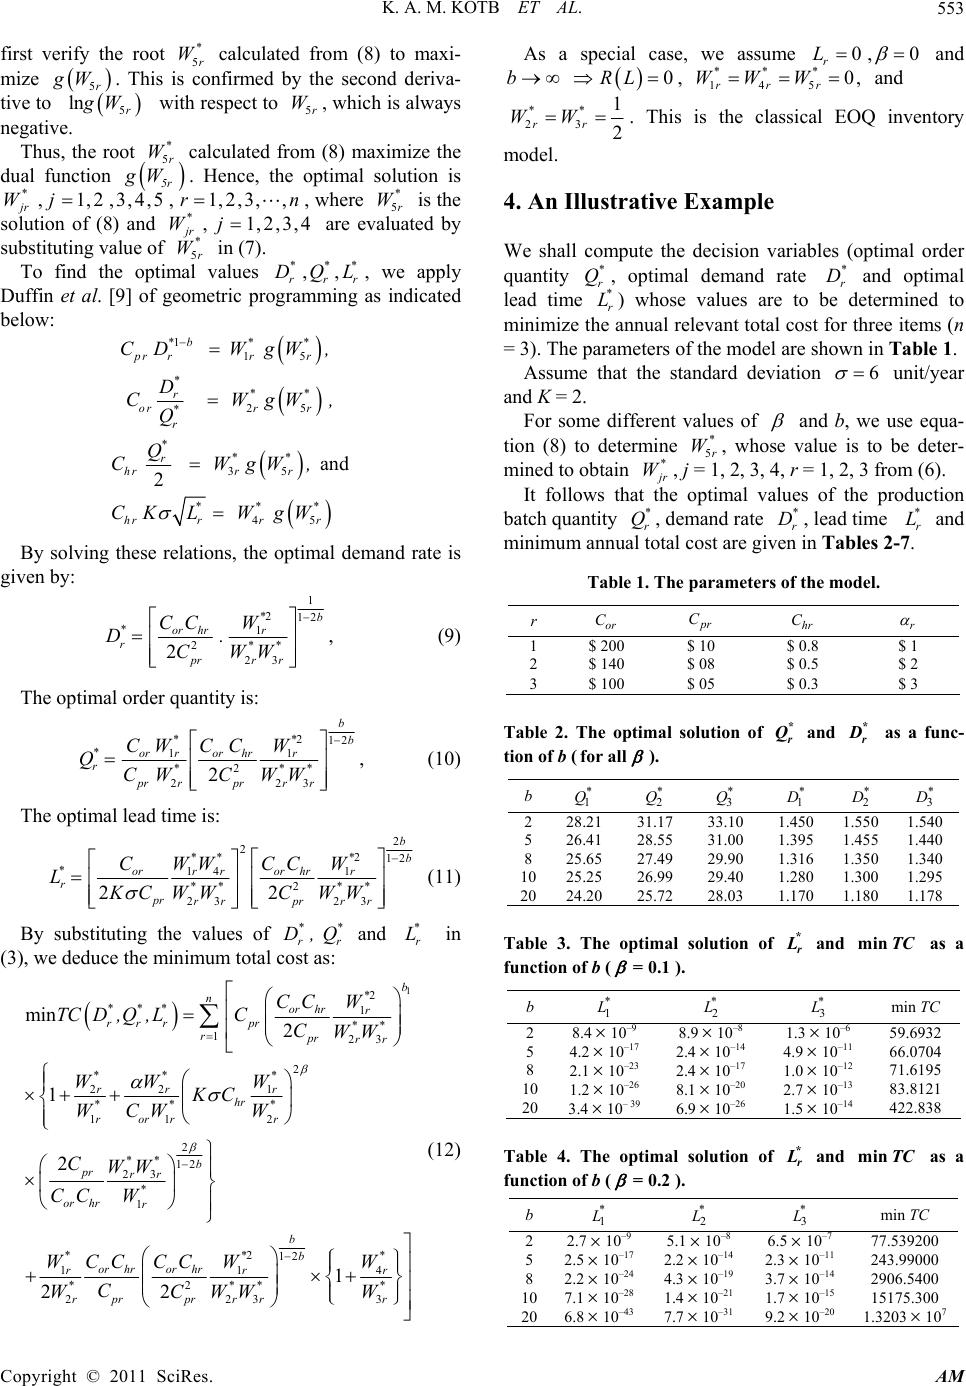 K. A. M. KOTB ET AL.553 first verify the root 5 calculated from (8) to maxi- mize . This is confirmed by the second deriva- tive to with respect to , which is always negative. * r W * r ,r * jr Wj * r W 5r gW lngW 1,2,Wj 5r W gW 3,4, 5r W ,n 2,3,4 ** DQ Thus, the root calculated from (8) maximize the dual function . Hence, the optimal solution is , where 5 is the solution of (8) and are evaluated by substituting value of in (7). 5 5r 5, 1,2,3, * jr ,1, * r W * 5 To find the optimal values rr r , we apply Duffin et al. [9] of geometric programming as indicated below: ,,L 15 25 * r ** r W g 1*b r * r * r * r r Wg, D CWW, Q pr or CD 45 ** r r gW gW 35 and 2 * rr *** r r CW , L W hr hr Q CK By solving these relations, the optimal demand rate is given by: 1 12b 2 1 223 , 2 * or hrr ** prr r CC W D. CWW * r (9) The optimal order quantity is: 212 11 2 223 , 2 b **b * r Qor pr rorhrr *** rprr r CW CCW CWC WW (10) The optimal lead time is: 2 2212 14 1 2 23 23 2 * r L2 b *** b or hr rr r ** ** pr rrpr rr CCC WW W WWCWW or KC (11) By substituting the values of in (3), we deduce the minimum total cost as: and ** * rr r D,Q L 1 2 1 123 2 22 1 11 2 2 12 2 11 2 223 min 2 1 22 b * n *or hrr r pr** rpr rr ** * rr r hr ** * rr r b rr ** or hr rr *** rprrr CC W LC CWW W KC W W CC WW WCWW 23 1 2 ** rr ro ** pr * or hr r or hr pr TC D ,Q , WW WC CWW CC W CC C 12 4 3 1 b* br * r W W (12) As a special case, we assume 0, 0 r L and 0bRL , and 14 ** rr WW 5 0, * r W 23 1 2 ** rr WW . This is the classical EOQ inventory model. 4. An Illustrative Example We shall compute the decision variables (optimal order quantity , optimal demand rate and optimal lead time ) whose values are to be determined to minimize the annual relev ant total cost for three items (n = 3). The parameters of the model are shown in Table 1. * r Q* r L * r D Assume that the standard deviation 6 unit/year and K = 2. For some different values of and b, we use equa- tion (8) to determine 5, whose value is to be deter- mined to obtain * r W * r W, j = 1, 2, 3, 4, r = 1, 2, 3 from (6). It follows that the optimal values of the production batch quantity Q demand rate * r Dad time * r L and minimum annual total cost are given in Tables 2-7. * r,, le Table 1. The parameters of the model. r or C r C hr C r 1 $ 200 $ 10 $ 0.8 $ 1 2 $ 140 $ 08 $ 0.5 $ 2 3 $ 100 $ 05 $ 0.3 $ 3 Table 2. The optimal solution of and * r Q* r as a func- tion of b (forall ). b 1 * Q 2 * Q 3 * Q 1 * D 2 * D 3 * D 2 28.21 31.17 33.10 1.450 1.5501.540 5 26.41 28.55 31.00 1.395 1.4551.440 8 25.65 27.49 29.90 1.316 1.3501.340 1025.25 26.99 29.40 1.280 1.3001.295 2024.20 25.72 28.03 1.170 1.1801.178 Table 3. The optimal solution of and as a function of b (). * r LminTC =0.1 b 1 * 2 * 3 * min TC 2 8.4 10–9 8.9 10–8 1.310–6 59.6932 5 4.2 10–17 2.4 10–14 4.910–11 66.0704 8 2.1 10–23 2.4 10–17 1.010–12 71.6195 10 1.2 10–26 8.1 10–20 2.710–13 83.8121 20 3.4 10– 396.9 10–26 1.510–14 422.838 Table 4. The optimal solution of and as a function of b ( * r LminTC =0.2 ). b 1 * 2 * 3 * min TC 2 2.7 10–9 5.1 10–8 6.510–7 77.539200 5 2.5 10–17 2.2 10–14 2.310–11 243.99000 8 2.2 10–24 4.3 10–19 3.710–14 2906.5400 10 7.1 10–28 1.4 10–21 1.710–15 15175.300 20 6.8 10–43 7.7 10–31 9.210–20 1.3203 107 Copyright © 2011 SciRes. AM 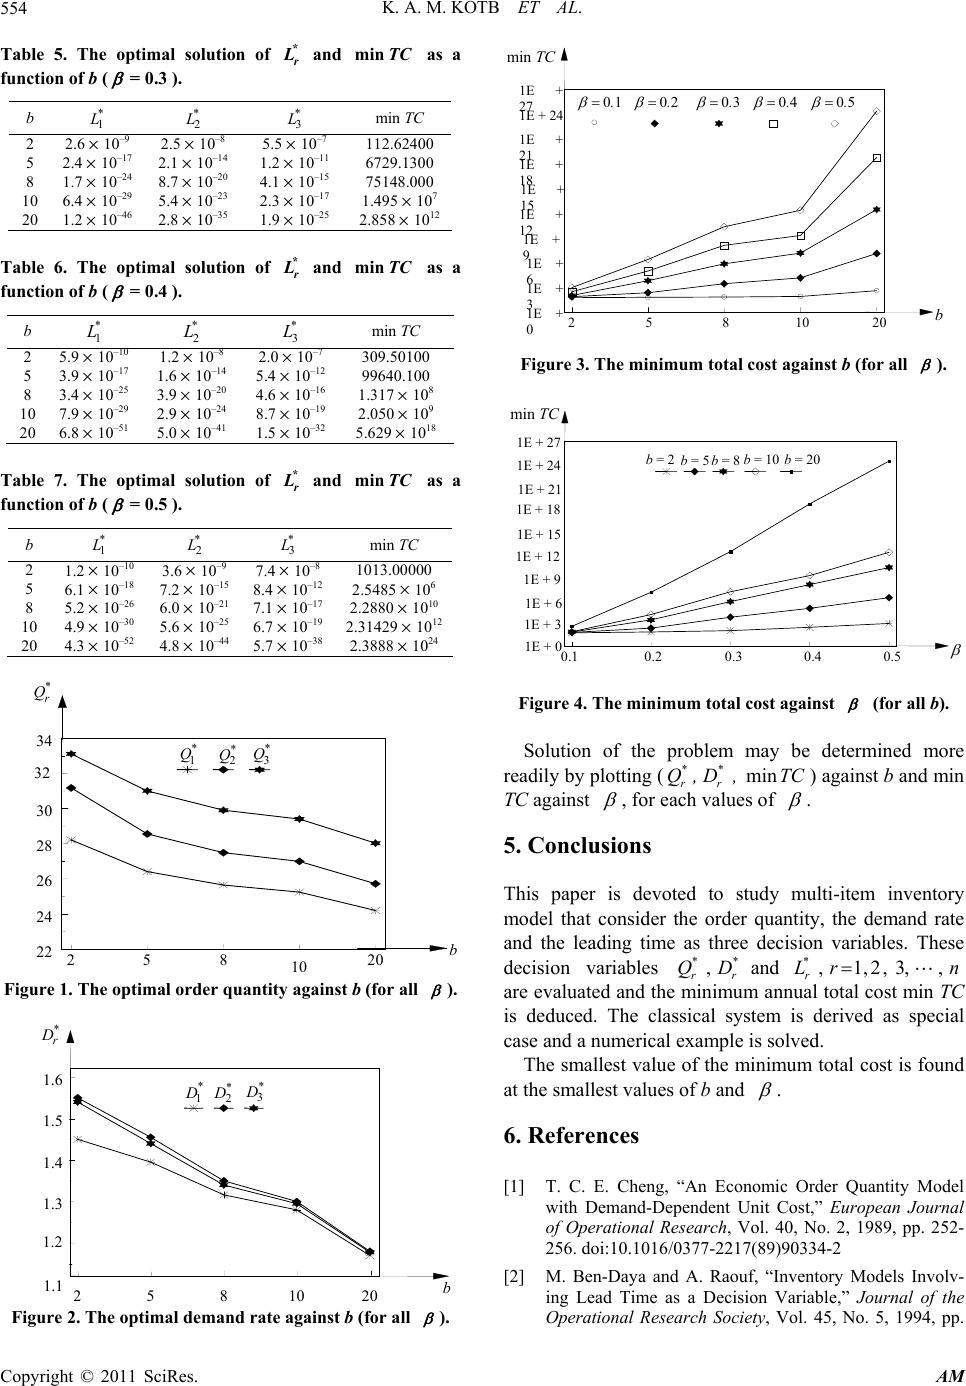 K. A. M. KOTB ET AL. 554 Table 5. The optimal solution of and as a function of b (). * r LminTC =0.3 b 1 * 2 * 3 * min TC 2 2.6 10–9 2.510–8 5.510–7 112.62400 5 2.4 10–17 2.110–14 1.210–11 6729.1300 8 1.7 10–24 8.710–20 4.1 10–15 75148.000 10 6.4 10–29 5.410–23 2.310–17 1.495 107 20 1.2 10–46 2.810–35 1.9 10–25 2.858 1012 Table 6. The optimal solution of and as a function of b ( * r LminTC =0.4 ). b 1 * 2 * 3 * min TC 2 5.9 10–10 1.210–8 2.010–7 309.50100 5 3.9 10–17 1.610–14 5.4 10–12 99640.100 8 3.4 10–25 3.910–20 4.6 10–16 1.317 108 10 7.9 10–29 2.910–24 8.7 10–19 2.050 109 20 6.8 10–51 5.010–41 1.5 10–32 5.629 1018 Table 7. The optimal solution of and as a function of b ( * r LminTC =0.5 ). b 1 * 2 * 3 * min TC 2 1.2 10–10 3.610–9 7.410–8 1013.00000 5 6.1 10–18 7.210–15 8.410–12 2.5485 106 8 5.2 10–26 6.010–21 7.110–17 2.2880 1010 10 4.9 10–30 5.610–25 6.710–19 2.31429 1012 20 4.3 10–52 4.810–44 5.710–38 2.3888 1024 Figure 1. The optimal order quantity against b (for all ). Figure 2. The optimal demand rate against b (for all ). Figure 3. The minimum total cost against b (for all ). Figure 4. The minimum total cost against (for all b). Solution of the problemmay be determined more re adily by plotting (min ** rr Q,D ,TC) against b and min TC against , for each values of . 5. Conclusions his paper is devoted to study multi-item inventory tal cost is found at T model that consider the order quantity, the demand rate and the leading time as three decision variables. These decision variables ,and,1,2,3,, ** * rr r QD Lrn are evaluated and the is deduced. The classical system is derived as special case and a numerical example is solved. The smallest value of the minimum to minimum annual total cost min TC the smallest values of b and . 6. References ] T. C. E. Cheng, “An Economic Order Quantity Model Models Involv- [1 with Demand-Dependent Unit Cost,” European Journal of Operational Research, Vol. 40, No. 2, 1989, pp. 252- 256. doi:10.1016/0377-2217(89)90334-2 [2] M. Ben-Daya and A. Raouf, “Inventory ing Lead Time as a Decision Variable,” Journal of the Operational Research Society, Vol. 45, No. 5, 1994, pp. 10 2 5 8 10 20 1.1 1.2 1.3 1.4 1.5 1.6 * 1 D * 2 D* 3 D b * r D 58 10 202 1E + 3 0 1E + 6 1E + 9 1E + 12 1E + 15 1E + 18 1E + 21 1E + 1E + 24 27 1E + b min T 01 02030405.. ... n TCmi 0.2 10.3 0.4 0.50. 1E + 0 1E + 3 1E + 6 1E + 9 1E + 12 1E + 15 1E + 18 1E + 21 1E + 24 1E + 27b = 2b = 5b = 8b = 10b = 20 * r Q 34 2 5 8 20 22 24 26 28 30 32 * 1 Q* 2 Q* 3 Q b Copyright © 2011 SciRes. AM  K. A. M. KOTB ET AL. Copyright © 2011 SciRes. AM 555 Model with Varying Holding Cost under Two mand and Cost ulti-Item Inventory osts and Demand- Geometric QO Cost: A Geometric Pro- n Wiley, New 579-582. [3] M. O. Abou-El-Ata and K. A. M. Kotb, “Multi-Item EQO Inventory Restrictions: A Geometric Programming Approach,” Pro- duction Planning & Control, Vol. 8, No. 6, 1997, pp. 608-611. doi:10.1080/095372897234948 [4] J. T. Teng and H. L. Yang, “Deterministic Inventory Lot-Size Models with Time-Varying De under Generalized Holding Costs,” Information and Man- agement Sciences, Vol. 18, No. 2, 2007, pp. 113-125. [5] H. Jung and C. M. Klein, “Optimal Inventory Policies under Decreasing Cost Functions via Geometric Pro- gramming,” European Journal of Operational Research, Vol. 132, No. 3, 2001, pp. 628-642. doi:10.1016/S0377-2217(00)00168-5 [6] K. Das, T. K. Roy and M. Maiti, “M with Quantity-Dependent Inventory C Yor Dependent Unit Cost under Imprecise Objective and Re- strictions: A Geometric Programming Approach,” Pro- duction Planning & Control, Vol. 11, No. 8, 2000, pp. 781-788. doi:10.1080/095372800750038382 [7] N. K. Mandal, T. K. Roy and M. Maiti, “Inventory Model of Deteriorated Items with a Constraints: A Programming Approach,” European Journal of Opera- tional Research, Vol. 173, No. 1, 2006, pp. 199-210. doi:10.1016/j.ejor.2004.12.002 [8] K. A. M. Kotb and H. A. Fergany, “Multi-Item E Model with Varying Holding gramming Approach,” International Mathematical Fo- rum, Vol. 6, No. 23, 2011, pp. 1135-1144. [9] R. J. Duffin, E. L. Peterson and C. Zener, “Geometric Programming—Theory and Application,” Joh k, 1967.
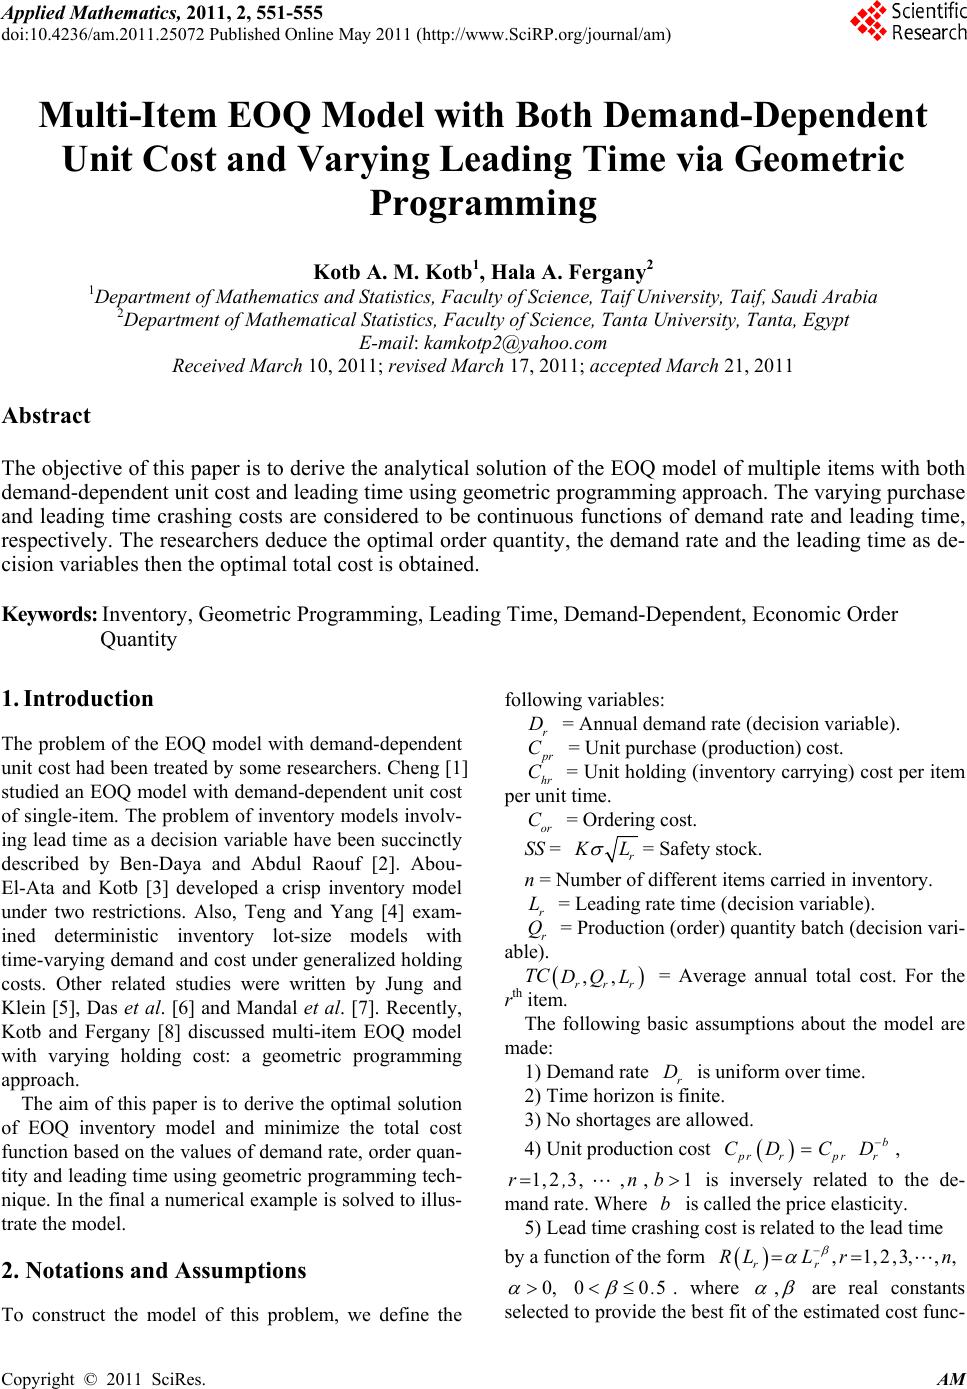
|