 Journal of Environmental Protection, 2011, 2, 304-315 doi:10.4236/jep.2011.23034 Published Online May 2011 (http://www.scirp.org/journal/jep) Copyright © 2011 SciRes. JEP 1 Plankton-Based Assessment of the Trophic State of Three Tropical Lakes Benedict Obeten Offem, Ezekiel Olatunji Ayotunde, Gabriel Ujong Ikpi, F. B. Ada, Steven Ncha Ochang Department of Fisheries and Aquatic Sciences, Cross River University of Technology Obubra Campus, Obubra, Nigeria. Email: benbeff06@yahoo.com Received January 5th, 2011; revised February 19th, 2011; accepted March 31st, 2011. ABSTRACT In developing countries, lakes being important sources of water supply and fishing are vulnerable to anthropogenic impact, yet knowledge of their troph ic state in relation to chang es in species composition , and environmental variab les, are limited. This study is aimed at assessing the tro phic status of la kes by monthly samplin g of three la kes loca ted along the floodplain of Cross River, Nigeria between January 2008 and December 2009. Samples were analyzed for water quality parameters , zooplankton and phytoplankton composition and distribution. Results were subjected to community structure analysis using trophic state index, species richness and diversity indexes. Essential primary productivity nu- trients, nitrates, sulphates and phosphates were highest in Ejagham Lake, and lowest in Ikot Okpora Lake. Dominant phytoplankton species Oscillatoria lacustria (Cyanophyceae), Cyclotella operculata (Bacilliarophyceae) and zoo- plankton Keratella tropica, Keratella quadrata , Filinia longiseta , Branchionus anguillaris and Trich ocerca pusilla (ro- tifers) all typical of eutrophic communities were recorded in high densities in Ejagham Lake in both dry and wet sea- sons while Cladocerans, Bosmina longirostris and Moina micrura and copepods considered indicators of oligotrophy and mesotrophy were reco rded in large numbers in Iko t Okpora and Obubra Lakes respectively. High er values of spe- cies richness, Evenness and Shannon- Wiener diversity index for both ph ytoplankton a nd zooplan kton, were recorded in Ejagham Lake during the dry season than wet. Also values of the Trophic state index were generally highest at the Ejagham Lake in the savanna region of the floodplain and lowest at Ikot Okpora in the forest region of the floodplain. Forest region is therefore a limiting factor in the productivity of lakes in the tropics. Keywords: Zooplankton, Phytopl an kton, Trophic Stat e I ndex, Diversity Indices, Species Richness 1. Introduction Biological approaches to evaluating water quality in- volve assessing communities of organisms. “The basis for this approach is that different species have varying tolerances to environmental stressors” [1]. Fish produc- tivity of water bodies is connected to primary production by many intermediate trophic links. The four groups of organisms that appear in The European Water Frame- work Directives WFD (Phytoplankton, Zooplankton, Fish and macrophytes), represent water ecological struc- ture over a range of temporal and spatial scales and func- tional roles. It was recommended that the above biologi- cal indicators and, in addition to a range of supporting hydro-morphological and physico-chemical elements should form the core of any monitoring program on lakes [2]. Seasonal changes in mean temperature, radiations, hydrology and nutrient availability are the most impor- tant variables which determine plankton abundance [3]. Also the qualitative and quantitative estimates of the plankton provide good indices of quality and productive capacity of water. The estimation of phytoplankton density, productivity and trophic status of lakes is very important for fisheries management especially in Nigeria because of dominant tilapia fish culture. The trophic status of a water body is usually estimated by values of primary production meas- ured for the growing season. Classification of lakes based on quantitative trophic indicators such as phos- phorus (P) concentration, chlorophyll-a and transparency also allow the trophic status of lakes on a large gradient to be defined [4]. However, these parameters are not al- ways relevant for short-term evolution within any given lake, especially when variations in phosphorus concen- tration are low. The values of chlorophyll-a (μg·l−1) are mostly used as the basic criteria, because it is relatively  Plankton-Based Assessment of the Trophic State of Three Tropical Lakes 305 easy and inexpensive to measure and it is a generally used biological measure of phytoplankton biomass and relatively few measurements are needed to get reliable mean value [5]. Carlson’s Trophic State Index (TSI) classification [6] can be used to provide a single trophic criterion for the purpose of classifying and ranking water bodies in complex multi-wetland systems. Secchi depth is a much debated and used variable in lake management. Secchi disk transparency is a standard indicator of water clarity, which is strongly correlated with biomass and annual productivity of suspended algae. This is also closely related to the amount of sandy clay, detritus and organic and inorganic suspended and dissolved matter in water [7]. The use of zooplankton community structure as indi- cator of the wellbeing of water body dates back to 1879- 1910 [8]. Zooplankton is an important component of the trophic food webs of lakes because of its particular posi- tion at the crossroads of carbon and energy flows from the lower levels of food chains to fish. Zooplankton biomass which is part of secondary production of lakes is bottom-up regulated by the availability of bacteria and phytoplankton as food and top-down controlled by pre- dation from fish etc. [9]. The composition of zooplank- ton especially in relation to filter feeders depends on the quality of nutrient supply. So some zooplankton species (mainly rotifers, branchiopods and copepods) could be used as indicators of lakes trophic status [10] because their composition is affected by any of the several envi- ronmental parameters e.g. pH or alkalinity and salinity and other biological parameters [11-13]. Zooplankton abundance is usually closely related to phytoplankton concentration and species composition and increases with increasing nutrients concentrations [14]. Biodiversity is also one of the promising ecological criteria that could be added to lake monitoring pro- grammes. Plankton richness within lakes appears to be largely controlled by factors related to productivity, wa- ter quality and fish predation levels. Diversity indices, such as Shannon-Weaner index appeared to detect sig- nificant differences in the structure of the communities. Around the world several researches have been carried out using phytoplankton and zooplankton to investigate pollution [15-19] because they are relatively easy to identify, particularly when community sensitivity can be detected based on plankton body sizes or gross taxo- nomic classifications. Eastern Nigerian lakes in particu- lar being important sources of water for drinking, fishing and domestic use are vulnerable to anthropogenic impact, yet there is limited water quality data [20,21]. This is the first-ever baseline study of the condition of the nation’s akes in eastern Nigeria using statistically valid approach. It will help the government of the region implement lake l monitoring and assessment programs, establish a base- line for lake condition that can be used for future trend assessment. It is focused on studying plankton diversity and evaluating trophic status of some wetlands of East- ern Nigeria for the first time. 2. Materials and Methods 2.1. Study Site The Cross River, a floodplain river in south-eastern Ni- geria between latitude 4˚25' - 7˚00'N and longitude 7˚15'- 9˚30'E, is bounded in the south by the Atlantic Ocean, east by the Republic of Cameroun and the Nigerian states of Benue in the north, Ebonyi and Abia in the west and Akwa Ibom in the south-west (Figure 1). The climate of the study area comprises a wet season (April- October) characterized by high precipitation (3050 ± 230 mm) and a dry season (November - March) marked by low pre- cipitation (300 ± 23 mm) [22]. Temperatures range from 15.5˚C ± 7.6˚C in the wet season to 32.6˚C ± 5.4˚C in the dry season [20]. Along the floodplain of Cross River are located series of wetlands consisting of lakes, ponds and swamps. The main source of water for these lakes is rainfall and flood water from the river. For the purpose of this study, three lakes were randomly selected along the floodplain of The Cross River, one each from upper section of the floodplain (Ejagham lake), middle portion (Obubra Lake) and down section (Ikot Okpora Lake). Ikot Okpora Lake covers an area of 4 hectares and has maximum depth of 8m with a muddy substratum. The lake is used mainly for fishing and has a shoreline thickly shaded by rainforest preventing the effect of di- rect sunlight rays on the lake water. The lake was almost covered by water hyacinth at the peak of wet season. Bamboo (Bambusa bambusa), Palm trees (E. guinensis) and some other trees characteristics of typical rainforest were present. There was palm oil processing mill near the station and common human activities included drinking, bathing, washing and fishing. Obubra Lake had a rocky, gravel and sandy substratum and covers 4 hec- tares with maximum depth of 6 m with shoreline sparsely shaded by forest and savanna grassland. Ejagham Lake, has a sandy and silt dominated substratum opened to direct effect of sunlight ray and shoreline dominated by dense macro-flora Ipomoea pestigridis, Monechma ciliatum, Eragrostic p ilosa and Setaria pallid e-fusia. The most visible human activities and excavation of sand. 2.2. Sampling Techniques Monthly sampling of the three lakes was carried out from anuary 2008 to December 2009 at the middle of every J Copyright © 2011 SciRes. JEP  Plankton-Based Assessment of the Trophic State of Three Tropical Lakes Copyright © 2011 SciRes. JEP 306 Figure 1. Map of Cross River State showing sampling sites (Source: Cross Riv er State Ministry of lands and survey). month, between 8 a.m. and 11 a.m. every sampling day. 2.3. Water Quality Parameters Temperature values were recorded from a mercury-in glass thermometer graduated in units of ˚C by immersing the thermometer slightly under the surface of water (2 cm) for 5 minutes until mercury stood at one place). Pye Unicam Model 7065 electronic metre at 25˚C after stan- dardization with buffer solution at pH 4, 7 and 9 was used for pH. Dissolved oxygen concentration of the wa- ter samples was determined with a Jen-way 9071 digital oxygen analyzer. Water transparency was measured by use of Secchi disc [23]. The disc was lowered into water and the depth at which it became invisible was recorded. It was then gradually withdrawn from the water and the depth at which it became visible was noted. The trans-  Plankton-Based Assessment of the Trophic State of Three Tropical Lakes 307 parency of the water at that station was the mean of the two readings. For the total dissolved solids (TDS), the Hach TDS meter was put on, the reading zeroed and then the electrode dipped into the water sample and the read- ing taken. Conductivity was assessed by putting on the Suntex conductivity meter, adjusting the reading portion and dipping the meter into the water sample and ap- proximate reading taken. Total hardness, free Carbon dioxide, Acidity, Chemical Oxygen Demand, was ob- tained by titrimetric method [24]. Biological Oxygen Demand was determined by difference between initial and final dissolved oxygen after incubation for 5 days at room temperature of (20˚C). Total alkalinity was meas- ured by titrating water samples with sulphuric acid stan- dard solution, using a drop of phenolphthalein solution and one sachet of bromcresol green-methyl red as indi- cator, until the sample changed from blue green to pink. Total alkalinity which is expressed in mg/L is the total number of drops of sulphuric acid solution used multi- plied by 17.1 (Fish Farmers’ Water Quality Testing Kit Manual, 1990). Nitrate and Phosphate were measured with brucine and Ascorbic acid methods respectively. Salinity was determined using hand held refractometer (S/mill-E 0-100%). Bicarbonate ion was measured with pH electrode dipped into the tip of the conical container. Sample water was passed through until a constant read- ing was obtained and a marble powder was added, to completely cover the electrode ball. After about 2 min- utes, the pH was read again. The temperature of the mar- ble was monitored with thermometer during measure- ment. Carbonate ions was determine by placing hydro- chloric acid, between 2 and 10 ml of water sample in a gas generator and insert tube filled with 20 ml hydro- chloric acid (10%). After connecting to the apparatus, the graduated tube was filled by raising the level container. The gas generator was then tilted so that the hydrochloric acid makes contact with the floor. A pressure compensa- tion was attained by sinking the container so that, after about 10 minutes the gas volume can be read. Color was determine by assembling Filter apparatus (membrane filter, filter holder, aspirator and folter flask) and allowed about 50 ml of dematerialized water to pass through to rinse the unit. Discard rinse water. Approximately 50 ml of water sample was filtered and 25 ml poured into an- other clean cell. The dematerialized water was placed in a cell holder and sample compartment door was closed. The demineralization was used to set the zero concentra- tion point. 2.4. Phytoplankton Planktons were collected in sterilized, one-litre wide mouth dark colour plastic bottles at each sampling sta- tion, reduced to 10 ml by decanting the supernatant ali- quot and preserved with Lugol’s solution. Samples were shifted to laboratory where they were identified after Prescott [25], Edmondson [26] and John et al. [27]. For Chlorophyll-a analysis 100 ml water sample were filtered through Millipore micro filters (47 mm; 45 μm pores). Concentration of Chlorophyll-a in supernatant was de- termined by spectrophotometer, with absorbance at 665 nm and 750 nm [28]. 2.5. Zooplankton Zooplankton was collected by towing a-55µ mesh-sized plankton net against the current flow at the subsurface level for two minutes [29]. The filtered samples were washed into the sterilized collecting bottles and immedi- ately fixed in 4% formalin. The percentage relative abundance of the specimen was estimated by irect count. Each quantitative sample was concentrated to 10 ml and from this; 1 ml of sample was taken and all individual taxa present were counted. Relative abundance was cal- culated as the number of individuals per liter of water filtered though the net. They were identified with an Olympus Vanox Research Microscope (mag X60) Model 230485 using keys given by Kadiri [30] and Kemdirim [31]. 2.6. Community Structure Analysis Trophic state index based on Secchi Depth TSI (SD) and Trophic state index based on Chlorophyll-a, TSI (Chl-a) and that based on phosphorus, TSI(TP) were calculated after Carlson [32] using the following equations: TSI (Secchi Disk) = 60 − 14.1 In (SD) where SD is Secchi Disk in meters(m) TSI (Chlorophyll a) = 9.81(In Chl-a) + 30.6 where Chl a is mean chlorophyll a in μg·l−1 TSI (Total Phosphorus) = 14.41 ln (TP) + 4.15 where TP is mean total phosphorus in μg·l−1. Diversity indices used were species diversity (H ), species richness (d) and species evenness. Shan- non-Weaner diversity function was used to calculate het- erogeneity for each site. This index takes into account the total number of species present as well as their respective abundance thus providing a more convenient means of comparing differences between ecological communities. These changes in the environment are reflected in the types and number of organisms. Richness index was expressed using Margelef’s rich- ness index. This measure relies only on the number of taxa. Richness increases when abundance is spread over a greater number of categories but does not take into account the evenness of the distribution. Also between two samples with the same S, richness will be higher in Copyright © 2011 SciRes. JEP 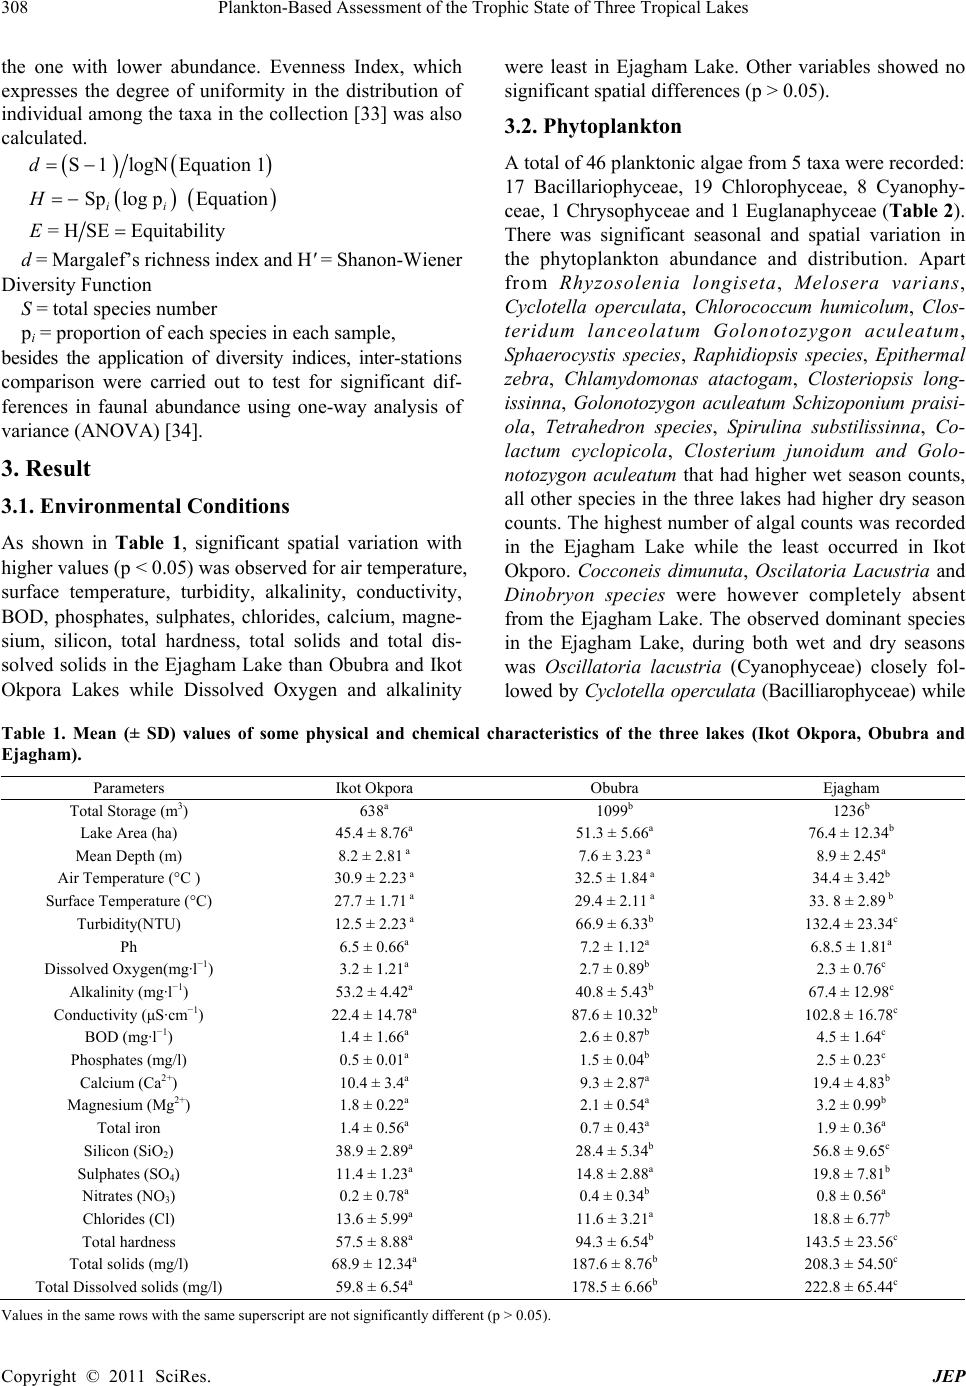 Plankton-Based Assessment of the Trophic State of Three Tropical Lakes Copyright © 2011 SciRes. JEP 308 the one with lower abundance. Evenness Index, which expresses the degree of uniformity in the distribution of individual among the taxa in the collection [33] was also calculated. were least in Ejagham Lake. Other variables showed no significant spatial differences (p > 0.05). 3.2. Phytoplankton S1logNEquation 1d A total of 46 planktonic algae from 5 taxa were recorded: 17 Bacillariophyceae, 19 Chlorophyceae, 8 Cyanophy- ceae, 1 Chrysophyceae and 1 Euglanaphyceae (Table 2). There was significant seasonal and spatial variation in the phytoplankton abundance and distribution. Apart from Rhyzosolenia longiseta, Melosera varians, Cyclotella operculata, Chlorococcum humicolum, Clos- teridum lanceolatum Golonotozygon aculeatum, Sphaerocystis species, Raphidiopsis species, Epithermal zebra, Chlamydomonas atactogam, Closteriopsis long- issinna, Golonotozygon aculeatum Schizoponium praisi- ola, Tetrahedron species, Spirulina substilissinna, Co- lactum cyclopicola, Closterium junoidum and Golo- notozygon aculeatum that had higher wet season counts, all other species in the three lakes had higher dry season counts. The highest number of algal counts was recorded in the Ejagham Lake while the least occurred in Ikot Okporo. Cocconeis dimunuta, Oscilatoria Lacustria and Dinobryon species were however completely absent from the Ejagham Lake. The observed dominant species in the Ejagham Lake, during both wet and dry seasons was Oscillatoria lacustria (Cyanophyceae) closely fol- lowed by Cyclotella operculata (Bacilliarophyceae) while Splog p Equation ii H H SEEquitabilityE= d = Margalef’s richness index and H' = Shanon-Wiener Diversity Function S = total species number pi = proportion of each species in each sample, besides the application of diversity indices, inter-stations comparison were carried out to test for significant dif- ferences in faunal abundance using one-way analysis of variance (ANOVA) [34]. 3. Result 3.1. Environmental Conditions As shown in Table 1, significant spatial variation with higher values (p < 0.05) was observed for air temperature, surface temperature, turbidity, alkalinity, conductivity, BOD, phosphates, sulphates, chlorides, calcium, magne- sium, silicon, total hardness, total solids and total dis- solved solids in the Ejagham Lake than Obubra and Ikot Okpora Lakes while Dissolved Oxygen and alkalinity Table 1. Mean (± SD) values of some physical and chemical characteristics of the three lakes (Ikot Okpora, Obubra and Ejagham). Parameters Ikot Okpora Obubra Ejagham Total Storage (m3) 638a 1099b 1236b Lake Area (ha) 45.4 ± 8.76a 51.3 ± 5.66a 76.4 ± 12.34b Mean Depth (m) 8.2 ± 2.81 a 7.6 ± 3.23 a 8.9 ± 2.45a Air Temperature (°C ) 30.9 ± 2.23 a 32.5 ± 1.84 a 34.4 ± 3.42b Surface Temperature (°C) 27.7 ± 1.71 a 29.4 ± 2.11 a 33. 8 ± 2.89 b Turbidity(NTU) 12.5 ± 2.23 a 66.9 ± 6.33b 132.4 ± 23.34c Ph 6.5 ± 0.66a 7.2 ± 1.12a 6.8.5 ± 1.81a Dissolved Oxygen(mg·l−1) 3.2 ± 1.21a 2.7 ± 0.89b 2.3 ± 0.76c Alkalinity (mg·l−1) 53.2 ± 4.42a 40.8 ± 5.43b 67.4 ± 12.98c Conductivity (μS·cm−1) 22.4 ± 14.78a 87.6 ± 10.32b 102.8 ± 16.78c BOD (mg·l−1) 1.4 ± 1.66a 2.6 ± 0.87b 4.5 ± 1.64c Phosphates (mg/l) 0.5 ± 0.01a 1.5 ± 0.04b 2.5 ± 0.23c Calcium (Ca2+) 10.4 ± 3.4a 9.3 ± 2.87a 19.4 ± 4.83b Magnesium (Mg2+) 1.8 ± 0.22a 2.1 ± 0.54a 3.2 ± 0.99b Total iron 1.4 ± 0.56a 0.7 ± 0.43a 1.9 ± 0.36a Silicon (SiO2) 38.9 ± 2.89a 28.4 ± 5.34b 56.8 ± 9.65c Sulphates (SO4) 11.4 ± 1.23a 14.8 ± 2.88a 19.8 ± 7.81b Nitrates (NO3) 0.2 ± 0.78a 0.4 ± 0.34b 0.8 ± 0.56a Chlorides (Cl) 13.6 ± 5.99a 11.6 ± 3.21a 18.8 ± 6.77b Total hardness 57.5 ± 8.88a 94.3 ± 6.54b 143.5 ± 23.56c Total solids (mg/l) 68.9 ± 12.34a 187.6 ± 8.76b 208.3 ± 54.50c Total Dissolved solids (mg/l) 59.8 ± 6.54a 178.5 ± 6.66b 222.8 ± 65.44c Values in the same rows with the same superscript are not significantly different (p > 0.05). 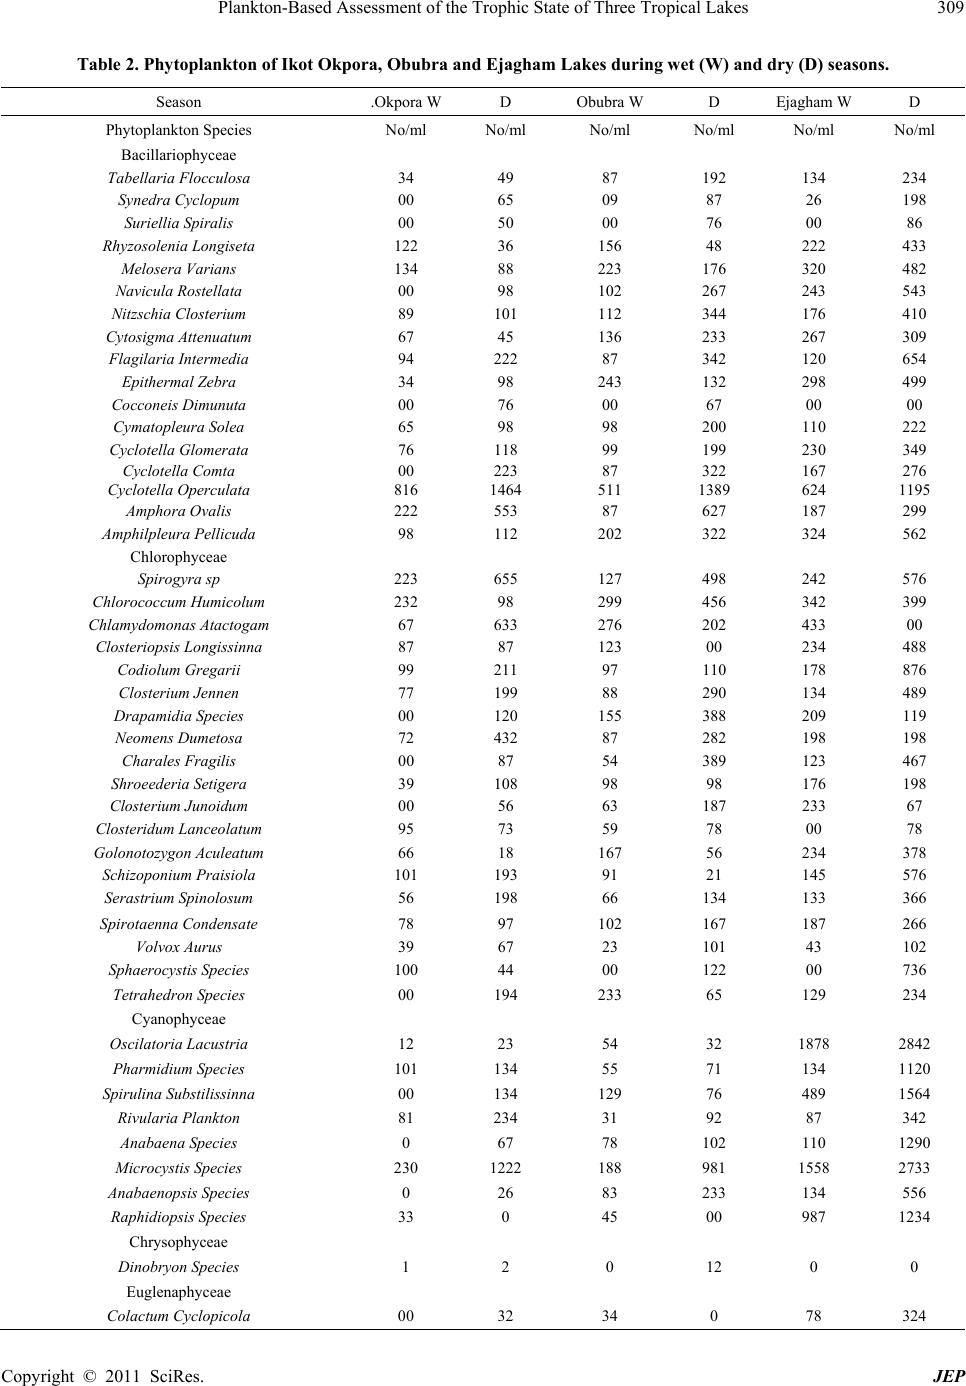 Plankton-Based Assessment of the Trophic State of Three Tropical Lakes 309 Table 2. Phytoplankton of Ikot Okpora, Obubra and Ejagham Lake s dur ing we t (W) and dr y (D) seasons. Season .Okpora WD Obubra W D Ejagham W D Phytoplankton Species No/ml No/ml No/ml No/ml No/ml No/ml Bacillariophyceae Tabellaria Flocculosa 34 49 87 192 134 234 Synedra Cyclopum 00 65 09 87 26 198 Suriellia Spiralis 00 50 00 76 00 86 Rhyzosolenia Longis e t a 122 36 156 48 222 433 Melosera Varians 134 88 223 176 320 482 Navicula Rostellata 00 98 102 267 243 543 Nitzschia Closterium 89 101 112 344 176 410 Cytosigma Attenuatum 67 45 136 233 267 309 Flagilaria Intermedia 94 222 87 342 120 654 Epithermal Zebra 34 98 243 132 298 499 Cocconeis Dimunuta 00 76 00 67 00 00 Cymatopleura Solea 65 98 98 200 110 222 Cyclotella Glomerata 76 118 99 199 230 349 Cyclotella Comta 00 223 87 322 167 276 Cyclotella Operculata 816 1464 511 1389 624 1195 Amphora Ovalis 222 553 87 627 187 299 Amphilpleura Pellicuda 98 112 202 322 324 562 Chlorophyceae Spirogyra sp 223 655 127 498 242 576 Chlorococcum Humicolum 232 98 299 456 342 399 Chlamydomonas Atactogam 67 633 276 202 433 00 Closteriopsis Longissinna 87 87 123 00 234 488 Codiolum Gregarii 99 211 97 110 178 876 Closterium Jennen 77 199 88 290 134 489 Drapamidia Species 00 120 155 388 209 119 Neomens Dumetosa 72 432 87 282 198 198 Charales Fragilis 00 87 54 389 123 467 Shroeederia Setigera 39 108 98 98 176 198 Closterium Junoidum 00 56 63 187 233 67 Closteridum Lanceolatu m 95 73 59 78 00 78 Golonotozygon Aculeatum 66 18 167 56 234 378 Schizoponium Praisiola 101 193 91 21 145 576 Serastrium Spinolosum 56 198 66 134 133 366 Spirotaenna Condensate 78 97 102 167 187 266 Volvox Aurus 39 67 23 101 43 102 Sphaerocystis Spe c ie s 100 44 00 122 00 736 Tetrahedron Species 00 194 233 65 129 234 Cyanophyceae Oscilatoria Lacustria 12 23 54 32 1878 2842 Pharmidium Species 101 134 55 71 134 1120 Spirulina Substilissinna 00 134 129 76 489 1564 Rivularia Plankton 81 234 31 92 87 342 Anabaena Species 0 67 78 102 110 1290 Microcystis Species 230 1222 188 981 1558 2733 Anabaenopsis Species 0 26 83 233 134 556 Raphidiopsis Speci es 33 0 45 00 987 1234 Chrysophyceae Dinobryon Species 1 2 0 12 0 0 Euglenaphyceae Colactum Cyclopicola 00 32 34 0 78 324 Copyright © 2011 SciRes. JEP 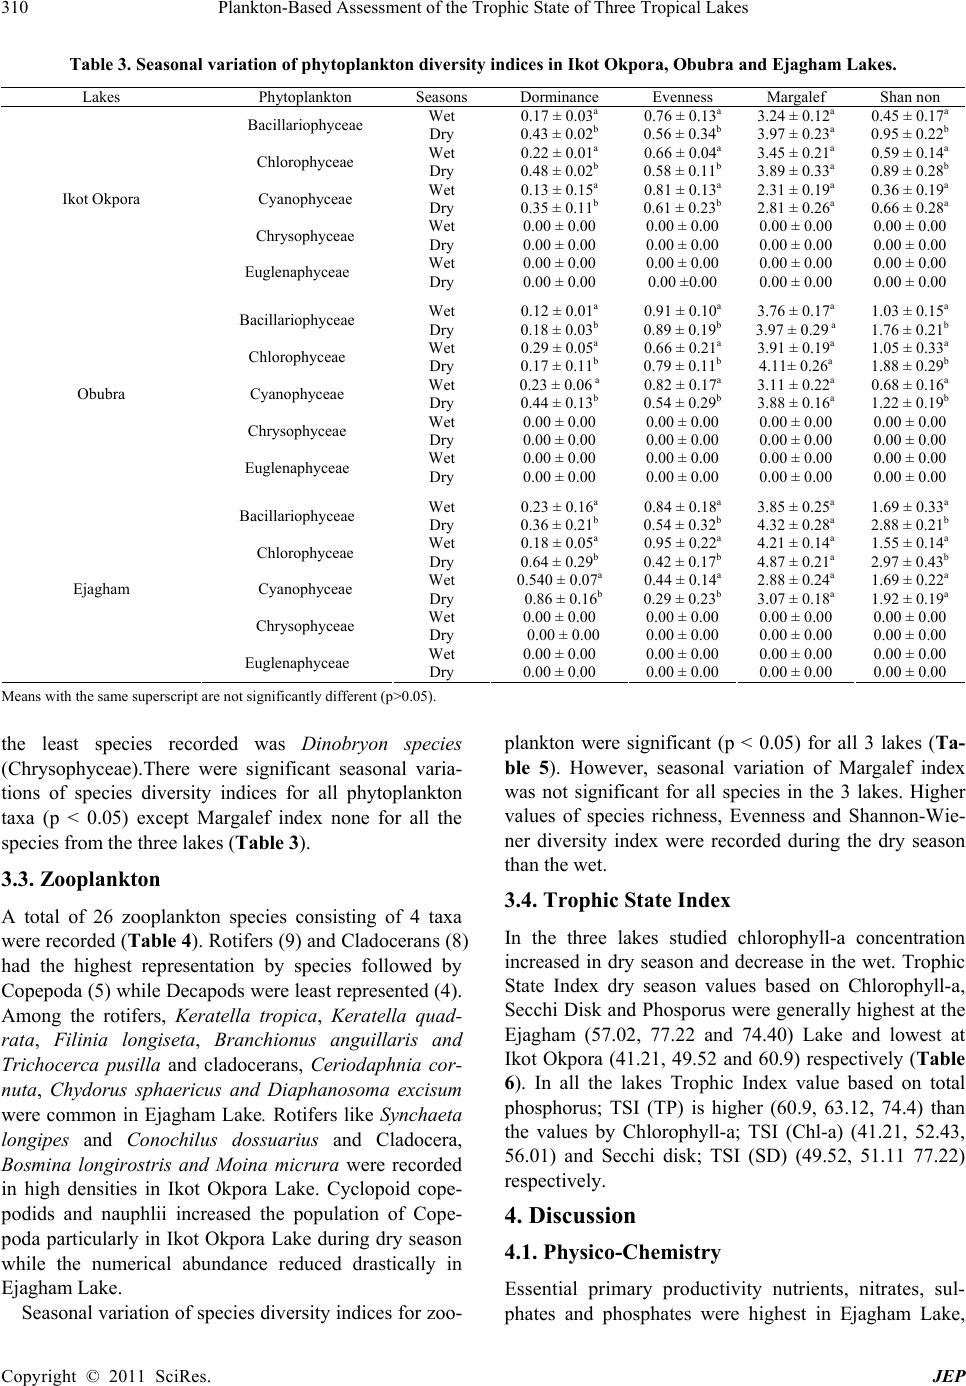 Plankton-Based Assessment of the Trophic State of Three Tropical Lakes Copyright © 2011 SciRes. JEP 310 Table 3. Seasonal variation of phytoplankton diversity indices in Ikot Okpora, Obubra and Ejagham Lakes. Lakes Phytoplankton Seasons Dorminance Evenness Margalef Shan non Bacillariophyceae Wet Dry 0.17 ± 0.03a 0.43 ± 0.02b 0.76 ± 0.13a 0.56 ± 0.34b 3.24 ± 0.12a 3.97 ± 0.23a 0.45 ± 0.17a 0.95 ± 0.22b Chlorophyceae Wet Dry 0.22 ± 0.01a 0.48 ± 0.02b 0.66 ± 0.04a 0.58 ± 0.11b 3.45 ± 0.21a 3.89 ± 0.33a 0.59 ± 0.14a 0.89 ± 0.28b Cyanophyceae Wet Dry 0.13 ± 0.15a 0.35 ± 0.11b 0.81 ± 0.13a 0.61 ± 0.23b 2.31 ± 0.19a 2.81 ± 0.26a 0.36 ± 0.19a 0.66 ± 0.28a Chrysophyceae Wet Dry 0.00 ± 0.00 0.00 ± 0.00 0.00 ± 0.00 0.00 ± 0.00 0.00 ± 0.00 0.00 ± 0.00 0.00 ± 0.00 0.00 ± 0.00 Ikot Okpora Euglenaphyceae Wet Dry 0.00 ± 0.00 0.00 ± 0.00 0.00 ± 0.00 0.00 ±0.00 0.00 ± 0.00 0.00 ± 0.00 0.00 ± 0.00 0.00 ± 0.00 Bacillariophyceae Wet Dry 0.12 ± 0.01a 0.18 ± 0.03b 0.91 ± 0.10a 0.89 ± 0.19b 3.76 ± 0.17a 3.97 ± 0.29 a 1.03 ± 0.15a 1.76 ± 0.21b Chlorophyceae Wet Dry 0.29 ± 0.05a 0.17 ± 0.11b 0.66 ± 0.21a 0.79 ± 0.11b 3.91 ± 0.19a 4.11± 0.26a 1.05 ± 0.33a 1.88 ± 0.29b Cyanophyceae Wet Dry 0.23 ± 0.06 a 0.44 ± 0.13b 0.82 ± 0.17a 0.54 ± 0.29b 3.11 ± 0.22a 3.88 ± 0.16a 0.68 ± 0.16a 1.22 ± 0.19b Chrysophyceae Wet Dry 0.00 ± 0.00 0.00 ± 0.00 0.00 ± 0.00 0.00 ± 0.00 0.00 ± 0.00 0.00 ± 0.00 0.00 ± 0.00 0.00 ± 0.00 Obubra Euglenaphyceae Wet Dry 0.00 ± 0.00 0.00 ± 0.00 0.00 ± 0.00 0.00 ± 0.00 0.00 ± 0.00 0.00 ± 0.00 0.00 ± 0.00 0.00 ± 0.00 Bacillariophyceae Wet Dry 0.23 ± 0.16a 0.36 ± 0.21b 0.84 ± 0.18a 0.54 ± 0.32b 3.85 ± 0.25a 4.32 ± 0.28a 1.69 ± 0.33a 2.88 ± 0.21b Chlorophyceae Wet Dry 0.18 ± 0.05a 0.64 ± 0.29b 0.95 ± 0.22a 0.42 ± 0.17b 4.21 ± 0.14a 4.87 ± 0.21a 1.55 ± 0.14a 2.97 ± 0.43b Cyanophyceae Wet Dry 0.540 ± 0.07a 0.86 ± 0.16b 0.44 ± 0.14a 0.29 ± 0.23b 2.88 ± 0.24a 3.07 ± 0.18a 1.69 ± 0.22a 1.92 ± 0.19a Chrysophyceae Wet Dry 0.00 ± 0.00 0.00 ± 0.00 0.00 ± 0.00 0.00 ± 0.00 0.00 ± 0.00 0.00 ± 0.00 0.00 ± 0.00 0.00 ± 0.00 Ejagham Euglenaphyceae Wet Dry 0.00 ± 0.00 0.00 ± 0.00 0.00 ± 0.00 0.00 ± 0.00 0.00 ± 0.00 0.00 ± 0.00 0.00 ± 0.00 0.00 ± 0.00 Means with the same superscript are not significantly different (p>0.05). the least species recorded was Dinobryon species (Chrysophyceae).There were significant seasonal varia- tions of species diversity indices for all phytoplankton taxa (p < 0.05) except Margalef index none for all the species from the three lakes (Table 3). 3.3. Zooplankton A total of 26 zooplankton species consisting of 4 taxa were recorded (Table 4). Rotifers (9) and Cladocerans (8) had the highest representation by species followed by Copepoda (5) while Decapods were least represented (4). Among the rotifers, Keratella tropica, Keratella quad- rata, Filinia longiseta, Branchionus anguillaris and Trichocerca pusilla and cladocerans, Ceriodaphnia cor- nuta, Chydorus sphaericus and Diaphanosoma excisum were common in Ejagham Lake. Rotifers like Synchaeta longipes and Conochilus dossuarius and Cladocera, Bosmina longirostris and Moina micrura were recorded in high densities in Ikot Okpora Lake. Cyclopoid cope- podids and nauphlii increased the population of Cope- poda particularly in Ikot Okpora Lake during dry season while the numerical abundance reduced drastically in Ejagham Lake. Seasonal variation of species diversity indices for zoo- plankton were significant (p < 0.05) for all 3 lakes (Ta- ble 5). However, seasonal variation of Margalef index was not significant for all species in the 3 lakes. Higher values of species richness, Evenness and Shannon-Wie- ner diversity index were recorded during the dry season than the wet. 3.4. Trophic State Index In the three lakes studied chlorophyll-a concentration increased in dry season and decrease in the wet. Trophic State Index dry season values based on Chlorophyll-a, Secchi Disk and Phosporus were generally highest at the Ejagham (57.02, 77.22 and 74.40) Lake and lowest at Ikot Okpora (41.21, 49.52 and 60.9) respectively (Table 6). In all the lakes Trophic Index value based on total phosphorus; TSI (TP) is higher (60.9, 63.12, 74.4) than the values by Chlorophyll-a; TSI (Chl-a) (41.21, 52.43, 56.01) and Secchi disk; TSI (SD) (49.52, 51.11 77.22) respectively. 4. Discussion 4.1. Physico-Chemistry Essential primary productivity nutrients, nitrates, sul- phates and phosphates were highest in Ejagham Lake, 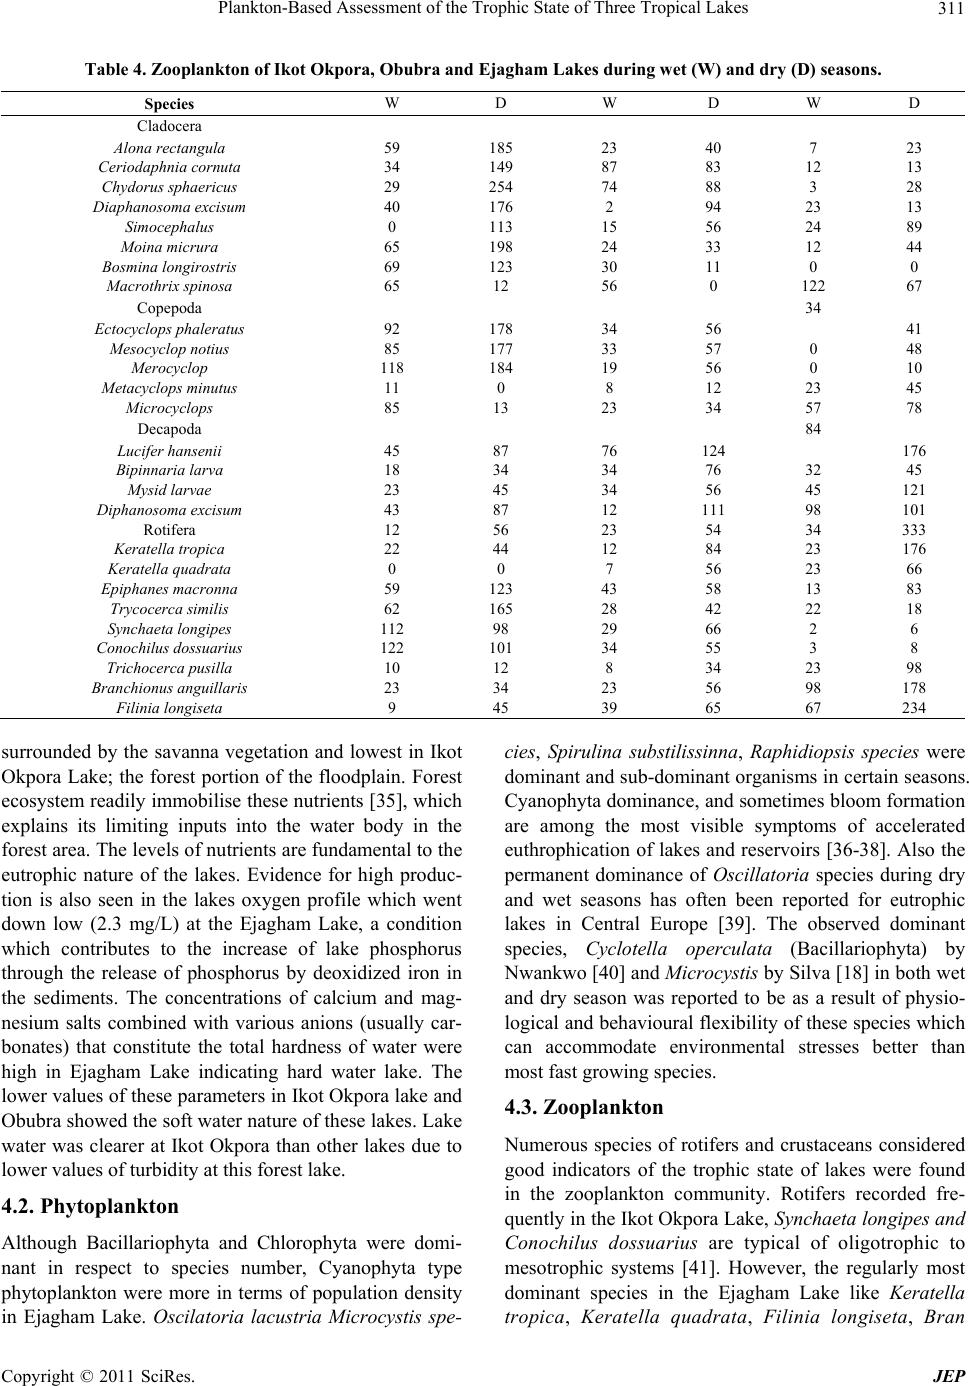 Plankton-Based Assessment of the Trophic State of Three Tropical Lakes 311 Table 4. Zooplankton of Ikot Okpora, Obubra and Ejagham Lakes during wet (W) and dry (D) seasons. Species W D W D W D Cladocera Alona rectangula 59 185 23 40 7 23 Ceriodaphnia cornuta 34 149 87 83 12 13 Chydorus sphaericus 29 254 74 88 3 28 Diaphanosoma excisu m 40 176 2 94 23 13 Simocephalus 0 113 15 56 24 89 Moina micrura 65 198 24 33 12 44 Bosmina longirostris 69 123 30 11 0 0 Macrothrix spinosa 65 12 56 0 122 67 Copepoda 34 Ectocyclops phaleratus 92 178 34 56 41 Mesocyclop notius 85 177 33 57 0 48 Merocyclop 118 184 19 56 0 10 Metacyclops minutus 11 0 8 12 23 45 Microcyclops 85 13 23 34 57 78 Decapoda 84 Lucifer hansenii 45 87 76 124 176 Bipinnaria larva 18 34 34 76 32 45 Mysid larvae 23 45 34 56 45 121 Diphanosoma excisum 43 87 12 111 98 101 Rotifera 12 56 23 54 34 333 Keratella tropica 22 44 12 84 23 176 Keratella quadrata 0 0 7 56 23 66 Epiphanes macronna 59 123 43 58 13 83 Trycocerca similis 62 165 28 42 22 18 Synchaeta longipes 112 98 29 66 2 6 Conochilus dossuarius 122 101 34 55 3 8 Trichocerca pusilla 10 12 8 34 23 98 Branchionus anguillar is 23 34 23 56 98 178 Filinia longiseta 9 45 39 65 67 234 surrounded by the savanna vegetation and lowest in Ikot Okpora Lake; the forest portion of the floodplain. Forest ecosystem readily immobilise these nutrients [35], which explains its limiting inputs into the water body in the forest area. The levels of nutrients are fundamental to the eutrophic nature of the lakes. Evidence for high produc- tion is also seen in the lakes oxygen profile which went down low (2.3 mg/L) at the Ejagham Lake, a condition which contributes to the increase of lake phosphorus through the release of phosphorus by deoxidized iron in the sediments. The concentrations of calcium and mag- nesium salts combined with various anions (usually car- bonates) that constitute the total hardness of water were high in Ejagham Lake indicating hard water lake. The lower values of these parameters in Ikot Okpora lake and Obubra showed the soft water nature of these lakes. Lake water was clearer at Ikot Okpora than other lakes due to lower values of turbidity at this forest lake. 4.2. Phytoplankton Although Bacillariophyta and Chlorophyta were domi- nant in respect to species number, Cyanophyta type phytoplankton were more in terms of population density in Ejagham Lake. Oscilatoria lacustria Microcystis spe- cies, Spirulina substilissinna, Raphidiopsis species were dominant and sub-dominant organisms in certain seasons. Cyanophyta dominance, and sometimes bloom formation are among the most visible symptoms of accelerated euthrophication of lakes and reservoirs [36-38]. Also the permanent dominance of Oscillatoria species during dry and wet seasons has often been reported for eutrophic lakes in Central Europe [39]. The observed dominant species, Cyclotella operculata (Bacillariophyta) by Nwankwo [40] and Microcystis by Silva [18] in both wet and dry season was reported to be as a result of physio- logical and behavioural flexibility of these species which can accommodate environmental stresses better than most fast growing species. 4.3. Zooplankton Numerous species of rotifers and crustaceans considered good indicators of the trophic state of lakes were found in the zooplankton community. Rotifers recorded fre- quently in the Ikot Okpora Lake, Synchaeta longipes and Conochilus dossuarius are typical of oligotrophic to mesotrophic systems [41]. However, the regularly most dominant species in the Ejagham Lake like Keratella tropica, Keratella quadrata, Filinia longiseta, Bran Copyright © 2011 SciRes. JEP  Plankton-Based Assessment of the Trophic State of Three Tropical Lakes 312 chionus anguillaris and Trichocerca pusilla are consid- ered indicators of advanced lake trophy [10]. The crus- tacean zooplankton community was made up of clado- cerans and copepods. Copepod abundance in Ikot Ok- pora and Obubra lakes was driven by the increase of Ec- tocyclops, Mesocyclops, merocyclops, Microcyclops which are indicative of higher water quality signifying oligotrophic status. Crustacean abundance increases only between mesotrophic and meso-eutrophic [42]. Also dominant cladocerans, Alona rectangular, Ceriodaphnia cornuta, Chydorus sphaericus, Diaphanosoma excisum, Simocephalus sp., Moina micrura and Bosmina longi- rostris represented in most samples in the Ikot Okpora Lake are well recorded by Sendacz et al. [43] and Swier- zowski et al. [44] in oligotrophic and mesooligotrophic systems. Generally increase in the abundance of zoo- plankton in the Ejagham Lake further confirms the eu- trophic status of the lake since zooplankton abundance increases with increasing nutrient concentration [14] and decreases with decreasing nutrient concentration. Table 5. Seasonal variation of zooplankton diversity indices in Ikot Okpora, Obubra and Ejagham Lakes. Lakes Zooplankton Seasons Dominance Evenness Margelef Shannon Wet Season 0.44 ± 0.07 a 0.56 ± 0.12a 3.56 ± 0.17a 0.55 ± 0.05a Cladocera Dry Season 0.29 ± 0.11b 0.96 ± 0.16b 4.87 ± 0.21a 0.73 ± 0.19b Wet Season 0.63 ± 0.09a 0.51 ± 0.07a 2.11 ± 0.15a 0.47 ± 0.18a Copepoda Dry Season 0.32 ± 0.22b 0.87 ± 0.10b 2.99 ± 0.03a 0.88 ± 0.14b Wet Season 0.58 ± 0.06a 0.44 ± 0.26a 1.68 ± 0.22a 0.23 ± 0.18a Decapoda Dry Season 0.20 ± 0.15b 0.79 ± 0.15b 1.94 ± 0.18a 0.44 ± 0.11b Wet Season 0.76 ± 0.23a 0.25 ± 0.08a 1.66 ± 0.11a 0.36 ± 0.26a Ikot Okpora Rotifera Dry Season 0.51 ± 0.22b 0.55 ± 0.01b 1.23 ± 0.20a 0.69 ± 0.18b Wet Season 0.75 ± 0.19a 0.25 ± 0.11a 4.81 ± 0.34a 0.45 ±0.08a Cladocera Dry Season 0.46 ± 0.12b 0.50 ± 0.02b 4.33 ± 0.16a 0.86 ± 0.43b Wet Season 0.955 ± 0.18a 0.11 ± 0.11a 3.22 ± 0.16a 0.42 ± 0.22a Copepoda Dry Season 0.57 ± 0.19b 0.43 ± 0.05b 3.89 ± 0.20a 0.87 ± 0.43b Wet Season 0.64 ± 0.10a 0.41 ± 0.19a 2.20 ± 0.14a 0.46 ± 0.17a Decapoda Dry Season 0.35 ± 0.08b 0.88 ± 0.16b 2.88 ± 0.10a 0.75 ± 0.21b Wet Season 0.75 ± 0.12a 0.64 ± 0.13a 1.58 ± 0.28a 0.48 ± 0.11a Obubra Rotifera Dry Season 0.39 ± 0.11b 0.30 ± 0.22b 1.68 ± 0.18a 0.88 ± 0.27b Wet Season 0.86 ± 0.22a 0.24 ± 0.12a 5.34 ± 0.21a 0.87 ± 0.13a Cladocera Dry Season 0.47 ± 0.13b 0.55 ± 0.11b 4.99 ± 0.31a 0.48 ± 0.11b Wet Season 0.86 ± 0.10a 0.242 ± 0.15a 4.34 ± 0.24a 0.59 ± 0.22a Copepoda Dry Season 0.45 ± 0.25b 0.64 ± 0.14b 4.33 ± 0.3a 0.97 ± 0.33b Wet Season 0.75 ± 0.15a 0.22 ± 0.19a 3.12 ± 0.22a 0.46 ± 0.13a Decapoda Dry Season 0.32 ± 0.12b 0.52 ± 0.08b 3.55 ± 0.12a 0.86 ± 0.32b Wet Season 0.82 ± 0.18a 0.20 ± 0.18a 1.88 ± 0.32a 0.52 ± 0.21a Ejagham Rotifera Dry Season 0.54 ± 0.21b 0.50 ± 0.16b 2.44 ± 0.21a 0.97 ± 0.17b Table 6. Trophic state index due to chlorophyl-a, se cchi disk and total phosphorus. Mean Values Trophic Points Classification Lakes Parameter W D W D W D Chlorophyll-a (µg/L) 1.77 2.54 31.11 41.21 Oligotrophy Mesotrophy Secchi Disk (m) 2.16 1.17 34.23 45.52 Mesotrophy Mesotrophy Ikot Okpora Total Phosphorus (µg/L) 0.05 0.18 51.25 60.9 Eutrophy Eutrophy Chlorophyll-a (µg/L) 2.24 2.89 42.31 52.43 Mesotrophy Eutrophy Secchi Disk (m) 2.85 1.78 42.27 51.11 Mesotrophy Eutrophy Obubra Total Phosphorus (µg/L) 0.05 0.06 57.34 63.12 Eutrophy Eutrophy Chlorophyll-a (µg/L) 3.42 4.08 50.78 57.02 Eutrophy Eutrophy Secchi Disk (m) 1.34 0.95 54.3 77.22 Hypereutrophy Eutrophy Ejagham Total Phosphorus (µg/L) 0.09 0.11 70.21 74.4 Hypereutrophy Hypereutrophy Copyright © 2011 SciRes. JEP  Plankton-Based Assessment of the Trophic State of Three Tropical Lakes 313 4.4. Diversity Species diversity measured by Shannon Weaner index is directly proportional to the number of species in the sample and the uniformity of the species distribution in the total abundance [45]. In the three lakes species diver- sity was relatively high, which indicates good environ- mental conditions conducive to the development of many species, and according to Kajak [46] - moderate trophy of waters. It was only in wet season samples that values were much lower which was reflected by the lowest re- corded number of species in the zooplankton community [47] as well as by the domination of single species, ac- companied by low proportions of other taxa. This indi- cated poor lake conditions. This hypothesis that decrease in lake condition followed by community structure sim- plification was also confirmed by Rogozin [48]. 4.5. Trophic State Index (Tsi) Chlorophyll-a is used by all phytoplankton to capture sunlight for photosynthesis. Chlorophyll (Chl-a) concen- tration is a uniquely algal trait of the water column and function as a reliable measure of phytoplankton biomass [49]. Secchi depth is generally a good indicator of chlo- rophyll-a concentration and reported to be negatively related to chlorophyll-a concentration [50]. In Ejagham Lake, when minimum Secchi depth was observed, the highest chlorophyll-a value was recorded. However sec- chi disk visibility may not always be acceptable as an index of high productivity as some regions are affected by non-algal turbidity. In Ejagham and Obubra lakes, TSI (Chl-a) was found to be 70.02 and 52.43 respectively while TSI (SD) was 57.22 and 51.11 respectively and TSI value greater than 50 is usually associated with eu- tophy or high productivity [5]. For lakes that have a few rooted aquatic plants and little non-algal turbidity, the TSI (SD) and TSI (Chl-a) are approximately the same [6] as was observed in the Ikot Okpora and Obubra Lakes. Therefore, TSI (SD) is only useful to those lakes where turbidity is as a result of algal biomass [51]. In this study non algal turbidity was observed in Ejagham lake where the TSI (SD) was highest. Many factors are known to influence Secchi depth. The most important factors in- clude primary production, the amount of resuspended material and the amount of coloured matter in the lake. Secchi depth do not depend solely on autochthonous lake production but also very much on allochthonous influ- ences and resuspension [5]. So it is not correct to classify Ejagham lake as hypereutrophic on basis of secchi depth measurements. Same difference between TSI (SD) and TSI (Chl) values has been found for Sri Lankan reser- voirs [52] and TSI (Chl) has been found to be a reliable means for quantifying trophic state at least for fisheries management purposes. Lake Ejagham can be character- ized as eutrophic during both seasons on the basis of Chlorophyll-a concentration while Obubra Lake is eu- trophic and mesotrophic during dry and wet seasons re- spectively. The Ikot Okpora Lake, however, show mesotrophic and oligotrophic characteristics in dry and wet seasons respectively. Oligotrophic lake generally host very little or no vegetation and is relatively clear while eutrophic lakes tend to host large quantities of or- ganisms, including algal bloom. Each trophic class sup- ports different types of fish and other organisms. If the algal biomass in a lake reaches very high level (> 80) fish kills occur as decomposing biomass deoxygenate the water. A lake situated in nutrient rich area may be natu- rally eutrophic. Nutrients carried into water bodies from non-point sources such as agricultural run-offs, residen- tial fertilizers and sewage, will all increase biomass and can cause oligotrophic lake to become hypereutrophic. The three lakes are at different stages of development and are influenced by season and location. Lake located at the savannah area of the floodplain eutrophies faster than lake at the forest section due to higher intensity of direct sunlight penetration and temperatures which in- creases photosynthesis and biodegradation respectively, in the former. The forest helps limit eutrophication due to the absence of anthropogenic inputs. The dry season trophic state of the tropical lakes seems to be more ad- vanced because of the dilution factor by rain water. Lake Ikot Okpora may be recommended for an unfiltered wa- ter supply particularly during the wet season and is suit- able for fisheries and recreation in all seasons. Obubra Lake may be suitable for fisheries but dominated mostly by tolerant species, Clariidae and Cichlidae families during the wet season while Ejagham Lake maybe have very few tolerant fish species and not suitable for recrea- tion. REFERENCES [1] S. Kroeger, E. Fensin, K. Lynch and M. V. Borgh, “United State Water Programs that Use Algae as Bio- logical Assessment Tool,” Technical Guidance Document: EPA 007-841, 1999. [2] D. F. Westlake, “The Functioning of the Freshwater Ecosystem,” International Biological Programme, Cam- bridge University Press, London, Vol. 122, 2003, pp. 423-442. [3] A. Payne, “Ecology of Tropical Lakes and Rivers,” John Wiley and Sons, New York, 1986. [4] G. M. Sechi and A. Sulis, “Multi-Reservoir System Op- timization Using Chlorophyll-A Trophic Indexes,” Water Resources Managemnet, Vol. 21, No. 5, 2007, pp. 849-860. doi:10.1007/s11269-006-9114-3 [5] L. Håkanson and V. V. Boulion, “Regularities in Primary Copyright © 2011 SciRes. JEP  Plankton-Based Assessment of the Trophic State of Three Tropical Lakes 314 Production, Secchi Depth and Fish Yield and a New Sys- tem to Define Trophic and Humic State Indices for Lake Ecosystems,” International Review Hydrobiology, Vol. 86, 2001, pp. 23-62. doi:10.1002/1522-2632(200101)86:1<23::AID-IROH23> 3.0.CO;2-4 [6] R. E. Carlson and J. Simpson, “A Coordinator’s Guide to Volunteer Lake Monitoring Methods,” North American Lake Management Society, Madison, 1996. [7] L. Sifa and X. Senlin, “Culture and Capture of Fish in Chinese Reservoirs,” IDRC, Ottawa, 1995. [8] D. G. Frey, “Wisconsin: Birge-Juday Era,” In: D. G. Frey Ed., Limnology in North America, The University of Wisconsin Press, Madison, 1963. [9] S. D. Peckham, J. W. Chipman, T. M. Lillesand and S. I. Dodson, “Alternate Stable States and the Shape of the Lake Trophic Distribution,” Hydrobiologia, Vol. 571, No. 1, 2006, pp. 401-407. doi:10.1007/s10750-006-0221-1 [10] I. C. Duggan, J. D. Green and R. J. Shiel, “Distribution of Rotifers in North Island, New Zealand, and Their Poten- tial Use as Bioindicators of Lake Trophic State,” Hydro- biologia, Vol. 446-447, No. 1, 2003, pp. 155-157. [11] S. Guess, D. Albrecht, H. J. Krambeck, D. C. Muel- ler-Navarra and H. Mumm, “Impact of Weather on Lake Ecosystem, Assessed by Cyclo-Stationary MCCA of Long-Term Observations,” Ecology, Vol. 81, No. 6, 2003, pp. 1720-1730. [12] K. O. Coyle and A. I. Pinchuk, “Climate-Related Differ- ences in Zooplankton Density and Growth on the Inner Shelf of the South-Eastern Bering Sea,” Progress in Oceanography, Vol. 55, No. 1-2, 2002, pp. 177-179. doi:10.1016/S0079-6611(02)00077-0 [13] A. Hobaek, M. Manca and T. Anderson, “Factors Influ- encing Species Richness Lacustrine Zooplankton,” Acta Oecologica, Vol. 23, No. 3, 2002, pp. 155-165. doi:10.1016/S1146-609X(02)01147-5 [14] G. Balvay, “Evolution du Zooplacton du Leman,” Cam- pagne 1999, Rapp. Comm. int. prot. Eaux. Leman conte pollut (CIPEL), 2000. [15] M. G. Nogueira, “Phytoplankton Composition, Domi- nance and Abundance as Indicators of Environmental Compartmentalization in Jurumirim Reservoir (Parana- panema River),” Hydrobiologia, São Paulo, Vol. 431, No. 2-3, 2000, pp. 115-128. doi:10.1023/A:1003769408757 [16] C. C. Figueredo and A. Giani, “Seasonal Variation in the Diversity and Species Richness of Phytoplankton in a Tropical Eutrophic Reservoir,” Hydrobiologia, Vol. 445, No. 3, 2001, pp. 165-174. doi:10.1023/A:1017513731393 [17] C. S. Pedrozo and O. Rocha, “Zooplankton and Water Quality of Lakes of the Northern Coast of Rio Grande Do Sul State, Brazil,” Acta Limnologica Brasiliensia, Vol. 17, No. 4, 2005, pp. 445-459. [18] E. I. L. Silva, “Ecology of Phytoplankton in Tropical Waters: Introduction to the Topic and Ecosystem Changes from Sri Lanka,” Asian Journal of Water Envi- ronmental Pollution, Vol. 4, No. 1, 2005, pp. 25-35. [19] D. Zorka, V. Mitrovic-Tutundzic, Z. Markovic and I. Zivic, “Monitoring Water Quality Using Zooplankton Organisms as Bioindicators at the Dubica Fish Farm, Serbia,” Archives of Biological Sciences, Vol. 58, No. 4, 2006, pp. 245-248. doi:10.2298/ABS0604245D [20] B. O. Offem and E. O. Ayotunde, “Toxicity of Lead to Freshwater Invertebrates. Waterfleas; Daphnia magna and Cyclop sp) in Fish Ponds in a Tropical Floodplain,” Water Air Soil Pollution, Vol. 192, No. 1-4, 2008, pp. 39-46. doi:10.1007/s11270-008-9632-0 [21] B. O. Offem, Y. Akegbejo-Samsons, I. T. Omoniyi and G. U. Ikpi, “Dynamics of the Limnological Features and Diversity of Zooplankton Populations of the Cross River System SE Nigeria,” Knowledge and Management of Aquatic Ecosystems, Vol. 393, No. 2, 2009, pp. 2-19. doi:10.1051/kmae/2009013 [22] U. I. Enin, “The Artisanal Shrimp Fishery of the Outer Cross River Estuary, Nigeria,” Ph. D. Thesis, University of Calabar, Calabar, 1994. [23] H. I. Golterman, “Methods for Chemical Analysis of Freshwater,” International Biological Programme, Hand- book & Oxford, Blackwell Scientific Publications, Ox- ford, 1969. [24] American Public Health Association (APHA), “Standard Methods for the Examination of Water and Waste Wa- ter,” 20th Edition, Washington DC, 1998. [25] G. W. Prescott, “Algae of the Western Great Lakes Area,” Brown Publishers, Dubuque, 1951. [26] W. T. Edmondson, “Fresh Water Biology,” 2nd Edition, John Wiley & Sons Inc., New York, 1959. [27] D. M. John, B. A. Whitton and A. J. Brook, “The Fresh- water Algal Flora of the British Isles: An Identification Guide to Freshwater and Terrestrial Algae,” 1st Edition, Cambridge University Press, Cambridge, 2002. [28] R. A. Vollenweider, “A Manual on Methods for Measur- ing Primary Production in Aquatic Environments,” 2nd Edition, Blackwell Scientific Publications, Oxford, 1974. [29] C. E. Boyd, “Water Quality in Warm Water Fish Ponds,” Auburn University Publishers, Auburn, 1981. [30] M. O. Kadiri, “Seasonal Changes in the Phytoplankton Biomass of Shallow Tropical Reservoir, Nigeria,” Jour- nal of Botany, Vol. 6, 1988, pp. 167-173. [31] E. C. Kemdirim, “Checklist of Phytoplankton of Shedam Reservoir in Plateau State, Nigeria,” Journal of Aquatic Sciences, Vol. 16, 2001, pp. 61-66. [32] E. R. Akpan and J. O. Offem, “Seasonal Variation in the Water Quality of Cross River, Nigeria,” Hydrobiologia, Vol. 26, No. 2, 1993, pp. 95-98. [33] A. E. Magurran, “Ecological Diversity and Its Measure- ment,” Cambridge University Press, Cambridge, 1988. [34] J. H. Zar, “Biostatistical Analysis,” Pretice-Hall Interna- tional, London, 1984. [35] J. A. Downing and E. Mccauley, “The Nitrogen: Phos- phorus Relationship in Lakes,” Limnology Oceangraphy, Vol. 37, 1992. pp. 936-977. doi:10.4319/lo.1992.37.5.0936 Copyright © 2011 SciRes. JEP  Plankton-Based Assessment of the Trophic State of Three Tropical Lakes Copyright © 2011 SciRes. JEP 315 [36] B. Moss, J. Madgwick and G. Phillips, “A Guide to the Restoration of Nutrients-Enrich Shallow Lakes,” W. W. Hawes, Suffolk, 1997. [37] J. Padisak and C. S. Reynolds, “Selection of Phytoplank- ton Associations in Lake Balaton, Hungary in Response to Eutrophication and Restoration Measures, with Special Reference to the Cyanoprokaryotes,” Hydrobiologia, Vol. 384, 1998, pp. 41-53. doi:10.1023/A:1003255529403 [38] M. P. Stoyneva, “Steady-State Phytoplankton Assem- blage in Shallow Bulgarian Wetlands,” Hydrobiologia, Vol. 502, No. 1-3, 2003, pp. 169-177. doi:10.1023/B:HYDR.0000004279.59719.7e [39] C. Berger and H. E. Sweers, “Ijsselmeer and Its Phyto- plankton with Special Attention to the Suitability of the Lake as a Habitat for Oscillatoria Agardhii Gom,” Jour- nal of Plankton Research, Vol. 10, No. 4, 1988, pp. 579-586. doi:10.1093/plankt/10.4.579 [40] D. I. Nwankwo, K. Onyema and T. A. Adesah, “A Sur- vey of Harmful Algae in Coastal Waters of South West- ern Nigeria,” Journal of Nigerian Environmental Society, Vol. 1, No. 2, 2003, pp. 241-246. [41] J. Hall, J. B. Catharine and W. Carolyn, “Environmental Gradient and Zooplankton Distribution, in a Shallow, Tidal Lake,” Archives of Hydrobiologia, Vol. 154, No. 3, 2002, pp. 485-490. [42] A. Karabin, “Pelagic Zooplankton (Rotatoria and Crusta- cea) Variation in the Process of Lake Eutrophication. II. Modifying Effect of Biotic Agents,” Polish Journal of Ecology, Vol. 33, No. 4, 1985b, pp. 567-589. [43] S. Sendacz, E. Kubo and M. A. Cestarolli, “Limnologia de Reservatios do Estado do Sao Paulo, Brasil, VIII Zoo- plankton,” Boletim do Instituto de Saúde, Vol. 12, 1985, pp. 145-176 [44] A. Swierzoski, M. Godlewska and T. Poltorak, “The Re- lationship between the Spatial Distribution of Fish, Zoo- plankton and Other Environmental Parameters in the Solina Reservoir, Poland,” Aquatic Living Resources, Vol. 13, 2000, pp. 373-387. doi:10.1016/S0990-7440(00)01085-8 [45] C. J. Krebs, “Ecology: The Experimental Analysis of Distribution and Abundance,” Harper Intel, Lectual Edi- tion, New York, 1996. [46] Z. Kajak, “Ecological Characteristics of Lakes in North-Eastern Poland versus Their Trophic Gradient,” Polish Journal of Ecology, Vol. 31, 1983, pp. 495-510. [47] K. Irvine, M. T. Bales, B. Moss, J. H. Stanfield and D. Snook, “Trophic Relations in Hickling Broad—A Shal- low and Brackish Eutrophic Lake,” Verhandlungen des Internationalen Verein Limnologie, Vol. 24, 1990, pp. 576-587. [48] A. G. Rogozin, “Specific Structural Features of Zoo- plankton in Lakes Differing in Trophic Status: Species Population,” Ekologia, Moscow, Vol. 6, 2000, pp. 438-455. [49] M. J. Behrenfeld and E. Boss, “Beam Attenuation and Chlorophyll Concentration as Alternative Optical Indices of Phytoplankton Biomass,” Journal of Marine Research, Vol. 64, 2006, pp. 431-451. doi:10.1357/002224006778189563 [50] G. Almazan and C. E. Boyd, “An Evaluation of Secchi Disk Visibility for Estimating Plankton Density in Fish Ponds,” Hydrobiologia, Vol. 61, No. 3, 1978, pp. 601- 608. doi:10.1007/BF00044446 [51] U. A. D. Jayasinghe, U. S. Amarasinghe and S. S. De Silva, “Trophic Classification of Non-Perennial Reser- voirs Utilized for the Development of Culture-Based Fisheries, Sri Lanka,” International Review of Hydro- biology, Vol. 90, No. 2, 2005, pp. 209-222. doi:10.1002/iroh.200410753 [52] F. Dominique, G. Hans, L. Malgorzata, C. Lawrence and K. Andoline, “Integrated Water Resource Management for Important Deep European Lakes and Their Catchment Areas,” Eurolakes, Vol. 36, 2003, pp. 56-67.
|