Paper Menu >>
Journal Menu >>
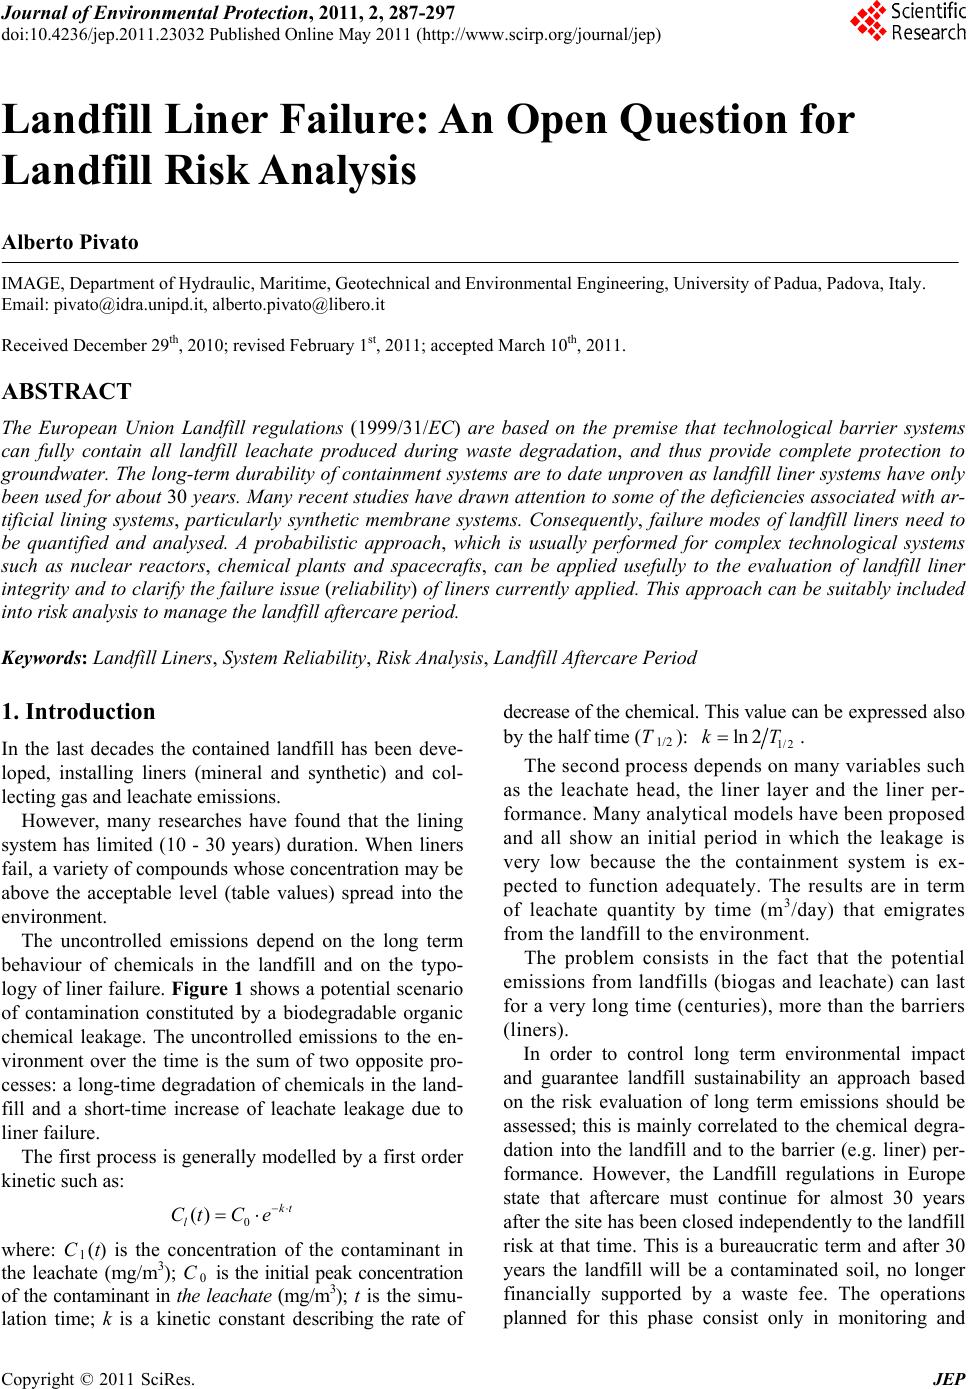 Journal of Environmental Protection, 2011, 2, 287-297 doi:10.4236/jep.2011.23032 Published Online May 2011 (http://www.scirp.org/journal/jep) Copyright © 2011 SciRes. JEP 287 Landfill Liner Failure: An Open Question for Landfill Risk Analysis Alberto Pivato IMAGE, Department of Hydraulic, Maritime, Geotechnical and Environmental Engineering, University of Padua, Padova, Italy. Email: pivato@idra.unipd.it, alberto.pivato@libero.it Received December 29th, 2010; revised February 1st, 2011; accepted March 10th, 2011. ABSTRACT The European Union Landfill regulations (1999 /31/EC) are based on the premise that technological barrier systems can fully contain all landfill leachate produced during waste degradation, and thus provide complete protection to groundwater. The long-term durability of containment systems are to da te unproven as landfill liner systems have only been used for about 30 years. Many recent studies have drawn attention to some of the deficiencies associated with ar- tificial lining systems, particularly synthetic membrane systems. Consequently, failure modes of landfill liners need to be quantified and analysed. A probabilistic approach, which is usually performed for complex technological systems such as nuclear reactors, chemical plants and spacecrafts, can be applied usefully to the evaluation of landfill liner integrity and to cla rify the failure issue (reliability) of liners currently applied. This approach can be suitably included into risk analysis to manage the landfill aftercare period. Keywords: Landfill Liners, System Reliability, Risk Analysis, Landfill Aftercare Period 1. Introduction In the last decades the contained landfill has been deve- loped, installing liners (mineral and synthetic) and col- lecting gas and leachate emissions. However, many researches have found that the lining system has limited (10 - 30 years) duration. When liners fail, a variety of compounds whose concentration may be above the acceptable level (table values) spread into the environment. The uncontrolled emissions depend on the long term behaviour of chemicals in the landfill and on the typo- logy of liner failure. Figure 1 shows a potential scenario of contamination constituted by a biodegradable organic chemical leakage. The uncontrolled emissions to the en- vironment over the time is the sum of two opposite pro- cesses: a long-time degradation of chemicals in the land- fill and a short-time increase of leachate leakage due to liner failure. The first process is generally modelled by a first order kinetic such as: 0 () kt l CtC e where: Cl(t) is the concentration of the contaminant in the leachate (mg/m3); C0 is the initial peak concentration of the contaminant in the leachate (mg/m3); t is the simu- lation time; k is a kinetic constant describing the rate of decrease of the chemical. This value can be expressed also by the half time (T1/2 ): 1/2 ln 2kT . The second process depends on many variables such as the leachate head, the liner layer and the liner per- formance. Many analytical models have been proposed and all show an initial period in which the leakage is very low because the the containment system is ex- pected to function adequately. The results are in term of leachate quantity by time (m3/day) that emigrates from the landfill to the environment. The problem consists in the fact that the potential emissions from landfills (biogas and leachate) can last for a very long time (centuries), more than the barriers (liners). In order to control long term environmental impact and guarantee landfill sustainability an approach based on the risk evaluation of long term emissions should be assessed; this is mainly correlated to the chemical degra- dation into the landfill and to the barrier (e.g. liner) per- formance. However, the Landfill regulations in Europe state that aftercare must continue for almost 30 years after the site has been closed independently to the landfill risk at that time. This is a bureaucratic term and after 30 years the landfill will be a contaminated soil, no longer financially supported by a waste fee. The operations lanned for this phase consist only in monitoring and p 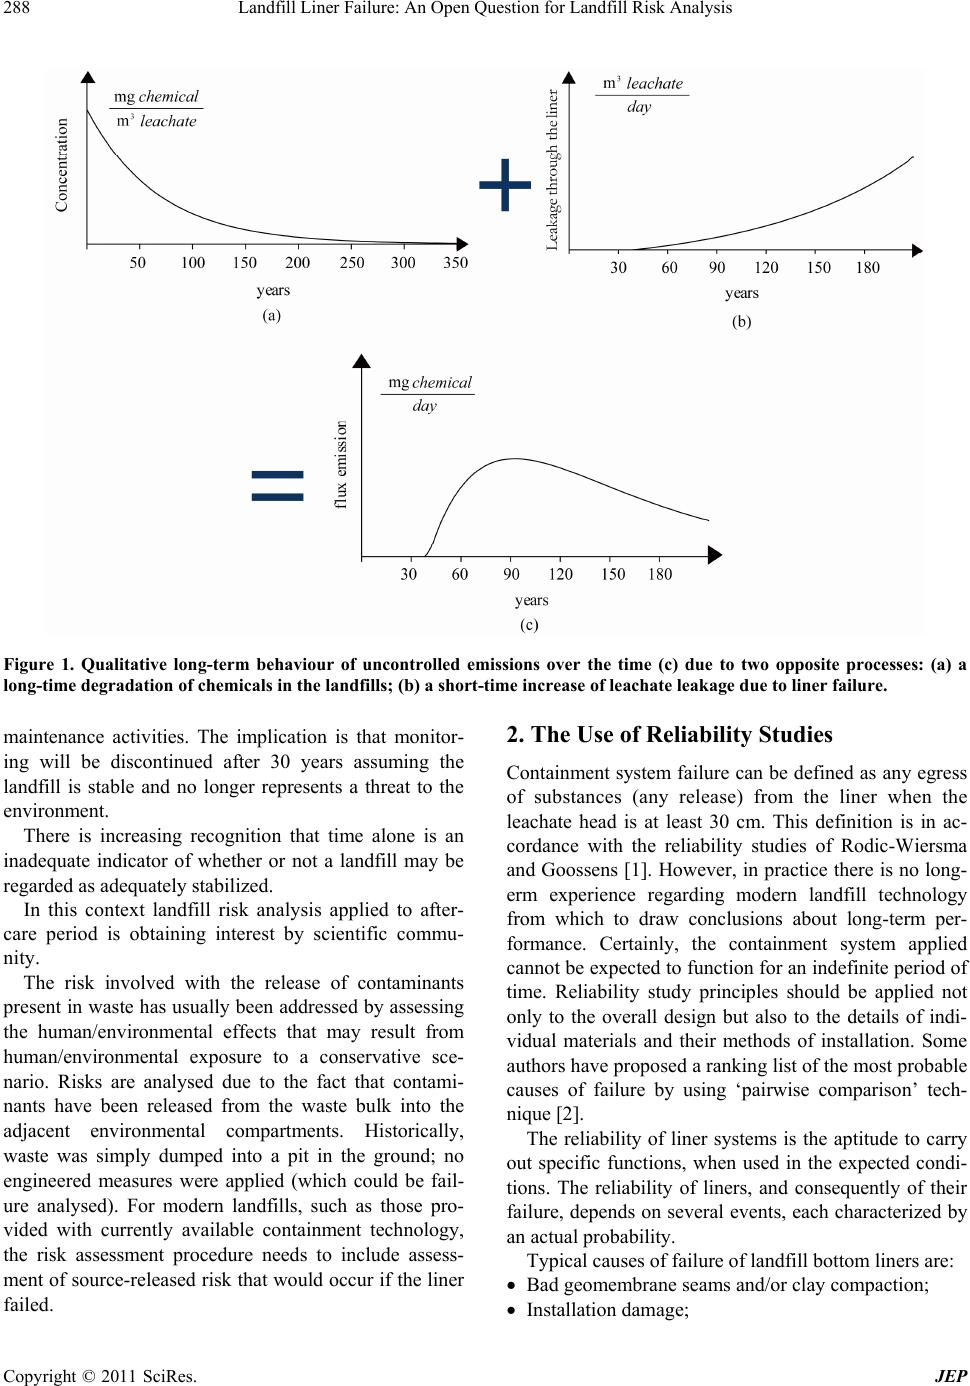 Landfill Liner Failure: An Open Question for Landfill Risk Analysis 288 Figure 1. Qualitative long-term behaviour of uncontrolled emissions over the time (c) due to two opposite processes: (a) a long-time degradation of chemicals in the landfills; (b) a short-time increase of leachate leakage due to liner failure. maintenance activities. The implication is that monitor- ing will be discontinued after 30 years assuming the landfill is stable and no longer represents a threat to the environment. There is increasing recognition that time alone is an inadequate indicator of whether or not a landfill may be regarded as adequately stabilized. In this context landfill risk analysis applied to after- care period is obtaining interest by scientific commu- nity. The risk involved with the release of contaminants present in waste has usually been addressed by assessing the human/environmental effects that may result from human/environmental exposure to a conservative sce- nario. Risks are analysed due to the fact that contami- nants have been released from the waste bulk into the adjacent environmental compartments. Historically, waste was simply dumped into a pit in the ground; no engineered measures were applied (which could be fail- ure analysed). For modern landfills, such as those pro- vided with currently available containment technology, the risk assessment procedure needs to include assess- ment of source-released risk that would occur if the liner failed. 2. The Use of Reliability Studies Containment system failure can be defined as any egress of substances (any release) from the liner when the leachate head is at least 30 cm. This definition is in ac- cordance with the reliability studies of Rodic-Wiersma and Goossens [1]. However, in practice there is no long- erm experience regarding modern landfill technology from which to draw conclusions about long-term per- formance. Certainly, the containment system applied cannot be expected to function for an indefinite period of time. Reliability study principles should be applied not only to the overall design but also to the details of indi- vidual materials and their methods of installation. Some authors have proposed a ranking list of the most probable causes of failure by using ‘pairwise comparison’ tech- nique [2]. The reliability of liner systems is the aptitude to carry out specific functions, when used in the expected condi- tions. The reliability of liners, and consequently of their failure, depends on several events, each characterized by an actual probability. Typical causes of failure of landfill bottom liners are: Bad geomembrane seams and/or clay compaction; Installation damage; Copyright © 2011 SciRes. JEP  Landfill Liner Failure: An Open Question for Landfill Risk Analysis289 Not safeguarding liner in operation; Pipes penetrating liner; Clogging of the leachate collection and removal sys- tem; Geotechnical failure; Unanticipated chemical attack; Breach by vertical pipes. The reliability evaluation can be carried out with two different approaches. The first is deductive analysis, which analyses a series of similar historical failure events. A considerable amount of information on different installations should be collected and divided into the better comparable categories according to the characteristic elements. For example, a landfill with only a clay liner on the bottom should be included in the group that contains the same containment system. Once the reliability for a set of landfills with similar features has been estimated, a sta- tistical estimator can be defined and extended to the whole group. The comparison is always subject to approximation, due to the diversification of the boundary conditions: the geology of the sites, the environmental conditions, the design and the materials, etc. In a comprehensive evalua- tion, it is also important to consider the analogies in the different working conditions. These precautions are needed in order to develop a statistical study that pro- duces results consistent with the aforementioned reliabi- lity definition as well as reduce the inevitable approxi- mations and uncertainties in this type of comparison. A more adaptable and reliable method is predictive analysis. This analysis entails knowledge of failure probability of the individual elements (subsystems) and combines them with an appropriate probabilistic analysis to define the reliability of a more complex system. A standardized procedure is “Fault Free” analysis, which is used in the Netherlands and in other countries to predict the aftercare period cost [3]. Aftercare period costs are the ones connected to the operations planned for this phases and consist only in monitoring and maintenance activities: Cap maintenance and monitoring; Leachate recirculation operation and maintenance (where permitted!); Leachate collection system operation and mainte- nance; Landfill gas collection 80 03 。 ' system maintenance and monitoring; Landfill gas migration control and monitoring; Groundwater and surface water monitoring; Security and grounds maintenance. The leakage of a bottom liner, i.e. the failure of the barrier, is caused by one or a set of system compo- nents generating failure events. The environment, plant personnel, aging of materials etc. can influence the system only through its components. As proposed by Henley and Kumamaoto [4] we distinguish dif- ferent component failures: A primary failure is defined as the component being in the non-working state for which the component is held accountable. A primary failure occurs under in- puts within the design envelope, and component natural aging is responsible for such failure. Among other aspects, the aging of the components in the liner depends on the chemical composition of the leachate and on the high temperature due to the exothermic reactions inside the landfill. A secondary failure is the same as a primary failure except that the component is not held accountable for the failure. Past or present excessive stresses placed on the component are responsible for secondary fail- ure. Examples are environmental stresses (geological assessment, uncontrolled groundwater infiltration, high leachate head, etc.), human error such as if per- sonals break the components (installation damage, bad compaction of clay liner, etc.). A command fault is defined as the component being in the non-working state due to improper control sig- nal or noise (failure of pump signal to extract leachate, etc). This subdivision is essential in order to properly collect failure data for reliability studies. In the present work, basic events related to system com- ponents with binary states, i.e., normal state and failed state will be quantified first. The quantification is then extended to components having plural failure modes. 3. Single Failure Mode Analysis We assume that at any given time a liner system is ei- ther functioning normally or failed, and that the com- ponent state changes as time evolves (Figure 2). It is assumed that the component changes its state instanta- neously when the normal to failed transition takes place. The transition to the failed state is failure and the failed state continues forever if the component is non-repair- able (as generally is the case of a landfill liner). The time failure is defined as the interval of time be- tween the moment the barrier system is put into opera- tion (including all the elements composing it) and its failure. This interval is generally a stochastic variable (x 0). The distribution () F tP tx is the probability that the system fails prior to time t, assuming that the system has been in function since t = 0. The system reli- ability is expressed by: Copyright © 2011 SciRes. JEP 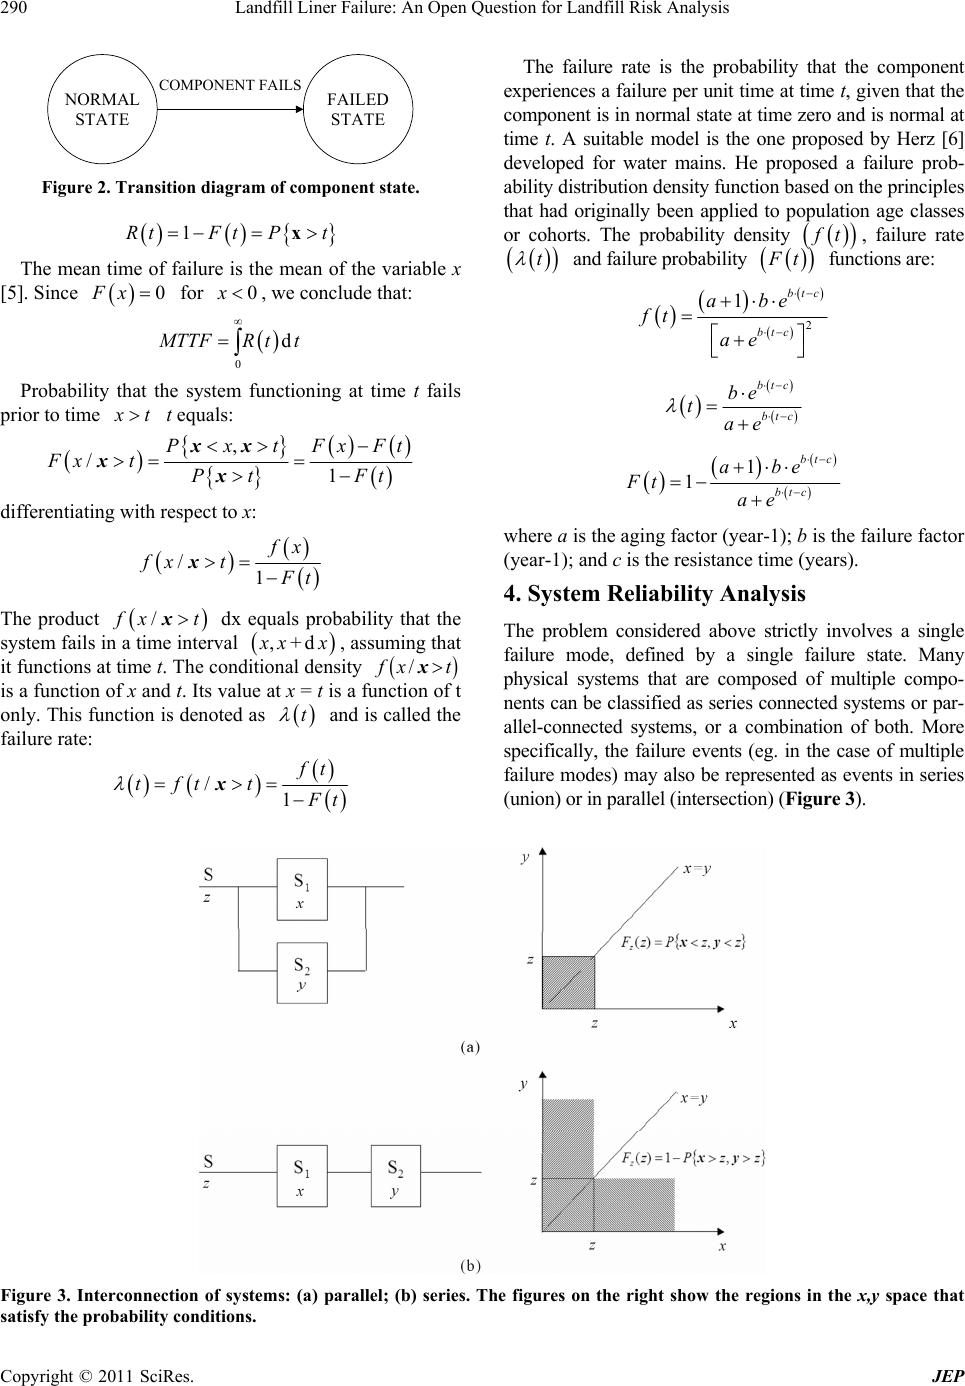 Landfill Liner Failure: An Open Question for Landfill Risk Analysis Copyright © 2011 SciRes. JEP 290 NORMAL STATE FAILED STATE COMPONENT FAILS The failure rate is the probability that the component experiences a failure per unit time at time t, given that the component is in normal state at time zero and is normal at time t. A suitable model is the one proposed by Herz [6] developed for water mains. He proposed a failure prob- ability distribution density function based on the principles that had originally been applied to population age classes or cohorts. The probability density Figure 2. Transition diagram of component state. f t, failure rate t and failure probability F t functions are: 1RtFtPt x The mean time of failure is the mean of the variable x [5]. Since for , we conclude that: 0Fx0x 2 1btc btc abe ft ae 0 d M TTFRtt btc btc be tae Probability that the system functioning at time t fails prior to time x t t equals: , /1 PxtFxFt Fx tPt Ft xx xx 1 1 btc btc abe Ft ae differentiating with respect to x: where a is the aging factor (year-1); b is the failure factor (year-1); and c is the resistance time (years). /1 f x fxt F t x 4. System Reliability Analysis The product / f xxt dx equals probability that the system fails in a time interval ,d x x+x, assuming that it functions at time t. The conditional density / f xtx is a function of x and t. Its value at x = t is a function of t only. This function is denoted as and is called the failure rate: t The problem considered above strictly involves a single failure mode, defined by a single failure state. Many physical systems that are composed of multiple compo- nents can be classified as series connected systems or par- allel-connected systems, or a combination of both. More specifically, the failure events (eg. in the case of multiple failure modes) may also be represented as events in series (union) or in parallel (intersection) (Figure 3). /1 f t tftt F t x Figure 3. Interconnection of systems: (a) parallel; (b) series. The figures on the right show the regions in the x,y space that atisfy the probability conditions. s 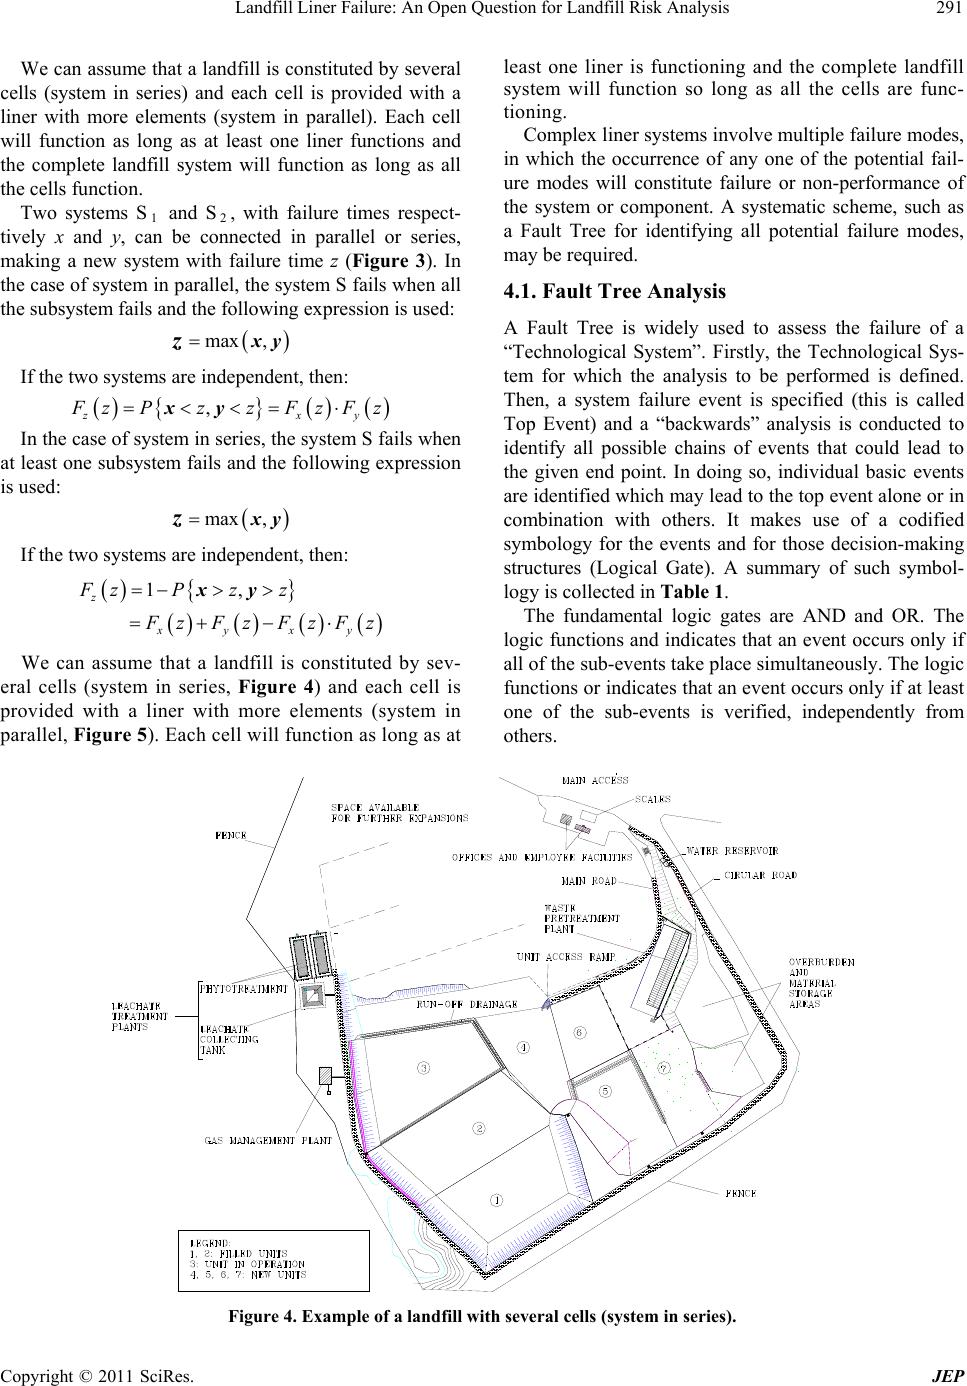 Landfill Liner Failure: An Open Question for Landfill Risk Analysis291 We can assume that a landfill is constituted by several cells (system in series) and each cell is provided with a liner with more elements (system in parallel). Each cell will function as long as at least one liner functions and the complete landfill system will function as long as all the cells function. Two systems S1 and S2, with failure times respect- tively x and y, can be connected in parallel or series, making a new system with failure time z (Figure 3). In the case of system in parallel, the system S fails when all the subsystem fails and the following expression is used: z max ,xy If the two systems are independent, then: , zxy F zPzzFzFz xy In the case of system in series, the system S fails when at least one subsystem fails and the following expression is used: z max ,xy If the two systems are independent, then: 1, z xyxy FzPz z F zFzFzFz xy We can assume that a landfill is constituted by sev- eral cells (system in series, Figure 4) and each cell is provided with a liner with more elements (system in parallel, Figure 5). Each cell will function as long as at least one liner is functioning and the complete landfill system will function so long as all the cells are func- tioning. Complex liner systems involve multiple failure modes, in which the occurrence of any one of the potential fail- ure modes will constitute failure or non-performance of the system or component. A systematic scheme, such as a Fault Tree for identifying all potential failure modes, may be required. 4.1. Fault Tree Analysis A Fault Tree is widely used to assess the failure of a “Technological System”. Firstly, the Technological Sys- tem for which the analysis to be performed is defined. Then, a system failure event is specified (this is called Top Event) and a “backwards” analysis is conducted to identify all possible chains of events that could lead to the given end point. In doing so, individual basic events are identified which may lead to the top event alone or in combination with others. It makes use of a codified symbology for the events and for those decision-making structures (Logical Gate). A summary of such symbol- logy is collected in Table 1. The fundamental logic gates are AND and OR. The logic functions and indicates that an event occurs only if all of the sub-events take place simultaneously. The logic functions or indicates that an event occurs only if at least one of the sub-events is verified, independently from others. Figure 4. Example of a landfill with several cells (system in series). Copyright © 2011 SciRes. JEP  Landfill Liner Failure: An Open Question for Landfill Risk Analysis 292 Figure 5. Example of a liner with more elements (system in parallel). Table 1. Symbology used in the fault tree analysis. EVENTS LOGIC ELEMENT SYMBOLS MEANING EVENT Primary system EVENT Intermediate event EVENT Top Event or Final Event LOGIC GATE LOGIC ELEMENT SYMBOLS MEANING The event happens if E1 and E 2 simultaneous take place The event happens if E1 or E2 takes place For generic event Ei, the probability P(Ei) is the exis- tence probability of the event A at time t. Given two ge- neric events A and B, each characterized by an actual probability, the following relations are verified: 12121 212 121 || PEPEandEPEEPEE PEPE EPEPEE 2 12 121 1212 PEPEOrEPEEPEE PEPEPEE 2 where 12 |PE E is the conditional probability of E1, given E2 and it is equal to: 12 12 2 |PEE PE EPE If E1 and E2 are independent the above expressions become easier, because 12 1 |PE EPE . In the case of more events (E1, E2, E3 and E4) the probability of the top event is: 1234 1312412 || PEPEEE E PEPEEEPEE EE 3 12341 2 341234 PEPEEE EPEPE PEPEPE EEE Knowing the probabilities of the individual basic events that constitute the system’s Fault Tree, you can estimate the probability of failure of the entire system by means of these fundamental algebra rules. Copyright © 2011 SciRes. JEP  Landfill Liner Failure: An Open Question for Landfill Risk Analysis293 A detailed Fault Free can be developed for the bottom liner of a Sanitary Landfill. The diagram structure should contain a mineral liner, a collection system and a syn- thetic liner. The failure of the whole liner system occurs in the case of simultaneous failure of the mineral liner (clay, bentonite), synthetic liner (geomembrane, GCL) and leachate collection system. The probability (P(E)) of liner failure can be determined as follows: 123 PEPEEE The events are dependent. In fact, a failure of one component increases the load supported by the other components. Consequently, the remaining components are more likely to fail, and we can not assume statistical independence of components. The functionality loss of each of these three compo- nents is due to different causes that international litera- ture has studied for a long time. Although each failure is an individual event related to site-specific ground condi- tions, climate conditions and design details, general be- haviour trends can be deduced by considering these three elements. A summary of the findings is presented in Ta- ble 2. However, for each component a main failure state can be defined as shown in Table 3. The failure of the component at time t occurs if the physical variable (pi) that describes the failure state is higher than a safety or project value (si). 4.2. Conditional Events The calculation of safety or failure probability of a sys- tem through the above equations is generally difficult due to the dependence of variables; approximation is almost always necessary. With regard to the latter, upper bounds of the corresponding probabilities are useful un- der the conservative principle assumption. For the selected fault tree, an estimation of the failure upper bound (P(E)) is [26]: 3 1 11 i i PE PE This expression indicates that the containment system will survive until all the components (mineral liner, syn- thetic liner and collection system) will work. This is a strong simplification of the study, but at the moment, if there are not sufficient data to support the conditional statistics of the compartments, it is the only solution. Table 2. Causes of the basic failure events. COMPONENT CAUSES COLLECTION SYSTEM Settlement, bad design and/or choice of materials, clogging due to particulate transport/chemical precipitation, Clogging due to biological material buildup, Pipe breakage/slope change MINERAL LINER Waste movement, settlement, bad compaction, bad design and/or choice of materials, pipes penetrating liner, geo- technical failure, uncontrolled groundwater infiltration, instability of the sub-grade both slope and basal heave, exhaustion adsorption capacity, increase in hydraulic conductivity due to interaction with leachate and to cracking SYNTHETIC LINER Installation damage, bad design and/or choice of materials, aging, pipes penetrating liner, geotechnical failure, unanticipated chemical attack, tension of the materials, uncontrolled groundwater infiltration, instability of the sub-grade both slope and basal heave Table 3. Failure state for single component. COMPONENT DESRIPTION OF FAILURE PHYSICAL VARIABLE (pi) THE FAILURE STATE (si) REFERENCE Leachate collection system Clogging of drainage layer due to chemical precipitation and to bio- film growth Ks (Hydraulic conductivity) 10−5 - 10−7 m/s [7,8] Exhaustion adsorption capacity EC (Exchangeable Cations) CEC (Cation Exchange Capacity) [9] Mineral liner Increase in hydraulic conductivity due to interaction with leachate and to cracking Ks (Hydraulic conductivity) 10−9 m/s [10-12] Aging of matrix structure due to the corrosive effects of leachate and to elevated temperatures gen- erated by the exothermic processes occurring in landfills Concentration of antioxidant Allowable number/type of defects as reported in the Construction Quality Assurance [13-19] Synthetic liner Damage due to poor dumping practices Number of defects by unit area Allowable number/type of defects as reported in the Construction Quality Assurance [20-25] Copyright © 2011 SciRes. JEP  Landfill Liner Failure: An Open Question for Landfill Risk Analysis 294 5. Liner Failure Data Base Procedure When N items being considered fail respectively at times t1, t2,.., tn, then the failure probability at time t1 can be approximated by 11/ F tN, at time t2 by 22/ F tN, and, in general by r/ F trN. Given sufficient data, a failure distribution can be de- termined by a piecewise polynomial approximation. When only fragmentary data are available we cannot construct the complete curve. In such case, an appropri- ate distribution (such as Exponential, Normal, Log- Normal, Weibull, Poisson, etc.) must be assumed and its parameters evaluated from data. This approach can be conducted in two different ways. First, the failure data are related to many landfills where the failure has been ascertained by means of monitoring data (inductive analysis). The failure of the system has been indirectly estimated as chemical con- centration (for example in a monitoring well outside the landfill) exceeding a table value. The problem of this approach consists in 1) the selection of a group of land- fills with similar liner design and operating conditions; 2) scarce data available on groundwater contamination be- fore the establishment of Law 471/99 in Italy; 3) unsuit- able location of monitoring wells; 4) ambiguous data that does not permit locating the contaminant source; and, 5) underestimated failure curves, because it considers deg- radation of contaminants in the landfill, natural attenua- tion in liner and in the environment. Second, the failure data are related to single compo- nent performance (mineral layer, drainage system, syn- thetic liner) according to Table 3. Probability re-mposi- tion of the components results in failure of the entire system (predictive system). For these reliability problems, the ‘average’ failure data from several lab tests may best describe the system behaviour. In this case, measure- ments of a parameter at one scale (eg. laboratory meas- urements) can be used to define the parameter at a larger scale. This approach of using sample measurements to define the ‘average’ system behaviour is described as upscaling. Where the system is believed to be heteroge- neous, then upscaling should be used with care. However, literature studies reveal that field and lab data on landfill failures are not enough for establishing probability distributions. In the future, a more accurate measure of liner failure could be done by a monitoring approach based on a Leak Detection Sump [27]. There- fore, subjective data needed to be included. In these cases it has become fairly customary for experts in re- lated fields to be asked to give their best subjective esti- mate, i.e. their expert opinion on the subject. Direct estimates about the mean life of liner barrier components can be obtained by the Delphi technique the contribution of each factor to the failure of the subsystem. The purpose of the Delphi technique is to elicit informa- tion and judgments from participants to facilitate the reso- lution of reliability problems when there are no field data. It does so without physically assembling the contributors. Instead, information is exchanged via mail, FAX, or email. This technique is designed to take advantage of partici- pants’ creativity as well as facilitating effects of group involvement and interaction. It is structured to capitalize on the merits of group problem-solving and minimize the liabilities of group problem-solving. According to the first approach, a failure distribution has been determined for a size sample of almost 30 sites in the North of Italy that are designed as contained land- fills respecting the following principles ( details on land- fills are collected in Table 4): Minimize rainfall infiltrations; Maintain anaerobic conditions; Isolate the waste from the environment with natural and artificial materials; Collect biogas and leachate by means of extraction systems, such as vertical and horizontal materials (when collection systems are present). Figure 6 shows the failure of landfills in the first 30 years and the Herz model fitting curve [6]. The applica- tion shows that in the North of Italy landfills can con- taminate with high probability (more than 60%) the groundwater in the first 30 years. 6. Conclusions This paper illustrates a suitable methodology for evalu- ating landfill liner failure during aftercare. There are two different approaches: a deductive and a predictive analy- sis. The former can be used only for landfills with similar design and operating conditions, the latter (more flexible) requires information regarding correlation of variables. For successful application, both approaches require more accurate liner failure data. Currently, the analysis of failure data shows a lack of information to assess the approach of system reli- ability. A simplification can be obtained considering the worst case (P(E) = 1) for the containment system. This assumption is routinely included in traditional hydrological risk assessments and it is reliable if the failure time is lower than the simulation time in which the risk is evaluated; otherwise the approach is too conservative and the results do not represent what really could occur. In this “precautionary” approach, average defect val- ues for synthetic liner are assumed; performance of min- eral liner remains constant over time and is the same as measured in the liner test; performance of drainage sys- tem is indirectly considered in the leachate head estima- Copyright © 2011 SciRes. JEP  Landfill Liner Failure: An Open Question for Landfill Risk Analysis295 Table 4. Characteristics of landfills used for the definition of the failure curve. All the landfills are sited in the North of Italy. For each landfill the failure time has been estimated as the number of years after the beginning in which the chemical con- centration exceeding a table value. Municipal Solid Waste = MSW; Inert Waste = IW. LANDFILL VOLUME ESTIMATED FAILURE TIME LANDFILL CODE WASTE TYPE CONTAINMENT SYSTEM DESIGN (m3) (years) RSA MSW Clay liner (>1 m), geomembrane, drainage layer, leachate col- lection system 1,450,000 12 BCA MSW Clay liner (>1 m), geomembrane, drainage layer, leachate col- lection system 700,000 43 NBA MSW Clay liner (>1 m), geomembrane, drainage layer, leachate col- lection system 600,000 22 CAN MSW Clay liner (>1 m), geomembrane, drainage layer, leachate col- lection system 350,000 19 URB MSW Clay liner (>1 m) 200,000 1 GRI MSW and IW Clay liner (>2 m), geomembrane, drainage layer, leachate col- lection system 420,000 59 DEN MSW Clay liner (>1 m), geomembrane, drainage layer, leachate col- lection system 135,000 28 AUS MSW Clay liner (>1 m), drainage layer, leachate collection system 900,000 36 GER MSW Clay liner (>1 m), geomembrane 850,000 17 NOD MSW Clay liner (>1 m), geomembrane, drainage layer 930,000 34 USA MSW Clay liner (>1 m) , drainage layer, leachate collection system 1,300,000 5 AMC MSW Clay liner (>1 m), drainage layer, leachate collection system 1,100,000 20 BBL IW Clay liner (>1 m), geomembrane 970,000 25 BST MSW Clay liner (>1 m) geomembrane, drainage layer, leachate collection system 780,000 26 BRT MSW Clay liner (>1 m) geomembrane, drainage layer, leachate collection system 670,000 25 ILP MSW Clay liner (>1 m), geomembrane 440,000 13 RIF MSW Clay liner (>1 m) geomembrane, drainage layer, leachate collection system 820,000 7 MCH MSW Clay liner (>1 m) geomembrane, drainage layer, leachate collection system 600,000 28 RNO MSW and IW Clay liner (>1 m), geomembrane 760,000 30 SHC MSW and IW Clay liner (>1 m) geomembrane, drainage layer, leachate collection system 300,000 23 UNM MSW Clay liner (>1 m), geomembrane 470,000 40 CPD MSW Clay liner (>1 m) geomembrane, drainage layer, leachate collection system 292,500 27 AQO MSW Clay liner (>1 m), geomembrane 300,000 35 MDA MSW Clay liner (> 1 m), geomembrane, drainage layer, leachate collection system 1,000,000 36 LGO IW Clay liner (>1 m), geomembrane, drainage layer, leachate col- lection system 1,600,000 38 TRO MSW Clay liner (>1 m), geomembrane, drainage layer, leachate col- lection system 3,200,000 39 CRA MSW Clay liner (>1 m), geomembrane, drainage layer, leachate col- lection system 1,101,000 40 TRV1 MSW and IW Clay liner (>1 m) 250,000 41 TRV2 MSW and IW Clay liner (>1 m) geomembrane 450,000 21 TRV3 MSW and IW Clay liner (>1 m), geomembrane 650,000 33 Copyright © 2011 SciRes. JEP 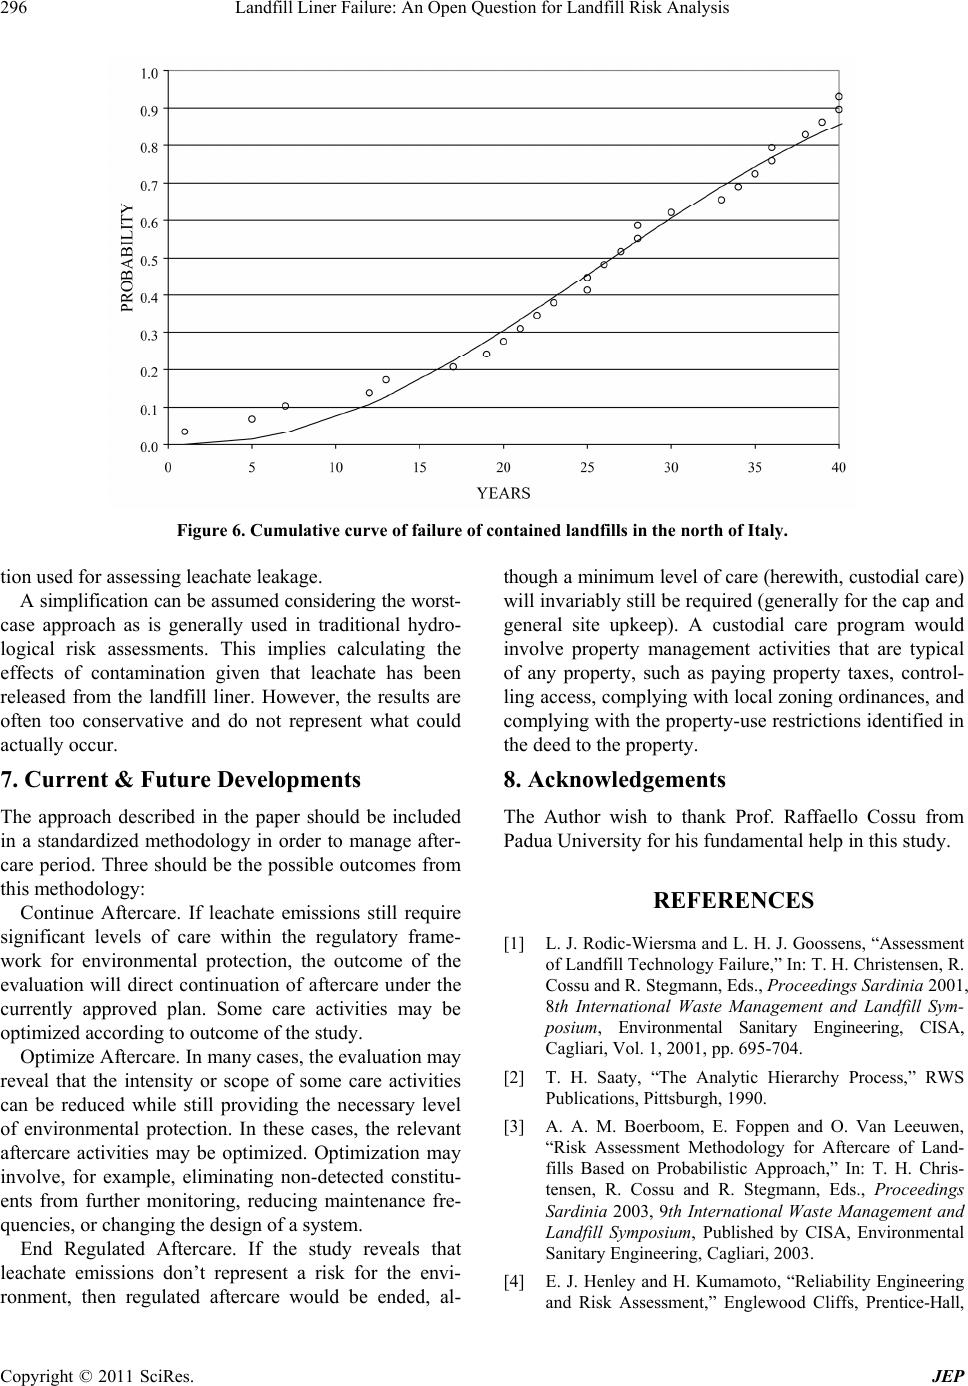 Landfill Liner Failure: An Open Question for Landfill Risk Analysis 296 Figure 6. Cumulative curve of failure of contained landfills in the north of Italy. tion used for assessing leachate leakage. A simplification can be assumed considering the worst- case approach as is generally used in traditional hydro- logical risk assessments. This implies calculating the effects of contamination given that leachate has been released from the landfill liner. However, the results are often too conservative and do not represent what could actually occur. 7. Current & Future Developments The approach described in the paper should be included in a standardized methodology in order to manage after- care period. Three should be the possible outcomes from this methodology: Continue Aftercare. If leachate emissions still require significant levels of care within the regulatory frame- work for environmental protection, the outcome of the evaluation will direct continuation of aftercare under the currently approved plan. Some care activities may be optimized according to outcome of the study. Optimize Aftercare. In many cases, the evaluation may reveal that the intensity or scope of some care activities can be reduced while still providing the necessary level of environmental protection. In these cases, the relevant aftercare activities may be optimized. Optimization may involve, for example, eliminating non-detected constitu- ents from further monitoring, reducing maintenance fre- quencies, or changing the design of a system. End Regulated Aftercare. If the study reveals that leachate emissions don’t represent a risk for the envi- ronment, then regulated aftercare would be ended, al- though a minimum level of care (herewith, custodial care) will invariably still be required (generally for the cap and general site upkeep). A custodial care program would involve property management activities that are typical of any property, such as paying property taxes, control- ling access, complying with local zoning ordinances, and complying with the property-use restrictions identified in the deed to the property. 8. Acknowledgements The Author wish to thank Prof. Raffaello Cossu from Padua University for his fundamental help in this study. REFERENCES [1] L. J. Rodic-Wiersma and L. H. J. Goossens, “Assessment of Landfill Technology Failure,” In: T. H. Christensen, R. Cossu and R. Stegmann, Eds., Proceedings Sardinia 2001, 8th International Waste Management and Landfill Sym- posium, Environmental Sanitary Engineering, CISA, Cagliari, Vol. 1, 2001, pp. 695-704. [2] T. H. Saaty, “The Analytic Hierarchy Process,” RWS Publications, Pittsburgh, 1990. [3] A. A. M. Boerboom, E. Foppen and O. Van Leeuwen, “Risk Assessment Methodology for Aftercare of Land- fills Based on Probabilistic Approach,” In: T. H. Chris- tensen, R. Cossu and R. Stegmann, Eds., Proceedings Sardinia 2003, 9th International Waste Management and Landfill Symposium, Published by CISA, Environmental Sanitary Engineering, Cagliari, 2003. [4] E. J. Henley and H. Kumamoto, “Reliability Engineering and Risk Assessment,” Englewood Cliffs, Prentice-Hall, Copyright © 2011 SciRes. JEP  Landfill Liner Failure: An Open Question for Landfill Risk Analysis297 New Jersey, 1981. [5] A. Papoulis, “Probability, Random Variables and Sto- chastic Processes,” McGraw-Hill, New York, 1993. [6] R. K. Herz, “Ageing Process and Rehabilitation Needs of Drinking Water Distribution Networks,” Journal of Wa- ter SRT-Acqua, Vol. 47, No. 6, 1996, pp. 275-283. [7] D. Cazzuffi, R. Cossu and M. C. Lavagnolo, “Efficiency of Geotextiles and Geocomposites in Landfill Drainage Systems,” In: T. H. Christensen and R. Cossu, Eds., Landfilling of Waste: Barriers, London, 1994. [8] H. August, “Leachate Drainage Systems,” Advanced Landfill Liner Systems, Thomas Telford Publishing, Thomas Telford Services Ltd., London, 1997, pp. 84-93. [9] C. A. J. Appelo and D. Postma, “Geochemistry, Ground- water and Pollution,” 2th Edition, Taylor & Francis, Rotterdam, 1994, p. 536. [10] R. M. Quigley and F. Fernandez, “Effect of Organic Liq- uids on the Hydraulic Conductivity of Natural Clays,” In: T. H. Christensen, R. Cossu and R. Stegmann, Eds., Landfilling of Waste: Barriers, E & FN Spon, London, 1994, pp. 203-218. [11] A. Cancelli, R. Cossu, F. Malpei and A. Offredi, “Effects of Leachate on the Permeability of Sand-Bentonite Mix- tures,” In: T. H. Christensen, R. Cossu and R. Stegmann, Eds., Effect of Organic Liquids on the Hydraulic Conduc- tivity of Natural Clays, in Landfilling of Waste: Barriers, E & FN Spon, London, 1994, pp. 259-293. [12] J. L. Daniels, H. I. Inyang and I. K. Iskandar, “Durability of Boston Blue Clay in Waste Containment Applica- tions,” Journal of Materials in Civil Engineering, Vol. 15, No. 2, 2003, pp. 144-152. doi:10.1061/(ASCE)0899-1561(2003)15:2(144) [13] H. E. Haxo and P. D. Haxo. “Basic Composition and Properties of synthetic Materials in Lining Systems,” In: T. H. Christensen, R. Cossu and R. Stegmann, Eds., Landfilling of Waste: Barriers, E & FN Spon, London, 1994, pp. 317-343. [14] A. L. Rollin, J. Mlynarek, J. Lafleur and A. Zanescu, “Performance Changes in Aged In-Situ HDPE Geomem- brane,” In: T. H. Christensen, R. Cossu and R. Stegmann, Eds., Landfilling of Waste: Barriers, E & FN Spon, Lon- don, 1994, pp. 431-443. [15] C. Duquennoi, C. Bernhard and S. Gaumet, “Laboratory Ageing of Geomembranes in Landfill Leachates,” In: T. H. Christensen, R. Cossu and R. Stegmann, Eds., Pro- ceedings Sardinia 95, Fourth International Waste Man- agement and Landfill Symposium, CISA, Environmental Sanitary Engineering, Inc, Cagliari, Vol. 2, 1993, pp. 397-404. [16] R. Surmann, P. Pierson and P. Cottour, “Geomembrane Liner Performance and Long Term Durability,” In: T. H. Christensen, R. Cossu and R. Stegmann, Eds., Proceed- ings Sardinia 95, Fourth International Waste Manage- ment and Landfill Symposium, CISA, Environmental Sanitary Engineering, Inc., Cagliari, Vol. 2, 1994, pp. 405-414. [17] H. P. Sangam and R. K. Rowe, “Migration of Dilute Aqueous Organic Pollutants through HDPE Geomem- branes,” Geotextiles and Geomembranes, Vol. 19, No. 6, 2001, pp. 329-357. doi:10.1016/S0266-1144(01)00013-9 [18] R. M. Koerner and Y. G. Hsuan, “Lifetime Prediction of Polymeric Geomembranes Used in New Dam Cons- truc- tion and Dam Rehabilitation,” Proceedings Associate of State Dam Safety Officials Conference, Lake Harmony, 2003. [19] W. Mueller and I. Jakob, “Oxidative Resistance of High-Density Polyethylene Geomembranes,” Polymer Degradation and Stability, Elsevier Science Ltd., Oxford, Vol. 79, No. 1, 2003, pp. 161-172. [20] J. P. Giroud and R. Bonaparte, “Leakage through Liners Constructed with Geomembranes-Part I. Geomembrane Liners,” Geotextiles and Geomembranes, Vol. 8, No. 1, 1989, P. 27. doi:10.1016/0266-1144(89)90009-5 [21] G. T. Darilek, D. Laine and J. O. Parra. “The Electrical Leak Location Method for Geomembrane Liners: Devel- opment and Applications,” Proceedings of the Geosyn- thetics’89 Conference, San Diego, 1989, pp. 456-466. [22] D. L. Laine and M. P. Miklas, “Detection and Location of Leaks in Geomembrane Liners Using an Electrical Method Case Histories,” Superfund’89 Proceedings of the 10th National Conference, Washington DC, 1989, pp. 35-40. [23] P. Colucci and M. C. Lavagnolo, “Three Years Field Experience in Electrical Control of Synthetic Landfill Liners,” In: T. H. Christensen, R. Cossu and R. Stegmann, Eds., Proceedings Sardinia 2001, 5th International Waste Management and Landfill Symposium, CISA, Environ- mental Sanitary Engineering, Cagliari, Vol. 2, 1995, pp. 437-452. [24] S. J. McQuade and A. D. Needham, “Geomembrane Liner Defect-Causes, Frequency and Avoidance,” Pro- ceeding Instituion, Civil Engeers Geotechnical Engi- neering, Vol. 137, No. 4, 1999, pp. 203-213. [25] A. L. Rollin, M. Marcotte, T. Jacqueline and L. Chaput, “Leak Location in Exposed Geomembrane Liners Using an Electrical Leak Detection Techniques,” Proceedings Geosynthetic 99, Industrial Fabrics Association Interna- tional, Minneapolis, 1999, pp. 27-102. [26] J. D. Esary and F. Proschan, “Coherent Structures with Non-Identical Components,” Technometric, Vol. 5, No. 2, 1981, p. 191. doi:10.2307/1266063 [27] K. H. Johnson and J. L. Panders, “How do Modern Land- fills Leak?” In: T. H. Christensen, R. Cossu and R. Steg- mann, Eds., Proceedings Sardinia 2003, 9th International Waste Management and Landfill Symposium, CISA, En- vironmental Sanitary Engineering, Inc., Cagliari, 2003. Copyright © 2011 SciRes. JEP |