Paper Menu >>
Journal Menu >>
 Journal of Environmental Protection, 2011, 2, 280-286 doi:10.4236/jep.2011.23031 Published Online May 2011 (http://www.scirp.org/journal/jep) Copyright © 2011 SciRes. JEP 1 Impact of Feedlot on Soil Phosphorus Concentration Nicolás Wyngaard, Liliana Picone, Cecilia Videla, Ester Zamuner, Néstor Maceira Facultad de Ciencias Agrarias (U. N. M. P.)-Estación Experimental Agropecuaria Balcarce (I. N. T. A.), Unidad Integrada Balcarce, Balcarce, Argentina. Email: lpicone@balcarce.inta.gov.ar Received December 27th, 2010; revised January 30th, 2011; accepted March 10th, 2011. ABSTRACT Raising cattle in feedlots is becoming more common in Argentina, but there is little information available about the effects of this practice on soil phosphorus (P) dynamics. In this study, concentrations of water and Bray-1 extractable soil P were quantified in a feedlot (upper and lower slope pos itions in the feedlot pen), runoff area and pa sture during 2006-2008. The feedlot showed higher P concentrations in all P forms, soluble reactive P, soluble nonreactive, total soluble P, and Bray-P1 when compared to runoff area and pasture. Most of the to tal soluble P was soluble reactive P from the soil in the feedlot and the runoff area, while soluble nonreactive P predominated in the pasture. Concentra- tions of total soluble P were elevated in the feedlot at the soil surface, ranging on average from 158.71 to 245.86 mg·P·kg−1, and had a rapid decrease within the first 20 cm and remained relatively low, about 25.53 - 27.33 mg·P·kg−1. The evidence tha t total soluble P concen tration in the feedlot was significa ntly (p < 0.05) higher than that registered in the pasture at 20 - 40 and 40 - 60 cm soil depth suggests a potentia l transfer of P through the soil from the surface. Al- though the feedlot had a moderate increase of 23.05 to 24.55 mg·P·kg−1 from the background concentration, it may represent a long-term source of in creased nutrient loading to groundwater. So il extractable Bray -1 P in the top 0 - 2.5 cm fluctuated from 659.26 to 45.36 mg·P·kg−1 in the feedlot and pasture, respectively. The relationship between soil P extracted by test and TSP was linear, and correlation coefficient was r2 = 0.95. Keywords: Feedlot, Water Soluble P, Bray-1 P, Ca ttle Manure, Phosphorus, Runoff 1. Introduction Although in Argentina grazing is the beef production system most extensively used, in recent years concen- trated bovine feeding, especially in the Pampa region, is more frequently used [1]. Concentrated animal opera- tions have advantages in terms of animal growth rate and uniformity in meat quality; however they may be a po- tential risk of environmental pollution because of the high animal stocking that produces a large volume of manure. This situation creates an imbalance in soil nu- trients that could lead to contamination of water sources and atmosphere, either by accumulation of nutrients or transfer of them to other systems. This condition is espe- cially true for phosphorus (P) which is one of the nutria- ents excreted by ruminants, mostly through feces [2], and its management is very important from the agricultural and environmental standpoint. Low soil P concentrations affect crop production while high soil P concentrations can produce the release of this nutrient to surface waters and accelerate the eutrophication, affecting water quality. In an increasing number of areas, the potential for P losses through runoff has been increased by the continu- ous application of fertilizer and/or manure from intensive livestock operations [3]. Many studies have reported that the loss of dissolved P in surface runoff is dependent on the available P content of surface soil as measured by soil P test extractants [4-6]. Pote et al. [7] considered that water extractable soil P should be the best predictor of P concentration in water runoff, showing that soluble reac- tive P and bioavailable P in runoff were better correlated with water soluble P than with P extracted by Mehlich-3, Bray-Kurtz 1 and Olsen from soil. However, soil test P levels alone have little meaning in P loss potential unless they are used in conjunction with an estimate of potential surface runoff, erosion and leaching. To this end, a P indexing system was developed to identify the vulner- ability to P loss of areas or fields [8]. *This work was supported by the projects FCA-UNMdP 15/A240 and INTA-PNECO 1302 Similar to cropped soils, high concentrations of easily  Impact of Feedlot on Soil Phosphorus Concentration 281 soluble P in soil surface from intensive beef production systems are associated with high concentrations of solu0 ble reactive P and total P in percolated water [9]. Klein- man et al. [10] found that the concentration of dissolved reactive P in water runoff was positively correlated with water soluble P concentration in surface-applied manure. To study the dynamics of P from feedlots can be com- plicated compared with agricultural soils due to the forms and concentrations of P in animal feces vary widely because variations in P nutritional physiology and P content in animal diets. There is high variability in nutrients within and among feedlots, and fresh manure is continuously deposited on the pen surface. During the 1990s, Argentina has experienced a signi- ficant growth in the number of feedlots. According to National Animal Health Service, there are now about 2 278 active, registered feedlots that contain 1,600,890 head of cattle and range in size from small farms to large-scale commercial livestock operations, but most of them have 500 animals. In addition, unlike developed countries, no rules have been promulgated to apply in most aspects of animal production including location, construction, operation and management of feedlots and manure handling facilities, except for incipient legisla- tions in some provinces. Clearly, livestock production in Argentina is not as intensive in the USA or Europe, thus P inputs are often lower. However it is important to un- derstand the transformations undergone by nutrients deposited in significant amount on the pen surface at open cattle feedlots, and if they represent a potential risk threat to water quality in order to develop effective management practices for sustainable animal production. Consequently, the objectives of this study were to 1) measure the amount of water soluble P in soil surface and in depth from two areas within feedlot, and in adja- cent fields, runoff area and pasture, and 2) determine if there is a relationship between agronomic test P (Bray-1) and water soluble P. 2. Materials and Methods 2.1. Area of Study The study was carried out in a farm located at Balcarce county (37˚S; 58˚13 W), in the southeastern area of Buenos Aires province (Argentina) that has an open feedlot established on even area, but slightly sloping to- wards the back of the pen (1% slope). Two areas were selected within the feedlot pen: in the upper (UP) and lower (LP) slope positions of the feedlot. Outside of the feedlot, on the lower side of the farm, there is a depress- sion that collects the runoff water from feedlot and adja- cent fields and this area was identified as runoff area (RA). An additional site evaluated was the pasture (PA) or reference area composed by grasses, with no animal occupancy. Soil chemical properties of these areas are summarized in Table 1. 48 The soil was classified as a Chelforó Series, a fine, mixed, thermic, Typic Natraqualf characterized by the presence of a surface horizon with loam texture, and clay loam to clay subsoil horizons with low permeability due to high Na concentration. Climate of the area is humid- subhumid mesothermal with an annual precipitation of 879 mm (period 1971-2007). Mean annual maximum and minimum temperature are 19.6 and 8.1˚C, respect- tively, with annual mean thermal amplitude of 12.8˚C. Cattle were placed at a rate of 50 to 165 m2·head−1 and were fed a corn-based diet. The animals also received 250 g·day−1 of mineral supplement that had 60% of non-protein nitrogen such as urea (19%) and ammonium sulphate (5%). 2.2. Soil Sample Analysis At each area, three composite soil samples were taken at 0 - 2.5 cm depth in November and December 2006, and February and May 2007. Soil samples were also col- lected at 0 - 10, 10 - 20, 20 - 40 and 40 - 60 cm to evalu- ate changes in water soluble P concentrations with depth in July and September 2008. Soil samples were homoge- nized, air dried (25˚C - 30˚C) and passed through a 2-mm mesh sieve. Water soluble P from soil was measured following the technique described by Kuo [11]. Two g of soil with 20 mL of distilled water were shaken in an end-over-end shaker for 1 h. The water extract was centrifuged at 2500 x g for 10 min, filtered through a 0.45 µm membrane filter and then analyzed for soluble reactive P (SRP). Same filtrate was digested in an autoclave (121˚C) for 60 - 90 min with ammonium persulfate and 0.9M H2SO4. The difference in concentration between TSP and SRP was considered the concentration of SNRP. The SRP consists of inorganic orthophosphate extractable with water, while SNRP may contain organic and some con- densed forms of P. Phosphate in extracts and digests were quantified colo- rimetrically with the molybdenum-blue method of Mur- phy and Riley [12]. Previously, the digests were neutral- lized using p-nitrophenol indicator and dropwise addition of either 0.5M H2SO4 or 1M NaOH. Besides SRP, SNRP and TSP determinations, P was determined using the agronomic soil test of Bray and Kurtz [13] in soil samples from 0 - 2.5 cm depth. For soil chemical characterization, total organic car- bon (TOC) was determined by wet combustion with po- tassium dichromate and concentrated sulphuric acid [14], totl nitrogen (TN) by digestion with sulphuric acid in a Copyright © 2011 SciRes. JEP 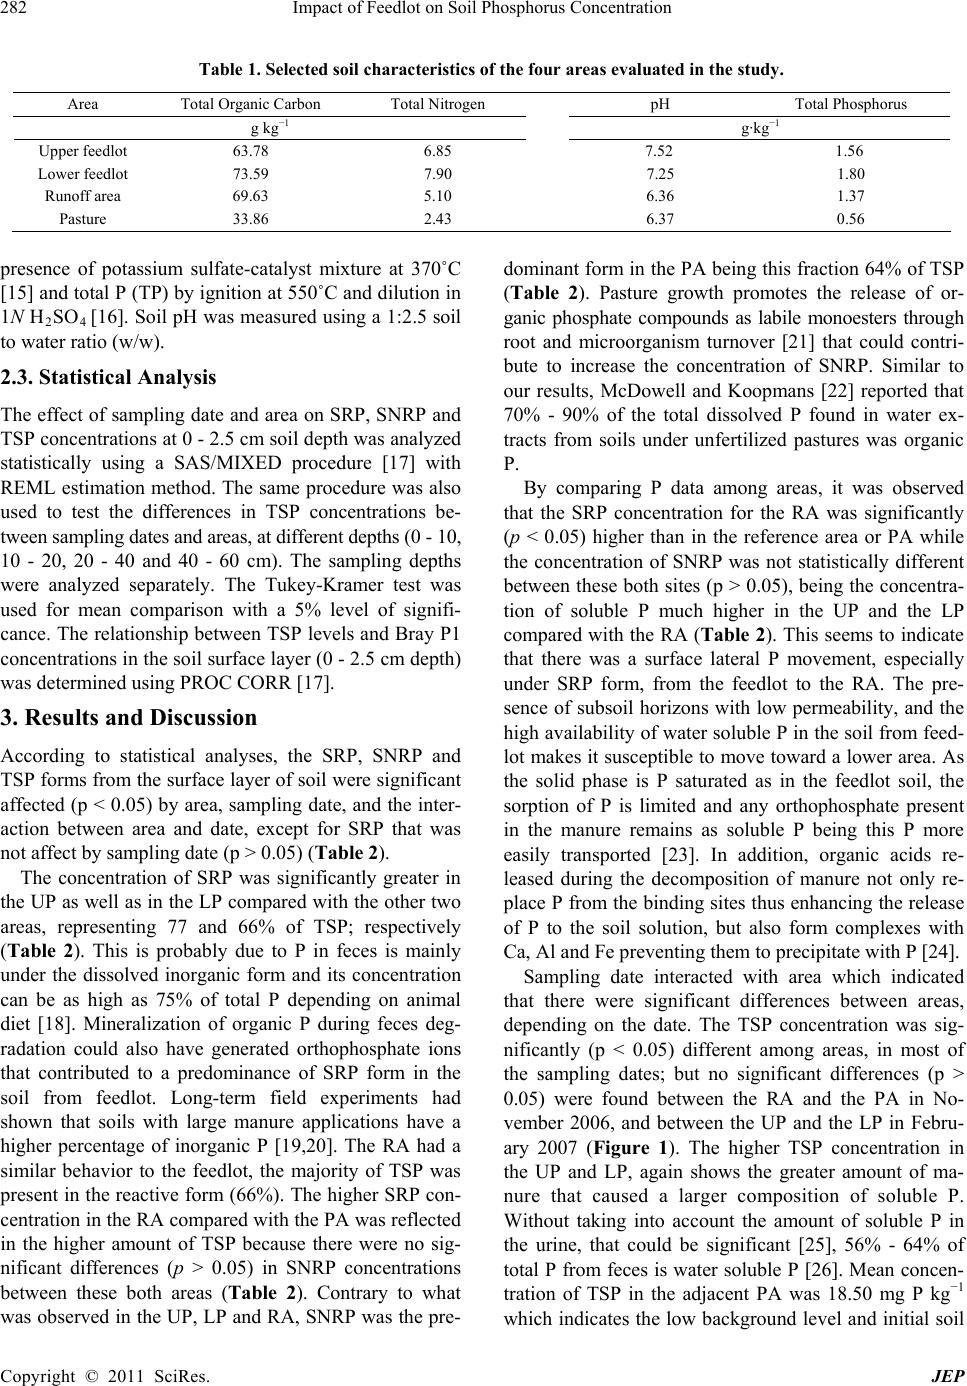 Impact of Feedlot on Soil Phosphorus Concentration Copyright © 2011 SciRes. JEP 282 Table 1. Selected soil characteristics of the four areas evaluated in the study. Area Total Organic Carbon Total Nitrogen pH Total Phosphorus g kg−1 g·kg−1 Upper feedlot 63.78 6.85 7.52 1.56 Lower feedlot 73.59 7.90 7.25 1.80 Runoff area 69.63 5.10 6.36 1.37 Pasture 33.86 2.43 6.37 0.56 presence of potassium sulfate-catalyst mixture at 370˚C [15] and total P (TP) by ignition at 550˚C and dilution in 1N H2SO4 [16]. Soil pH was measured using a 1:2.5 soil to water ratio (w/w). 2.3. Statistical Analysis The effect of sampling date and area on SRP, SNRP and TSP concentrations at 0 - 2.5 cm soil depth was analyzed statistically using a SAS/MIXED procedure [17] with REML estimation method. The same procedure was also used to test the differences in TSP concentrations be- tween sampling dates and areas, at different depths (0 - 10, 10 - 20, 20 - 40 and 40 - 60 cm). The sampling depths were analyzed separately. The Tukey-Kramer test was used for mean comparison with a 5% level of signifi- cance. The relationship between TSP levels and Bray P1 concentrations in the soil surface layer (0 - 2.5 cm depth) was determined using PROC CORR [17]. 3. Results and Discussion According to statistical analyses, the SRP, SNRP and TSP forms from the surface layer of soil were significant affected (p < 0.05) by area, sampling date, and the inter- action between area and date, except for SRP that was not affect by sampling date (p > 0.05) (Table 2). The concentration of SRP was significantly greater in the UP as well as in the LP compared with the other two areas, representing 77 and 66% of TSP; respectively (Table 2). This is probably due to P in feces is mainly under the dissolved inorganic form and its concentration can be as high as 75% of total P depending on animal diet [18]. Mineralization of organic P during feces deg- radation could also have generated orthophosphate ions that contributed to a predominance of SRP form in the soil from feedlot. Long-term field experiments had shown that soils with large manure applications have a higher percentage of inorganic P [19,20]. The RA had a similar behavior to the feedlot, the majority of TSP was present in the reactive form (66%). The higher SRP con- centration in the RA compared with the PA was reflected in the higher amount of TSP because there were no sig- nificant differences (p > 0.05) in SNRP concentrations between these both areas (Table 2). Contrary to what was observed in the UP, LP and RA, SNRP was the pre- dominant form in the PA being this fraction 64% of TSP (Table 2). Pasture growth promotes the release of or- ganic phosphate compounds as labile monoesters through root and microorganism turnover [21] that could contri- bute to increase the concentration of SNRP. Similar to our results, McDowell and Koopmans [22] reported that 70% - 90% of the total dissolved P found in water ex- tracts from soils under unfertilized pastures was organic P. By comparing P data among areas, it was observed that the SRP concentration for the RA was significantly (p < 0.05) higher than in the reference area or PA while the concentration of SNRP was not statistically different between these both sites (p > 0.05), being the concentra- tion of soluble P much higher in the UP and the LP compared with the RA (Table 2). This seems to indicate that there was a surface lateral P movement, especially under SRP form, from the feedlot to the RA. The pre- sence of subsoil horizons with low permeability, and the high availability of water soluble P in the soil from feed- lot makes it susceptible to move toward a lower area. As the solid phase is P saturated as in the feedlot soil, the sorption of P is limited and any orthophosphate present in the manure remains as soluble P being this P more easily transported [23]. In addition, organic acids re- leased during the decomposition of manure not only re- place P from the binding sites thus enhancing the release of P to the soil solution, but also form complexes with Ca, Al and Fe preventing them to precipitate with P [24]. Sampling date interacted with area which indicated that there were significant differences between areas, depending on the date. The TSP concentration was sig- nificantly (p < 0.05) different among areas, in most of the sampling dates; but no significant differences (p > 0.05) were found between the RA and the PA in No- vember 2006, and between the UP and the LP in Febru- ary 2007 (Figure 1). The higher TSP concentration in the UP and LP, again shows the greater amount of ma- nure that caused a larger composition of soluble P. Without taking into account the amount of soluble P in the urine, that could be significant [25], 56% - 64% of total P from feces is water soluble P [26]. Mean concen- tration of TSP in the adjacent PA was 18.50 mg P kg−1 which indicates the low background level and initial soil  Impact of Feedlot on Soil Phosphorus Concentration 283 P status. In general, concentrations of TSP did not fluc- tuate greatly among dates; except for the UP which de- creased sharply in February 2007 because the animal waste was removed from the soil surface before sam- pling of the soil (Figure 1). The concentration of SRP was significantly (p < 0.05) higher in the UP compared with the LP, RA and PA for all the sampling dates; and the differences in this fraction P were not significant (p > 0.05) between the RA and the PA in November and De- cember 2006 (Figure 2). As pointed out above, the presence of manure together with mineralization of or- ganic P could explain the higher SRP concentration in the feedlot. The increase in soil pH (averaged 7.41) in the feedlot may also have a bearing on P release. In con- trast to SRP, the concentration of SRNP presented sig- nificant (p < 0.05) differences between the UP and the LP only in May 2007. Concentration of SRNP was lower in the RA and the PA compared with that observed in the UP and the LP, except for February where there were no differences (p > 0.05) among the RA, PA and LP (Fig- ure 3). In relation to changes of TSP with depth, the data showed that the concentration of this fraction was only affected by area (p < 0.05); however, area interacted with sampling date at 40 - 60 cm depth (Table 3). This inter- action indicated that there was significant difference (p < 0.05) in TSP concentration between the UP and the LP (48.7 and 4.82 mg·P·kg−1, respectively) in July while in September the TSP was unaffected by areas. The con- centration of TSP was high in the feedlot (158.71 to 245.86 mg·P·kg−1), low in the RA (26.61 mg·P·kg−1) and still lower in the PA (4.16 mg·P·kg−1) on the soil surface. Compared with the RA and the PA, TSP concentration in the feedlot rapidly decreased within the upper 20 cm of soil and remained relatively low, 25.53 - 27.33 mg P kg−1. The presence of a compacted layer of manure and soil, and the reduced water infiltration [27] possibly restricted the P movement into deeper soil layers. However, the evidence that TSP concentration in the feedlot, especially in the upper slope position of the pen, was significantly (p < 0.05) higher than in the reference area at 20 - 40 and 40 - 60 cm soil depth, suggests a potential transfer of P through the soil from the surface in the feedlot. This process could have been favored not only by the high P concentrations in the soil surface but also by dry- ing-wetting cycles that generate fissures that allow a preferential flow of P or the urine infiltration. In Ne- braska, during most summers, 2 - 3 cm wide cracks were observed in feedlots, especially those with soils having high clay content [28]. The concentration of Bray P1 in the top 2.5 cm of the Table 2. Mean concentrations of total soluble phosphorus (TSP), soluble reactive phosphorus (SRP) and soluble non- reactive phosphorus (SNRP) from the surface layer of soil (0 - 2.5 cm) in the evaluated areas, and a summary of analysis of variance results. Area TSP SRP SNRP mg·P·kg−1 Upper-feedlot 233.43 a 178.84 a 54.58 a Lower-feedlot 180.83 b 119.81 b 57.15 a Runoff area 44.68 c 29.40 c 15.04 b Pasture 18.50 d 6.87 d 11.77 b Pr > F values Area 0.0001 0.0001 0.0001 Sampling date 0.0001 0.1203 0.0001 Area*sampling date0.0001 0.0027 0.0001 Within each column, means in TSP, SRP and SNRP followed by the same letter do not differ significantly (p > 0.05). Table 3. Concentration of total soluble phosph orus (TSP) at different soil depths in the evaluated areas. Depth Upper feedlot Lower feedlot Runoff areaPasture cm mg·P·kg−1 0 - 10 245.86 a 158.71b 26.61 c 4.16 c 10 - 20150.26 a 54.98 b 15.11 c 2.76 c 20 - 4025.53 a 10.87 b 10.79 b 2.48 c 40 - 6027.33 a 6.73 b 6.46 b 2.78 b Within each depth, means in TSP among sampling areas followed by the same letter do not differ significantly (p > 0.05). Figure 1. Concentration of total soluble phosphorus (TSP) as influenced by sampling dates and areas during the study periods. Means in TSP among sampling areas, for each date, followed by the same letter do not differ significantly (p < 0.05). Copyright © 2011 SciRes. JEP 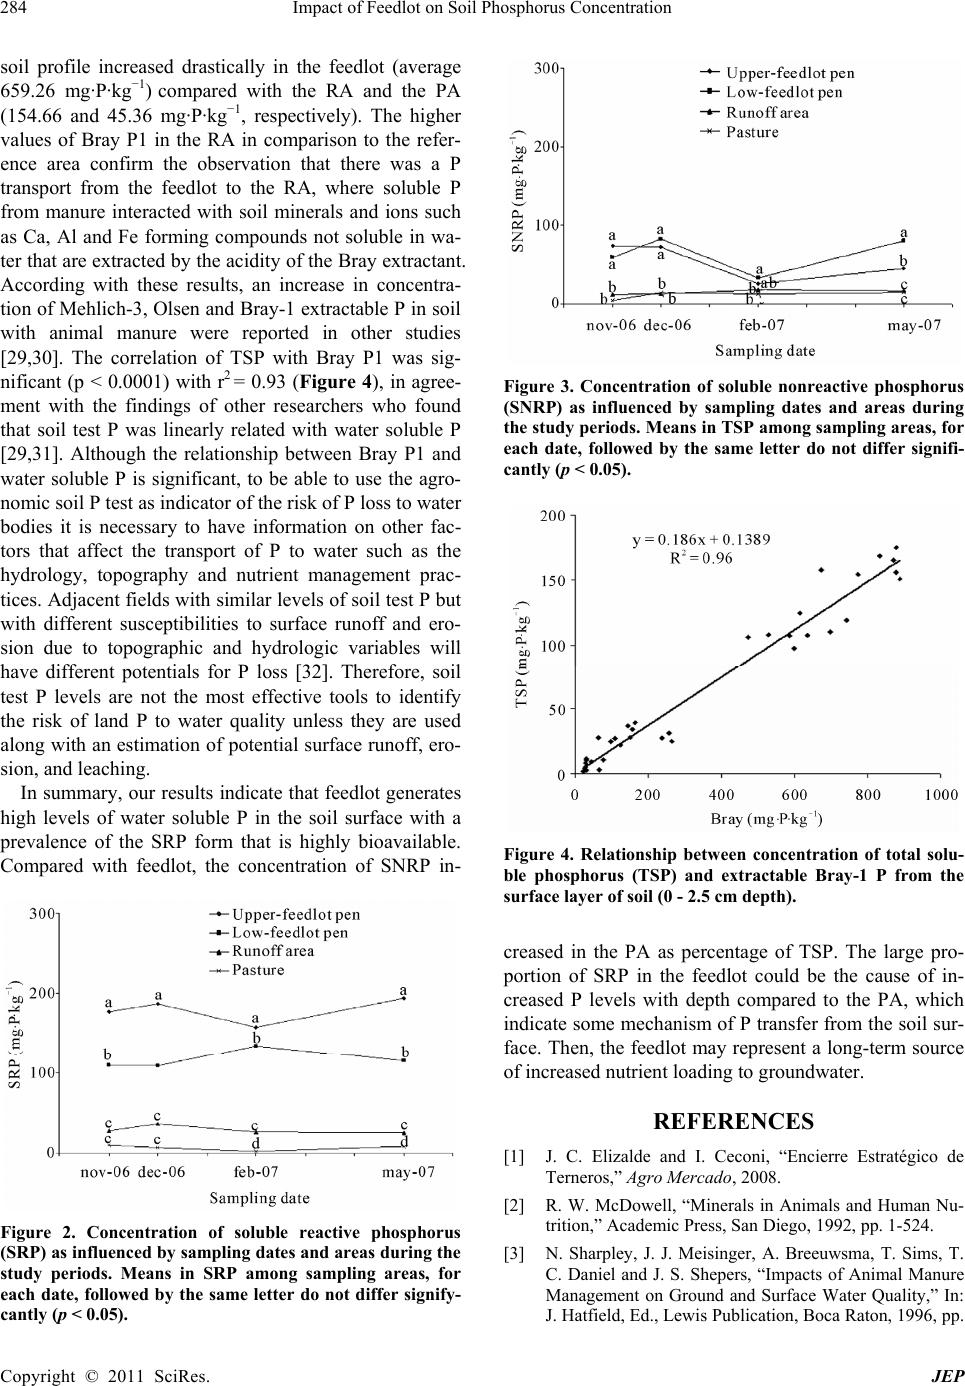 Impact of Feedlot on Soil Phosphorus Concentration 284 soil profile increased drastically in the feedlot (average 659.26 mg·P·kg−1) compared with the RA and the PA (154.66 and 45.36 mg·P·kg−1, respectively). The higher values of Bray P1 in the RA in comparison to the refer- ence area confirm the observation that there was a P transport from the feedlot to the RA, where soluble P from manure interacted with soil minerals and ions such as Ca, Al and Fe forming compounds not soluble in wa- ter that are extracted by the acidity of the Bray extractant. According with these results, an increase in concentra- tion of Mehlich-3, Olsen and Bray-1 extractable P in soil with animal manure were reported in other studies [29,30]. The correlation of TSP with Bray P1 was sig- nificant (p < 0.0001) with r2 = 0.93 (Figure 4), in agree- ment with the findings of other researchers who found that soil test P was linearly related with water soluble P [29,31]. Although the relationship between Bray P1 and water soluble P is significant, to be able to use the agro- nomic soil P test as indicator of the risk of P loss to water bodies it is necessary to have information on other fac- tors that affect the transport of P to water such as the hydrology, topography and nutrient management prac- tices. Adjacent fields with similar levels of soil test P but with different susceptibilities to surface runoff and ero- sion due to topographic and hydrologic variables will have different potentials for P loss [32]. Therefore, soil test P levels are not the most effective tools to identify the risk of land P to water quality unless they are used along with an estimation of potential surface runoff, ero- sion, and leaching. In summary, our results indicate that feedlot generates high levels of water soluble P in the soil surface with a prevalence of the SRP form that is highly bioavailable. Compared with feedlot, the concentration of SNRP in- Figure 2. Concentration of soluble reactive phosphorus (SRP) as influenced by sampling dates and areas during the study periods. Means in SRP among sampling areas, for each date, followed by the same letter do not differ signify- cantly (p < 0.05). Figure 3. Concentration of soluble nonreactive phosphorus (SNRP) as influenced by sampling dates and areas during the study periods. Means in TSP among sampling areas, for each date, followed by the same letter do not differ signifi- cantly (p < 0.05). Figure 4. Relationship between concentration of total solu- ble phosphorus (TSP) and extractable Bray-1 P from the surface layer of soil (0 - 2.5 cm depth). creased in the PA as percentage of TSP. The large pro- portion of SRP in the feedlot could be the cause of in- creased P levels with depth compared to the PA, which indicate some mechanism of P transfer from the soil sur- face. Then, the feedlot may represent a long-term source of increased nutrient loading to groundwater. REFERENCES [1] J. C. Elizalde and I. Ceconi, “Encierre Estratégico de Terneros,” Agro Mercado, 2008. [2] R. W. McDowell, “Minerals in Animals and Human Nu- trition,” Academic Press, San Diego, 1992, pp. 1-524. [3] N. Sharpley, J. J. Meisinger, A. Breeuwsma, T. Sims, T. C. Daniel and J. S. Shepers, “Impacts of Animal Manure Management on Ground and Surface Water Quality,” In: J. Hatfield, Ed., Lewis Publication, Boca Raton, 1996, pp. Copyright © 2011 SciRes. JEP  Impact of Feedlot on Soil Phosphorus Concentration 285 1-50. [4] T. W. Andraski and L. G. Bundy, “Relationship between Phosphorus Levels in Soil and in Runoff from Corn Pro- duction Systems,” Journal of Environmental Quality, Vol. 32, No. 1, 2003, pp. 310-316. doi:10.2134/jeq2003.0310 [5] C. Daverede, A. N. Kravchenko, R. G. Hoeft, E. D. Nafziger, D. G. Bullock, J. J. Warren and L. C. Gonzini, “Phosphorus Runoff: Effect of Tillage and Soil Phospho- rus Levels,” Journal of Environmental Quality, Vol. 32, 2003, pp. 1436-1444. doi:10.2134/jeq2003.1436 [6] H. A. Torbert, T. C. Daniel, J. L. Lemunyon and R. M. Jones, “Relationship of Soil Test Phosphorus and Sam- pling Depth to Runoff Phosphorus in Calcareous and Noncalcareous Soils,” Journal of Environmental Quality, Vol. 31, No. 4, 2002, pp. 1380-1387. doi:10.2134/jeq2002.1380 [7] D. H. Pote, T. C. Daniel, A. N. Sharpley, P. A. Moore, D. R. Edwards and D. J. Nichols, “Relating Extractable Phosphorus to Phosphorus Losses in Runoff,” Soil Sci- ence Society of America Journal, Vol. 60, No. 3, 1996, pp. 855-859. doi:10.2136/sssaj1996.03615995006000030025x [8] J. L. Lemunyon and R. G. Gilbert, “The Concept and Need for a Phosphorus Assessment Tool,” Journal of Production Agriculture, Vol. 6, No. 4, 1993, pp. 483-496. [9] J. Uusi-Kämppä, L. Jauhiainen and A. Huuskonen, “Phosphorus and Nitrogen Losses to Surface Water from a Forested Feedlot for Bulls in Finland,” Soil Use and Management, Vol. 23, No. 1, 2007, pp. 82-91. doi:10.1111/j.1475-2743.2007.00123.x [10] P. J. A. Kleinman, A. N. Sharpley, B. G. Moyer and G. F. Elwinger, “Effect of Mineral and Manure Phosphorus Sources on Runoff Phosphorus,” Journal of Environ- mental Quality, Vol. 31, No. 6, 2002, pp. 2026-2033. [11] S. Kuo, “Phosphorus,” In: D. L. Sparks, Ed., Methods of Soil Analysis, Part 3 SSSA; Book Ser. 5 SSSA, Madison, 1996, pp. 869-920. doi:10.2134/jeq2002.2026 [12] L. J. Murphy and J. P. Riley, “A Modified Single Solu- tion Method for the Determination of Phosphate in Natu- ral Waters,” Analytica Chimica Acta, Vol. 27, No. 3, 1962, pp. 31-36. doi:10.1016/S0003-2670(00)88444-5 [13] R. H. Bray and L. T. Kurtz, “Determination of Total, Organic and Available Forms of Phosphorus in Soils,” Soil Science, Vol. 59, No. 1, 1975, pp. 39-45. doi:10.1097/00010694-194501000-00006 [14] W. I. A. Black, “An Examination of the Degtjareff Method for Determining Soil Organic Matter and a Pro- posed Modification of the Chromic Acid Titration Me- thod,” Soil Science, Vol. 37, No. 1, 1934, pp. 29-37. doi:10.1097/00010694-193401000-00003 [15] J. M. Bremner and C. Mulvaney, “Nitrogen total,” In: A. Page, Ed., Methods of Soil Analysis, Part 2, Agronomy, No. 9, Wisconsin, 1982, pp. 595-624. [16] S. R. Olsen and L. E. Sommers, “Phosphorus,” In: A. Page, Ed., Methods of Soil Analysis, Part 2, Agronomy, No. 9, Wisconsin, 1982, pp. 403-427. [17] SAS Institute, “User’s Guide,” Statistics, SAS Institut, Cary, Vol. 5, 1988. [18] G. S. Toor, B. J. Cade-Menun and J. T. Sims, “Establish- ing a Linkage between Phosphorus Forms in Dairy Diets, Feces and Manure,” Journal of Environmental Quality, Vol. 34, No. 4, 2005, pp. 1380-1391. doi:10.2134/jeq2004.0232 [19] N. Sharpley, S. J. Smith, B. A. Stewart and A. C. Mathers, “Forms of Phosphorus in Soil Receiving Cattle Feedlot Waste,” Journal of Environmental Quality, Vol. 13, No. 2, 1984, pp. 211-215. doi:10.2134/jeq1984.00472425001300020007x [20] J. Lehmann, Z. Lan, C. Hyland, S. Sato, D. Solomon and Q. M. Ketterings, “Long-Term Dynamics of Phosphorus forms and Retention in Manure-Amended Soils,” Envi- ronmental Science & Technology, Vol. 39, No. 17, 2005, pp. 6672-6680. doi:10.1021/es047997g [21] D. M. Webley and D. Jones, “Biological Transformation of Microbial Residues in Soil,” In: A. D. McLaren and J. Skujins, Ed., Soil Biochemistry, McLaren, Marcel Dekker, New York, 1971, Vol. 2, pp. 446-485. [22] R. W. McDowell and G. F. Koopmans, “Assessing the Bioavailability of Dissolved Organic Phosphorus in Pas- ture and Cultivated Soils Treated with Different Rates of Nitrogen Fertilizer,” Soil Biology & Biochemisty, Vol. 38, No. 1, 2006, pp. 61-70. doi:10.1016/j.soilbio.2005.03.026 [23] G. F. Koopmans, W. J. Chardon, J. Dolfing, O. Oenema, P. Van der Meer and W. H. Van Riemsdijk, “Wet Chemi- cal and 31P NMR Analysis of Phosphorus Speciation in a Sandy Soil Receiving Long-Term Fertilizer or Animal manure Applications,” Journal of Environmental Quality, Vol. 32, 2003, pp. 287-295. doi:10.2134/jeq2003.0287 [24] Y. Jiao, J. K. Whalen and W. H Hendershot, “Phosphate Sorption and Release in a Sandy-Loam soil as Influenced by Fertilizer Sources,” Soil Science Society of America Journal, Vol. 71, No. 1, 2007, pp. 118-124. doi:10.2136/sssaj2006.0028 [25] N. Meyer, D. Pingel, C. Dikeman and A. Trenkle, “Phosphorus Excretion of Feedlot Cattle Fed Diets Con- taining Corn or Distillers Coproducts,” Report, A.S. Leaf- let R2123 Iowa State University Animal Industry, 2006. [26] Z. Dou, K. F. Knowlton, R. A. Kohn, Z. Wu, L. D. Satter, G. Zhang, J. D. Toth and J. D. Ferguson, “Phosphorus Characteristics of Dairy Feces Affected by Diets,” Jour- nal of Environmental Quality, Vol. 31, No. 6, 2002, pp. 2058-2065. doi:10.2134/jeq2002.2058 [27] L. N. Mielke, P. Norris and T. M. McCalla, “Soil Profile Conditions of Cattle Feedlots,” Journal of Environmental Quality, Vol. 3, No. 1, 1974, pp. 14-17. doi:10.2134/jeq1974.00472425000300010004x [28] L. N. Mielke and J. R. Ellis, “Nitrogen in Soil Cores and Ground Water under Abandoned Cattle Feedlots,” Jour- nal of Environmental Quality, Vol. 5, No. 1, 1976, pp. 71-75. doi:10.2134/jeq1976.00472425000500010016x [29] N. Sharpley, R. W. McDowell and P. J. A. Kleinman, “Amounts, Forms and Solubility of Phosphorus in Soils Copyright © 2011 SciRes. JEP 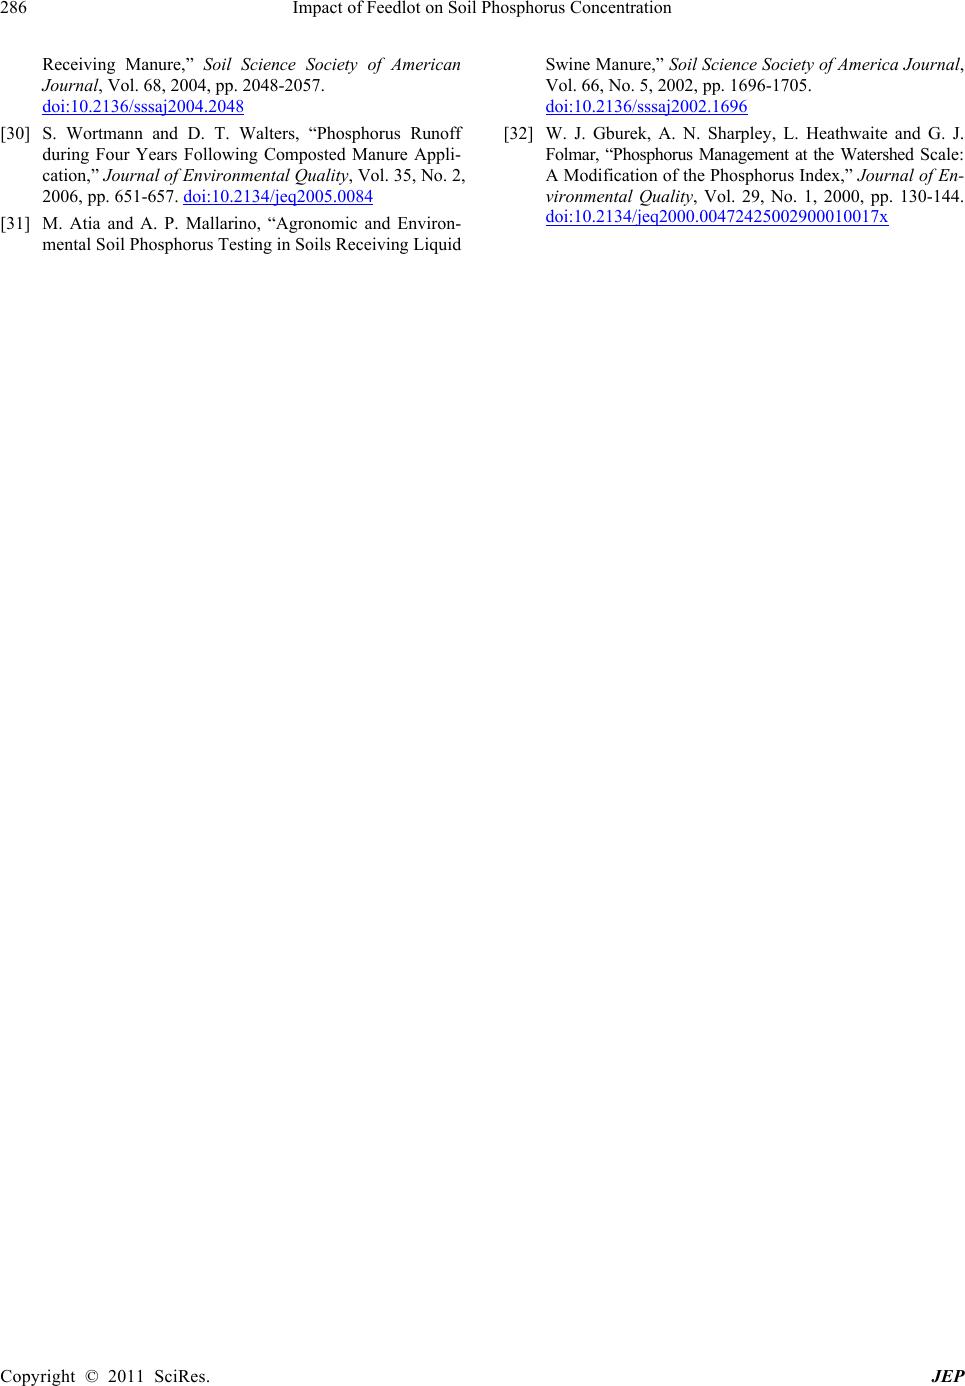 Impact of Feedlot on Soil Phosphorus Concentration Copyright © 2011 SciRes. JEP 286 Receiving Manure,” Soil Science Society of American Journal, Vol. 68, 2004, pp. 2048-2057. doi:10.2136/sssaj2004.2048 [30] S. Wortmann and D. T. Walters, “Phosphorus Runoff during Four Years Following Composted Manure Appli- cation,” Journal of Environmental Quality, Vol. 35, No. 2, 2006, pp. 651-657. doi:10.2134/jeq2005.0084 [31] M. Atia and A. P. Mallarino, “Agronomic and Environ- mental Soil Phosphorus Testing in Soils Receiving Liquid Swine Manure,” Soil Science Society of America Journal, Vol. 66, No. 5, 2002, pp. 1696-1705. doi:10.2136/sssaj2002.1696 [32] W. J. Gburek, A. N. Sharpley, L. Heathwaite and G. J. Folmar, “Phosphorus Management at the Watershed Scale: A Modification of the Phosphorus Index,” Journal of En- vironmental Quality, Vol. 29, No. 1, 2000, pp. 130-144. doi:10.2134/jeq2000.00472425002900010017x |