 Journal of Computer and Communications, 2014, 2, 70-77 Published Online July 2014 in SciRes. http://www.scirp.org/journal/jcc http://dx.doi.org/10.4236/jcc.2014.29010 How to cite this paper: Wei, Y., Tao, X.P., Xu, B. and Castelein, A.P. (2014) Paraspinal Muscle Segmentation in CT Images Using GSM-Based Fuzzy C-Means Clustering. Journal of Computer and Communications, 2, 70-77. http://dx.doi.org/10.4236/jcc.2014.29010 Paraspinal Muscle Segmentation in CT Images Using GSM-Based Fuzzy C-Means Clustering Yong Wei1, Xiuping Tao2, Bin Xu3*, Arend P. Castelein1 1Depart men t of Computer Science and Information Systems, University of North Georgia, Dahlonega, USA 2Depart men t of Chemistry, Winston-Salem State University, Winston-Salem, USA 3Depart men t of Spine Surgery, Jinling Hospital, School of Medicine, Nanjing University, Nanjing, China Email: *xubin2020@gmail.com Received April 2014 Abstract Minimally Invasive Spine surgery (MISS) was developed to treat disorders of the spine with less disruption to the muscles. Surgeons use CT images to monitor the volume of muscles after opera- tion in order to evaluate the progress of patient recovery. The first step in the task is to segment the muscle regions from other tissues/organs in CT images. However, manual segmentation of muscle regions is not only inaccurate, but also time consuming. In this work, Gray Space Map (GSM) is used in fuzzy c-means clustering algorithm to segment muscle regions in CT images. GSM com- bines both spatial and intensity information of pixels. Experiments show that the proposed GSM- based fuzzy c-means clustering muscle CT image segmentation yields very good results. Keywords CT Image, Segment ation, Gray Space Map (GSM), Fuzzy C-Means Clustering, Minimally Invasive Spine Surgery (MISS) 1. Introduction For patients with spine disorders such as lumbar spondylolisthesis, instability and spinal stenosis, surgery is one of the options for treatment. The traditional transforaminal lumbar interbody fusion (TLIF) and posterior lumbar interbody fusion (PLIF) require a wide decompression and bilateral nerve-root retraction to access the disc space [1]. Minimally Invasive Spine surgery (MISS) was developed to decrease postoperative pain and allow quicker recovery by limiting soft-tissue retraction and dissection [2]. One of the main goals of MISS is to reduce trauma to the two posterior paraspinal muscle groups, including the deep paramedian transversospinalis muscle group and the more superficial and lateral erector spine muscles [2]. Researchers have been using magnetic resonance imaging (MRI) to assess the postsurgical appearance of the multifidus muscle [3], and compared muscle dam- ages in two groups of patients treated with a posterior lumbar interbody fusion, those who had had a traditional * 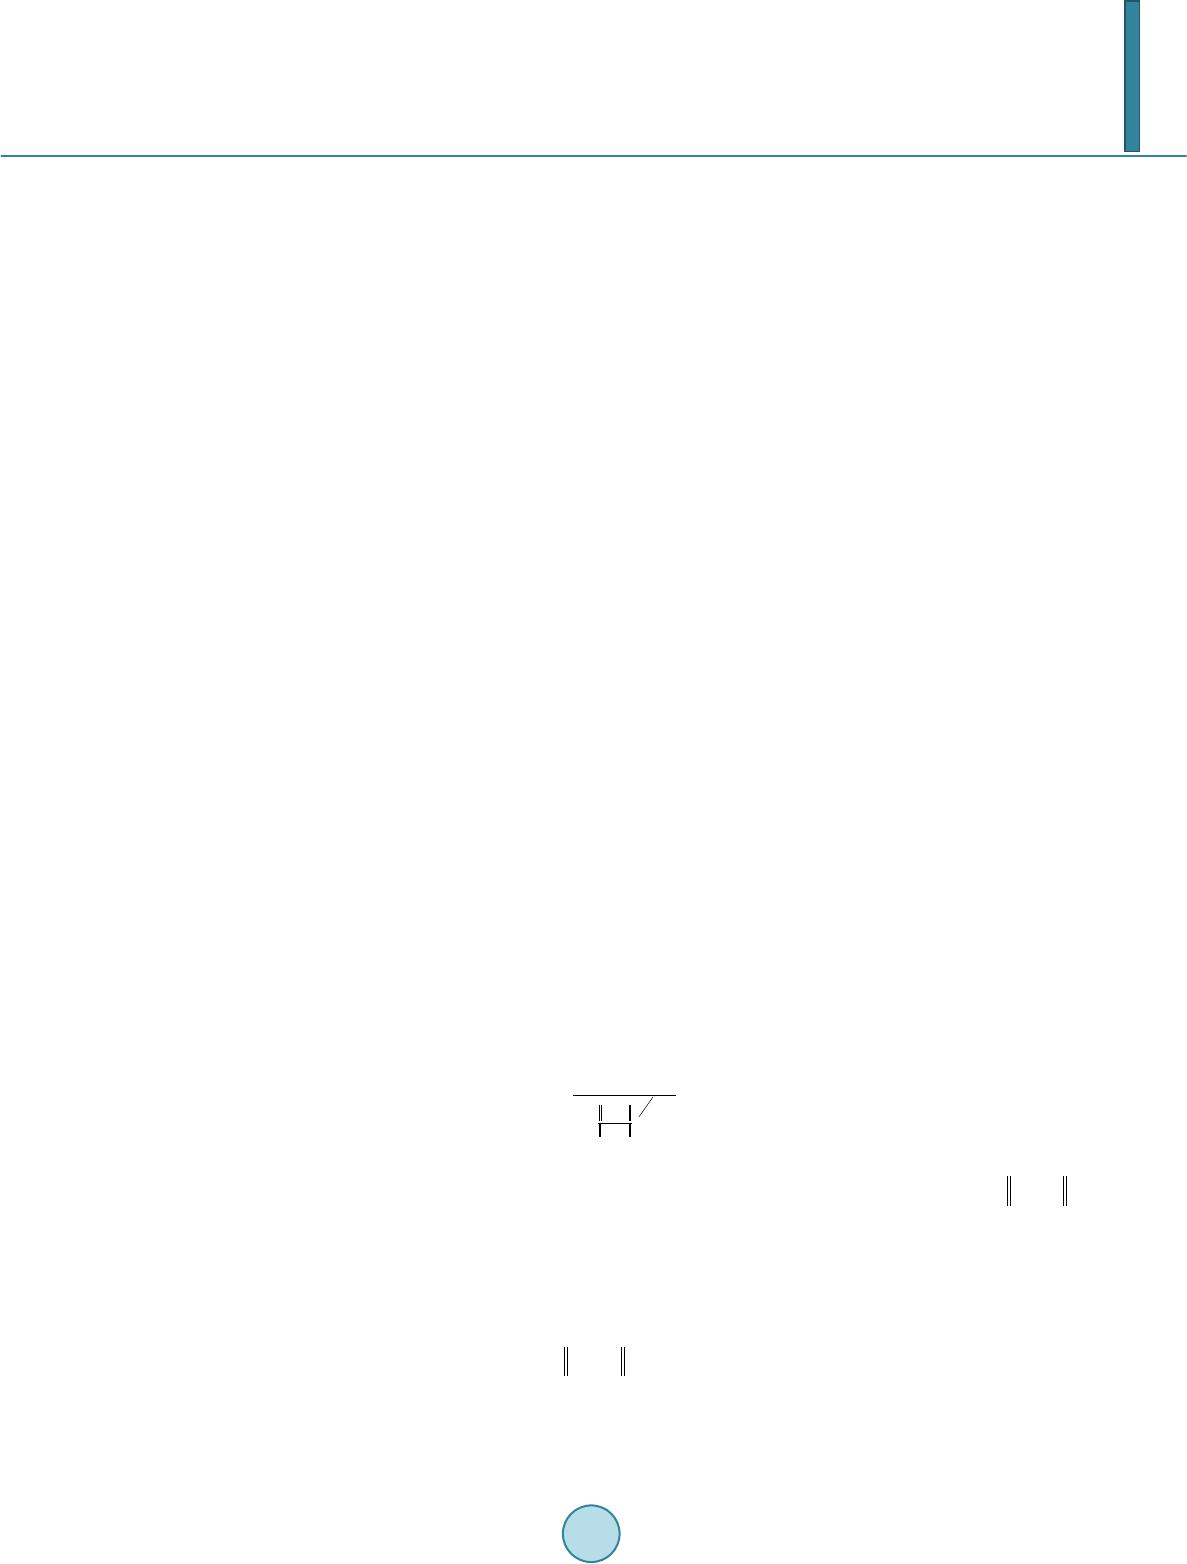 Y. Wei et al. midline approach and those who had had a Wiltse approach [4]. Physicians can use the computed tomography (CT) images to estimate volume of muscles surrounding the spine before and after the operation. The thickness of reconstruction of CT slices is determined during scanning. If the size of muscle region in CT images can be measured, the volumetric estimation of muscle tissues sur- rounding the spine can be obtained by calculating the sum of the products of the slice thickness and the muscle region size of each CT slice. Hence, segmenting the muscle region in CT images becomes the key step in the procedure. In a CT image the intensity is a grey value representing the attenuation in the voxel [5]. A voxel is a small rectangular pixel in three dimensions. The gray level intensity of a pixel in a CT image is determined by the Hounsfield number [6]. The Hounsfield number specifies the attenuation in the material in relation to the attenu- ation in water. The coefficient is material specific and a certain material thereby results in a certain pixel value in a CT image. The task of image segmentation is to group pixels into regions for future processes. In each partitioned region of an image, pixels have similar characteristics based on given criteria. It is assumed that characteristics of pix- els in different tissue object within an image will present themselves as clusters. Therefore segmenting tissue object in a CT image becomes the problem of finding a set of clusters. The k-means algorithm is the most commonly used clustering algorithm since it is easy to implement and found to be effective in many applications. The fuzzy version of k-means clustering (fuzzy c-means, FCM) is widely adopted for medical image segmentation [7]-[9]. Unlike the k-means clustering method, which forces pixels to belong to one class, FCM classifies pixels to belong to multiple classes with degrees of membership. The advantage of FCM-based segmentation algorithm over thresholding is that there is no need to choose the empirical threshold. This feature is useful especially when large amount of images are processed. In this work, Gray Space Map (GSM) is introduced to be used by the fuzzy c-mean segmentation algorithm to incorporate both pixel intensity and region connectivity information. The CT images are from patients who have had minimally invasive spine surgery. Experimental results show that the FCM-based image segmentation algo- rithm incorporated with GSM yields promising results. Segmented posterior paraspinal muscle regions can be used to estimate volume of muscles in order to evaluate damages to them after spine surgery. The remainder of the paper is as follows. Section 2 provides a brief description of the challenges in muscle region segmentation on CT images and the proposed fuzzy c-means segmentation algorithm using GSM. Section 3 discusses the experimental data preparation and results. Section 4 concludes the paper with an outline for fu- ture work. 2. Paraspinal Muscle Region Segmentation 2.1. Fuzzy C-Mean Clustering Fuzzy c-means (FCM) is a clustering method that allows a data point to belong to more than one cluster. Each point has a degree of belonging to a cluster. The membership function is defined as below: ( ) 21 1 1 m Cxc ij xc ik k ij u− − − = ∑ = , (2.1) where is the degree of data point in cluster , , is the center of cluster . represents the Euclidean distance between data point and cluster center . C is the total number of clusters. Parameter m is a weighting exponent on each membership and controls the shape of the fuzzy membership func- tion. When the value of m approaches 1, the algorithm becomes similar to k-means. The FCM algorithm mini- mizes the following objective function: , (2.2) where N and C are the total number of data points and clusters respectively. 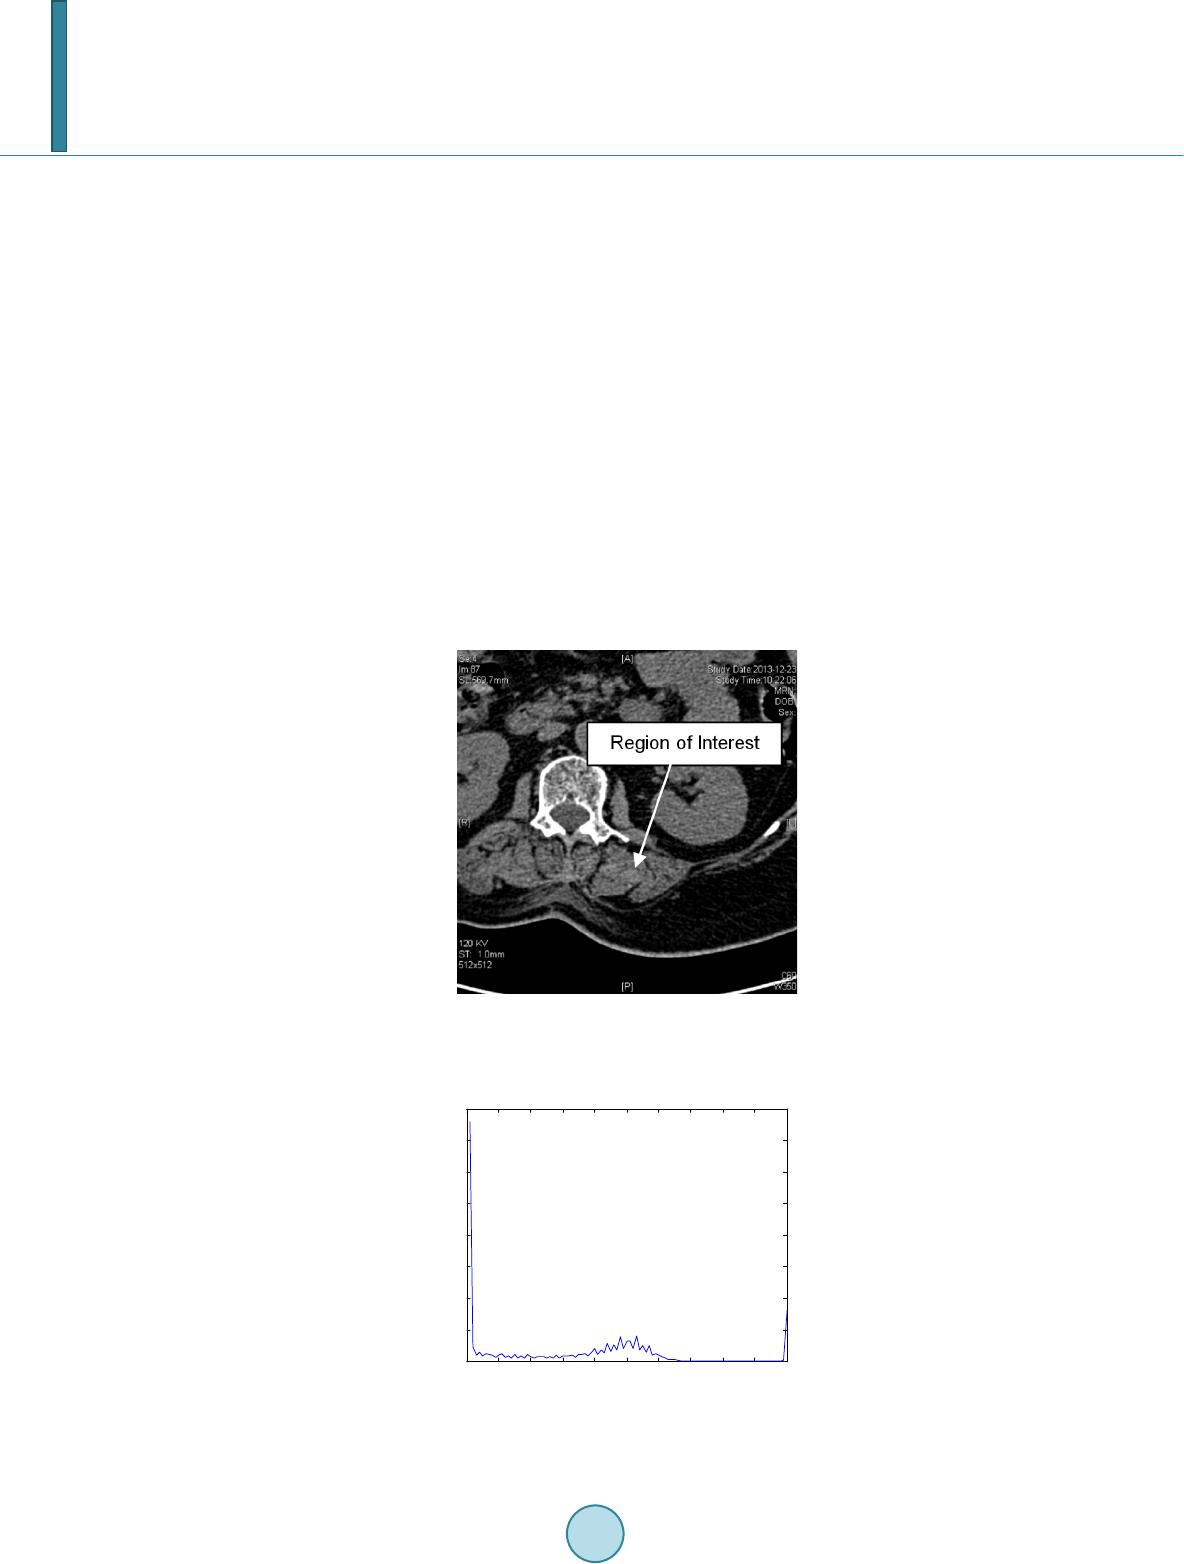 Y. Wei et al. 2.2. Challenges of Paraspinal Muscle Region Segmentation in CT Images Figure 1 is a CT image obtained from a patient who has had a minimal invasive spine surgery. In the image, there are paraspinal muscles, spine and other tissues and organs. The histogram of the image (Figure 2) shows that the intensities of the region of interest and other tissues/organs are similar, i.e. no obvious threshold of in- tensity could distinguish other tissues from the region of interest. In order to incorporate spatial information of pixels in the ROI, we can select an initial seed point within the ROI. Figures 3-6 are visualizations of the ROI using various parameters. Figure 3 is a map of spatial Euclidean distance from the seed point to other pixels. It does not reflect the dimension or shape of the muscle group. Fig- ure 4 is the Euclidean distance map from the initial seed in the Gray level space. The map shows that the muscle group region has similar parameter values to other soft tissues and organs, such as kidneys. The map based on the mean Euclidean distance in Gray level space from a window centered in the initial seed to all the other win- dows centered in all the other pixels in the image is shown in Figure 5. Window size is 7 × 7. It is similar to Figure 4 except that the map is blurred because of the averaging operation. Statistical feature such as standard derivation of pixel gray intensity values does not help in segmenting the region of muscles neither as shown in Figure 6. 2.3. Gray Space Map (GSM) The Gray Space Map (GSM) uses image topological information. The assumption for GSM is that pixels inside Figure 1. CT Image of a MISS Patient, show- ing paraspinal muscles and other tissues and organs. Figure 2. Histogram of the CT Image in Fig- ure 1. 010 2030 4050 60 7080 90100 0 1 2 3 4 5 6 7 8x 10 4 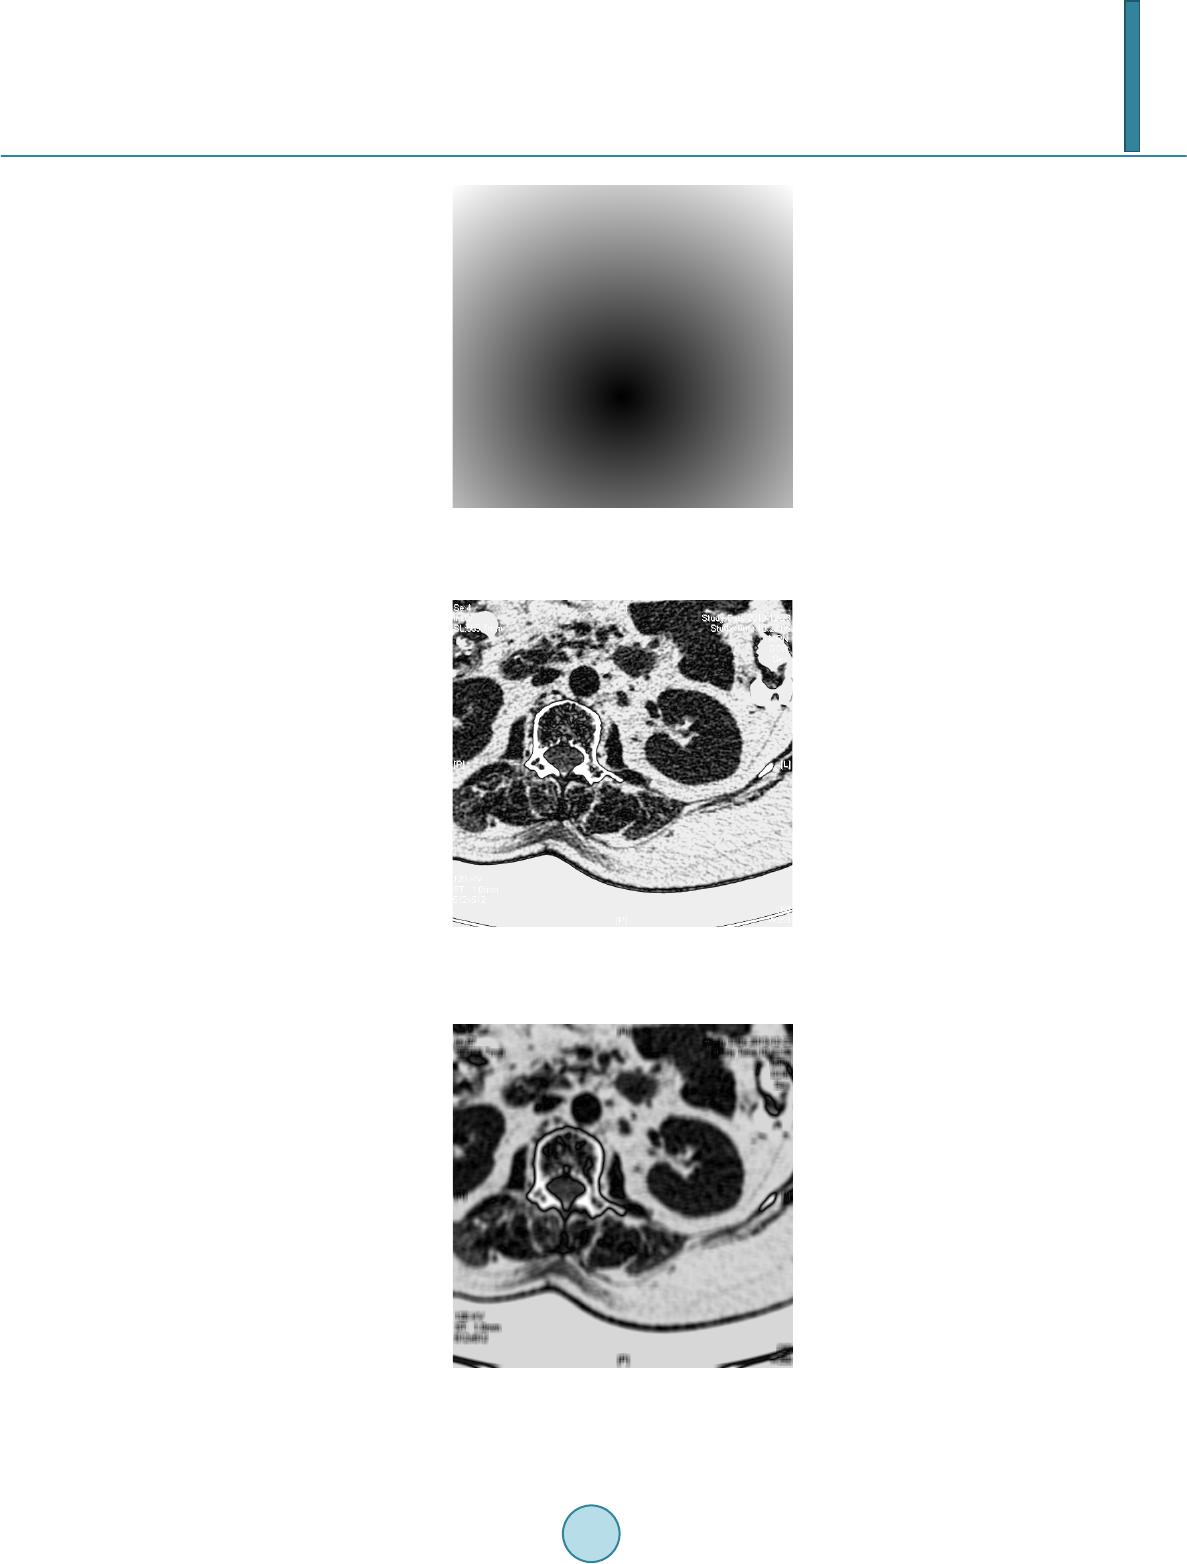 Y. Wei et al. Figure 3. Spatial Euclidean distance map from the initial seed. Figure 4. Gray intensity Euclidean distance map from the initial seed. Figure 5. Gray intensity mean Euclidean dis- tance map from the initial seed, window size is 7 × 7.  Y. Wei et al. Figure 6. Standard derivation distance map between the initial seed and other pixels, win- dow size is 7 × 7. the region of interest not only have similar gray level intensities but also connect to other pixels inside the region [10]. It is necessary to emphasize that it is not assumed that pixels in other regions have different intensity val- ues from pixels inside ROI. This is important because as we have seen, other tissues and organs have similar gray level values as the region of muscles. The algorithm starts with a pre-selected seed point inside the region of interest. Initial values of all pixels in the image are set to zero. During each iteration, the GSM values of pixels which satisfy both of the following conditions are incremented by 1. Condition 1: pixel gray level intensity difference from the seed point is within a threshold T; Condition 2: the pixel belongs to a structure which overlaps the seed point. The GSM values are defined in the following equation. ( )() max 0 , ,, I T GSMij gijT = = ∑ whe r e if AND () ( ) ,xy I i jIseedseedT − −≤ ; Otherwise, (2.3) In Equation (2.3), pixel belongs to gray level image I. T is a threshold of gray level intensity differ- ence between the seed point and other pixels. Threshold T starts from zero up to the maximum possible value for the pixel value data type . If the data type is an unsigned eight bit integer, is 255. is a region overlapping the seed point within threshold T. In our calculation, is normalized to the range of . Pixels connected to the seed point with similar gray level intensities are assigned higher GSM values than other pixels. In Figure 7, the region of paraspinal muscle group is clearly differentiated from other regions. The histogram of the GSM image (Figure 8) shows pixels whose GSM values are greater than the red line belong to the paraspinal muscle region. Comparison of histogram of gray intensities in Figure 1 with that of GSM in Figure 8 confirms that GSM is useful in segmenting muscle region from other tissue s 3. Experimental Results Images used in experiments are extracted from axial spinal CT scans of patients who have had minimal invasive spinal surgery. SL represents the axial spatial location of the slice. ST is the slice thickness. Resolution of the images is 512 × 512. Objects in an image include the paraspinal muscle groups, kidney, liver, pancreas, spine 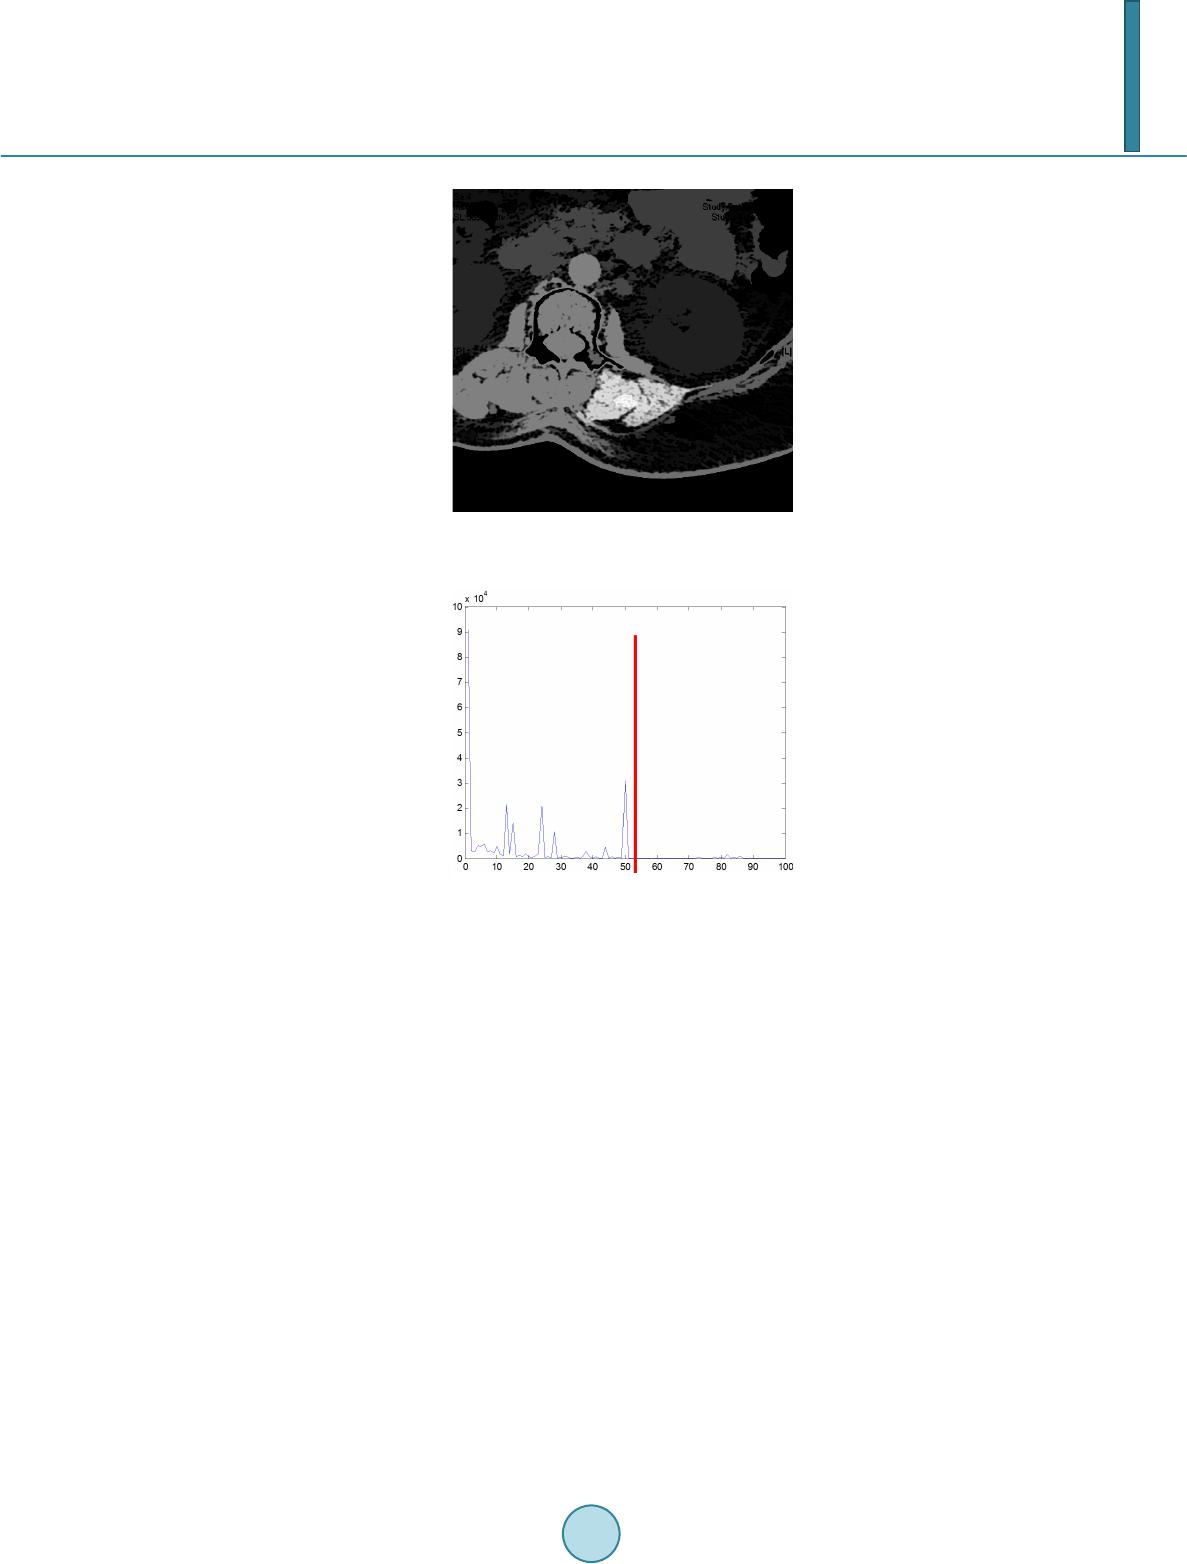 Y. Wei et al. Figure 7. GSM visualization of the CT image illustrated in Figure 2. Figure 8. Histogram of the GSM image of the CT image illustrated in Figure 2. and other tissues. CT image pixel values are determined by the Hounsfield coefficient of material. Hounsfield units of some related substances [11] are shown in Table 1. In a CT image, it is easy to differentiate muscle from fat and bones using gray intensities. However, the HU interval of muscles overlaps with organs such as kidney, liver and pancreas, making it difficult to segment the muscle region from other tissues using gray inten- sity alone. Hence topological information should be incorporated in the segmentation algorithm. To reduce the effect of the initial seed selection, images are dilated. The user chooses an initial seed point within the interested region, i.e. the paraspinal muscle region. GSM is calculated and normalized to range . For an image of size , . The input to the FCM clustering algorithm is a sequence of , , where is the GSM value of pixel k in the image. Figure 9 shows a set of segmentation results. Figure 9(a) shows the region of longissimus muscle and iliocostal muscle, which is the interested region. Or- gan in Figure 9(b) is part of the gastrointestinal tract. Both Figure 9(c) and Figure 9(d) show images of kid- neys. In Fig ure 9(e) and Figure 9(f), main tissues are psoas major, descending aorta, vertebral body and the right side of sacrospinalis. Figure 9(h) sho ws the segmented region with the boundary highlighted. 4. Conclusions In this paper, we use the GSM-based fuzzy c-means algorithm to perform CT image paraspinal muscle segmen- tation to estimate muscle volume for patients who have had minimal invasive spinal surgery. Muscle tissues have similar Hounsfield unit values with other organs. Thus using gray intensity alone cannot differentiate mus- cles from other tissues. GSM utilizes both gray level intensity and image topological information. It is a prom- ising candidate as a predicate used for segmentation. 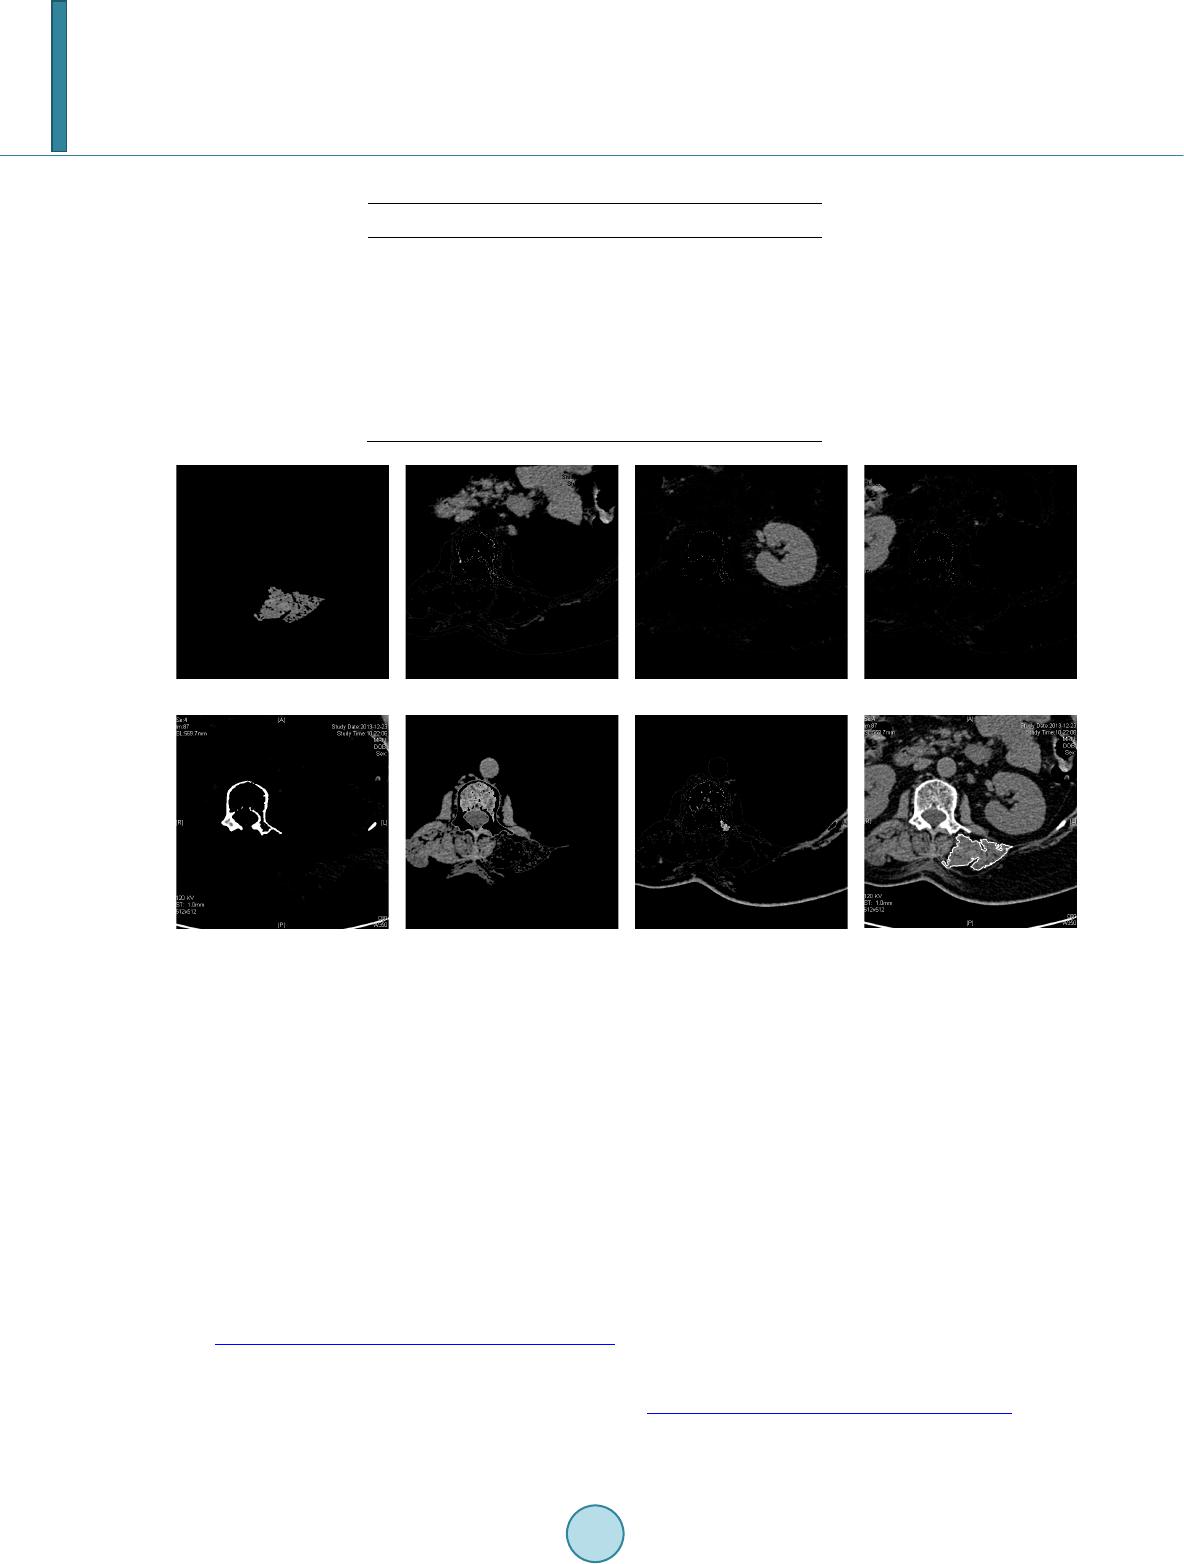 Y. Wei et al. Table 1. Hounsfield unit value ranges of tissues. Tissue Type HU Value Range Muscle 10 - 40 Bones 45 - 3000 Kidney 30 - 50 Li v er 20 - 60 Pancreas 10 - 40 Fat −220 - −30 (a) (b) (c) (d) (e) (f) (g) (h) Figure 9. Segmentation results. Experimental results show that fuzzy c-means segmentation using GSM can effectively segment paraspinal muscle regions. It provides a solid foundation for muscle volume estimation for physicians to evaluate muscle damage due to spine surgery and monitor the progress of patient recovery. In the future, the technique will be tested on large amount of image data. References [1] Harms , J. G. and Jeszensky, D. (1998) The Unilateral Transforaminal Approach for Posterior Lumbar Interbody Fusion. Journal of Orthopaedics and Traumatology, 6, 88-99. [2] Kim, C., Siemionow, K., Anderson, D. and Phillips, F. (2011) The Current State of Minimally Invasive Spine Surgery. Journal of Bone & Joint Surgery, 93-A, 582-596. [3] Stevens, K.J., Spenciner, D.B., Griffiths, K.L., Kim, K.D., Zwienenberg-Lee, M., Alamin, T. and Bammer, R. (2006) Comparison of Minimally Invasive and Conventional Open Posterolateral Lumbar Fusion Using Magnetic Resonance Imaging and Retraction Pressure Studies. Journal of Spinal Disorders Techniques, 19, 77-86. http://dx.doi.org/10.1097/01.bsd.0000193820.42522.d9 [4] Tsutsumimoto, T., Shimogata, M., Ohta, H. and Misawa, H. (2009) M ini -Open versus Conventional Open Posterior Lumbar Interbody Fusion for the Treatment of Lumbar Degenerative Spondylolisthesis: Comparison of Paraspinal Muscle Damage and Slip Reduction . Spine, 34, 1923-19 28 . http://dx.doi.org/10.1097/BRS.0b013e3181a9d28e [5] Langheinrich, A.C., Kampschulte, M., Crößmann, C., Moritz, R., Rau, W.S., Bohle, R.M. and Ritman, E.L. (2009)  Y. Wei et al. Role of Computed Tomography Voxel Size in Detection and Discrimination of Calcium and Iron Deposits in Atheros- clerotic Human Coronary Artery Specimen s. Journal of Computer Assisted Tomography, 33, 517-522 . http://dx.doi.org/10.1097/RCT.0b013e318194c0a2 [6] Jiang, H., Seco, J. and Paganettib, H. (2007 ) Effects of Hounsfield Number Conversion on CT Based Proton Monte Carlo Dose Calculations. Medical Physics, 34, 1439-1449. http://dx.doi.org/10.1118/1.2715481 [7] Zhao, Y.Q., Zan, Y.L., Wang, X.F. and Li, G.Y. (2010) Fuzzy C-means Clustering-Based Multilayer Perception Neu- ral Network for Liver CT Images Automatic Segmentation. Control and Decision Conference (CCDC), Xuzhou, May 2010, 3423-3427. [8] Li, X., Luo, S. and Li, J. (2013) Liver Segmentation from CT Image Using Fuzzy Clustering and Level Set. Journal of Signal and Information Processing, 4, 36-42. http://dx.doi.org/10.4236/jsip.2013.43B007 [9] Chuang, K., Tzen g, H., Chen, S., Wu, J. and Chen, T. (2006) Fuzzy C-Means Clustering with Spatial Information for Image Segmentation. Computerized Medical Imaging and Graphics, 30, 9-15. http://dx.doi.org/10.1016/j.compmedimag.2005.10.001 [10] Mancas, M. Gosselin, B. and Macq, B. (2005) Segmentation Using a Region Growing Thresholding. Proceedings of the Electronic Imaging Conference of the International Society for Optical Imaging (SPIE/EI). [11] Per i m, B. and Bartz, D. (2007) Visualization in Medicine: Theory, Algorithms, and Applications. Morgan Kaufmann.
|