Paper Menu >>
Journal Menu >>
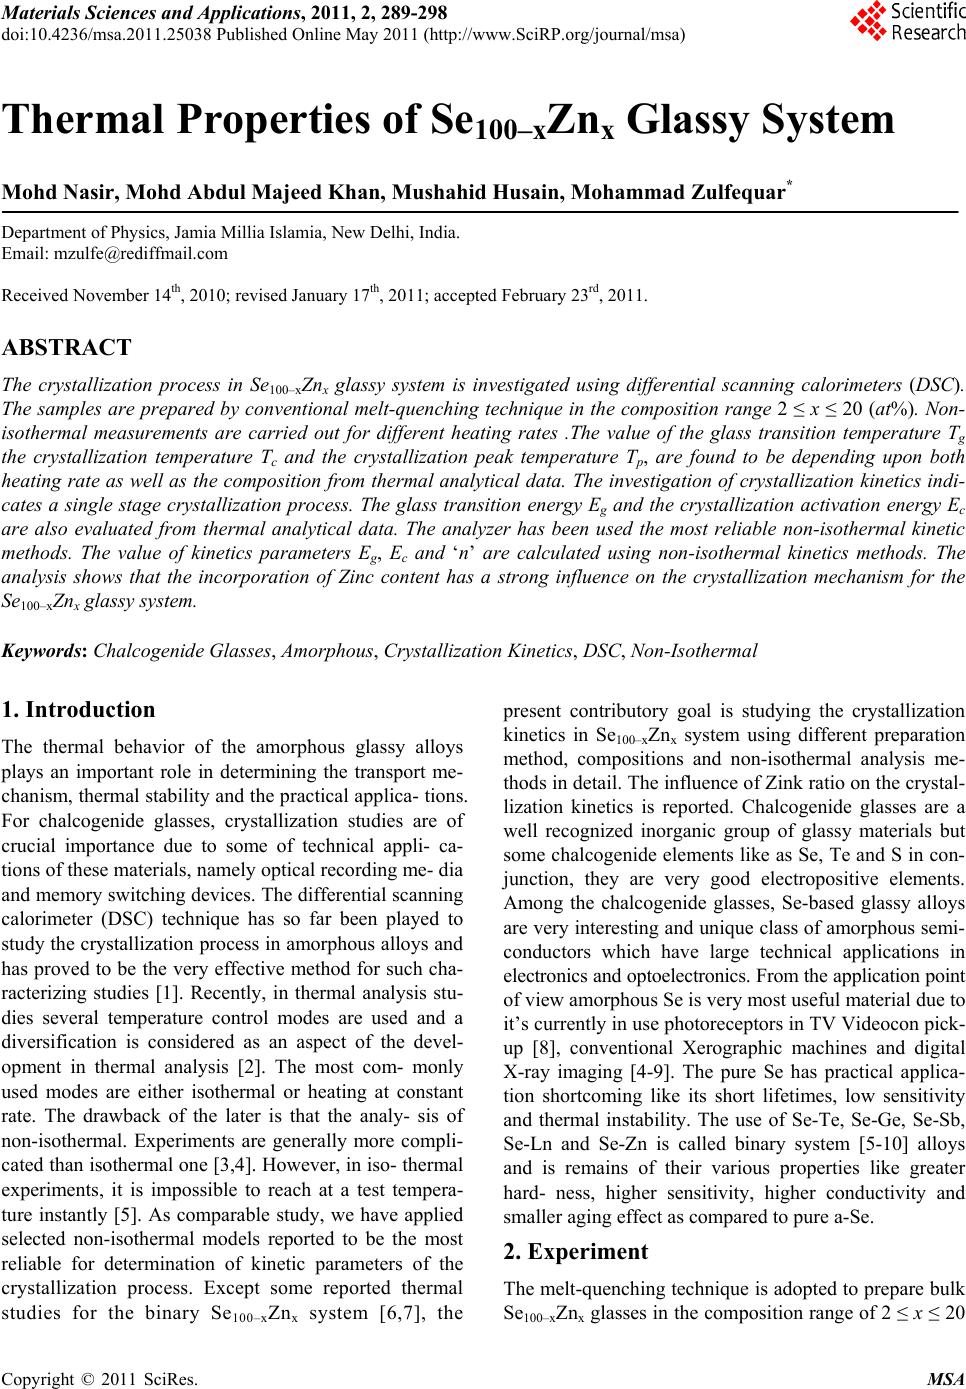 Materials Sciences and Applications, 2011, 2, 289-298 doi:10.4236/msa.2011.25038 Published Online May 2011 (http://www.SciRP.org/journal/msa) Copyright © 2011 SciRes. MSA 289 Thermal Properties of Se100–xZnx Glassy System Mohd Nasir, Mohd Abdul Majeed Khan, Mushahid Husain, Mohammad Zulfequar* Department of Physics, Jamia Millia Islamia, New Delhi, India. Email: mzulfe@rediffmail.com Received November 14th, 2010; revised January 17th, 2011; accepted February 23rd, 2011. ABSTRACT The crystallization process in Se100–xZnx glassy system is investigated using differential scanning calorimeters (DSC). The samples are prepared by conventional melt-quenching technique in the composition range 2 ≤ x ≤ 20 (at%). Non- isothermal measurements are carried out for different heating rates .The value of the glass transition temperature Tg the crystallization temperature Tc and the crystallization peak temperature Tp, are found to be depending upon both heating rate as well as the composition from thermal analytical data. The investigation of crystallization kinetics indi- cates a single stage crystallization process. The glass transition energy Eg and the crystallization activation energy Ec are also evaluated from thermal analytical data. The analyzer has been used the most reliable non-isothermal kinetic methods. The value of kinetics parameters Eg, E c and ‘n’ are calculated using non-isothermal kinetics methods. The analysis shows that the incorporation of Zinc content has a strong influence on the crystallization mechanism for the Se100–xZnx glassy system. Keywords: Chalcogenide Glasses, Amorphous, Crystallization Kinetics, DSC, Non-Isothermal 1. Introduction The thermal behavior of the amorphous glassy alloys plays an important role in determining the transport me- chanism, thermal stability and the practical applica- tions. For chalcogenide glasses, crystallization studies are of crucial importance due to some of technical appli- ca- tions of these materials, namely optical recording me- dia and memory switching devices. The differential scanning calorimeter (DSC) technique has so far been played to study the crystallization process in amorphous alloys and has proved to be the very effective method for such cha- racterizing studies [1]. Recently, in thermal analysis stu- dies several temperature control modes are used and a diversification is considered as an aspect of the devel- opment in thermal analysis [2]. The most com- monly used modes are either isothermal or heating at constant rate. The drawback of the later is that the analy- sis of non-isothermal. Experiments are generally more compli- cated than isothermal one [3,4]. However, in iso- thermal experiments, it is impossible to reach at a test tempera- ture instantly [5]. As comparable study, we have applied selected non-isothermal models reported to be the most reliable for determination of kinetic parameters of the crystallization process. Except some reported thermal studies for the binary Se100–xZnx system [6,7], the present contributory goal is studying the crystallization kinetics in Se100–xZnx system using different preparation method, compositions and non-isothermal analysis me- thods in detail. The influence of Zink ratio on the crystal- lization kinetics is reported. Chalcogenide glasses are a well recognized inorganic group of glassy materials but some chalcogenide elements like as Se, Te and S in con- junction, they are very good electropositive elements. Among the chalcogenide glasses, Se-based glassy alloys are very interesting and unique class of amorphous semi- conductors which have large technical applications in electronics and optoelectronics. From the application point of view amorphous Se is very most useful material due to it’s currently in use photoreceptors in TV Videocon pick- up [8], conventional Xerographic machines and digital X-ray imaging [4-9]. The pure Se has practical applica- tion shortcoming like its short lifetimes, low sensitivity and thermal instability. The use of Se-Te, Se-Ge, Se-Sb, Se-Ln and Se-Zn is called binary system [5-10] alloys and is remains of their various properties like greater hard- ness, higher sensitivity, higher conductivity and smaller aging effect as compared to pure a-Se. 2. Experiment The melt-quenching technique is adopted to prepare bulk Se100–xZnx glasses in the composition range of 2 ≤ x ≤ 20 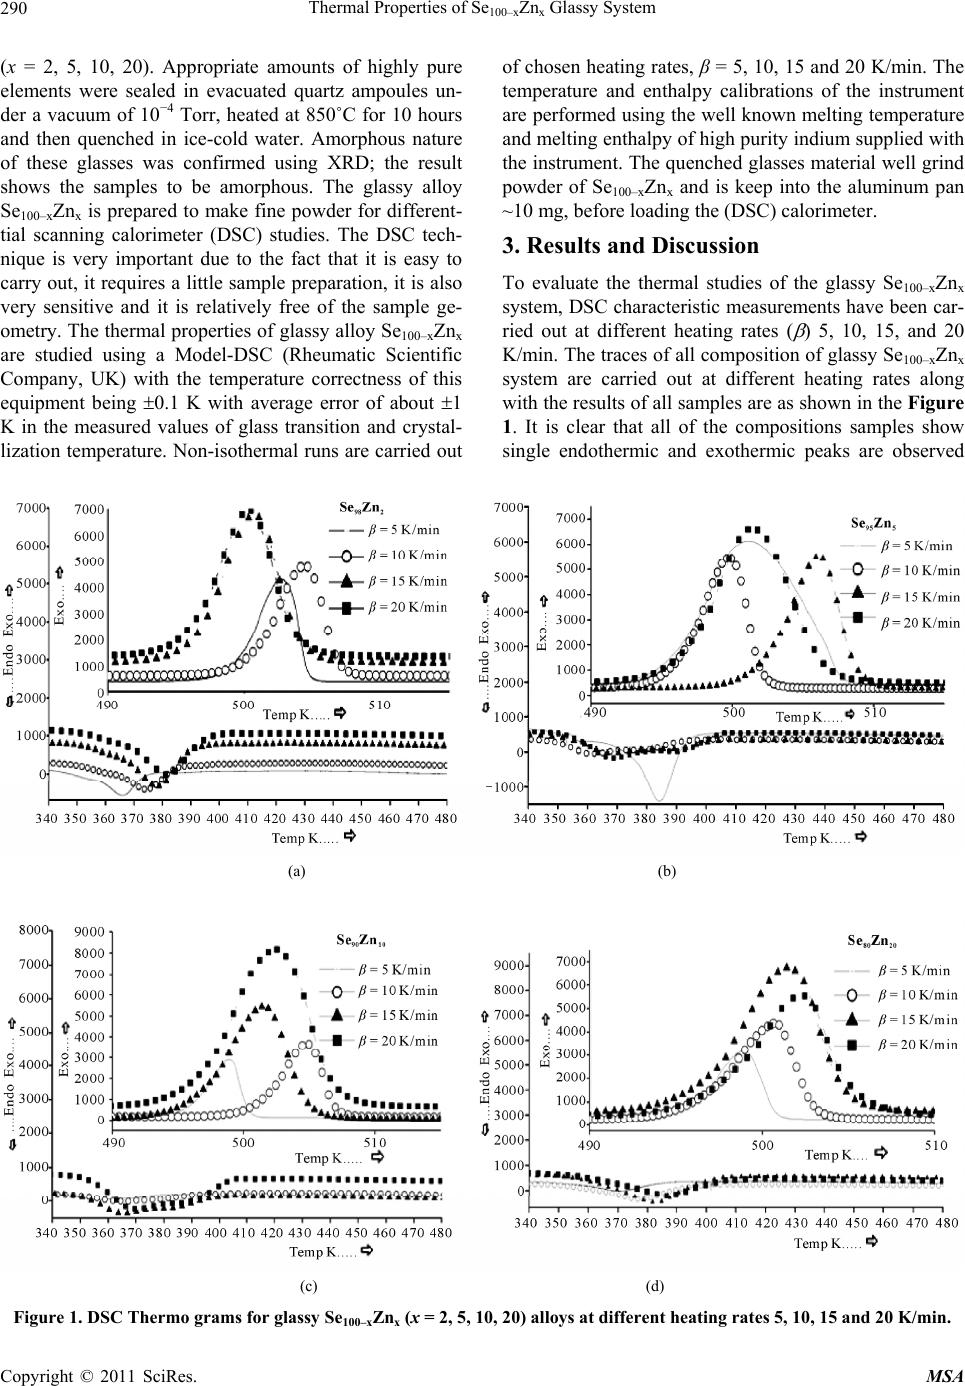 Thermal Properties of Se100–xZnx Glassy System Copyright © 2011 SciRes. MSA 290 (x = 2, 5, 10, 20). Appropriate amounts of highly pure elements were sealed in evacuated quartz ampoules un- der a vacuum of 10−4 Torr, heated at 850˚C for 10 hours and then quenched in ice-cold water. Amorphous nature of these glasses was confirmed using XRD; the result shows the samples to be amorphous. The glassy alloy Se100–xZnx is prepared to make fine powder for different- tial scanning calorimeter (DSC) studies. The DSC tech- nique is very important due to the fact that it is easy to carry out, it requires a little sample preparation, it is also very sensitive and it is relatively free of the sample ge- ometry. The thermal properties of glassy alloy Se100–xZnx are studied using a Model-DSC (Rheumatic Scientific Company, UK) with the temperature correctness of this equipment being 0.1 K with average error of about 1 K in the measured values of glass transition and crystal- lization temperature. Non-isothermal runs are carried out of chosen heating rates, β = 5, 10, 15 and 20 K/min. The temperature and enthalpy calibrations of the instrument are performed using the well known melting temperature and melting enthalpy of high purity indium supplied with the instrument. The quenched glasses material well grind powder of Se100–xZnx and is keep into the aluminum pan ~10 mg, before loading the (DSC) calorimeter. 3. Results and Discussion To evaluate the thermal studies of the glassy Se100–xZnx system, DSC characteristic measurements have been car- ried out at different heating rates ( ) 5, 10, 15, and 20 K/min. The traces of all composition of glassy Se100–xZnx system are carried out at different heating rates along with the results of all samples are as shown in the Figure 1. It is clear that all of the compositions samples show single endothermic and exothermic peaks are observed (a) (b) (c) (d) Figure 1. DSC Thermo grams for glassy Se100–xZnx (x = 2, 5, 10, 20) alloys at different heating rates 5, 10, 15 and 20 K/min. 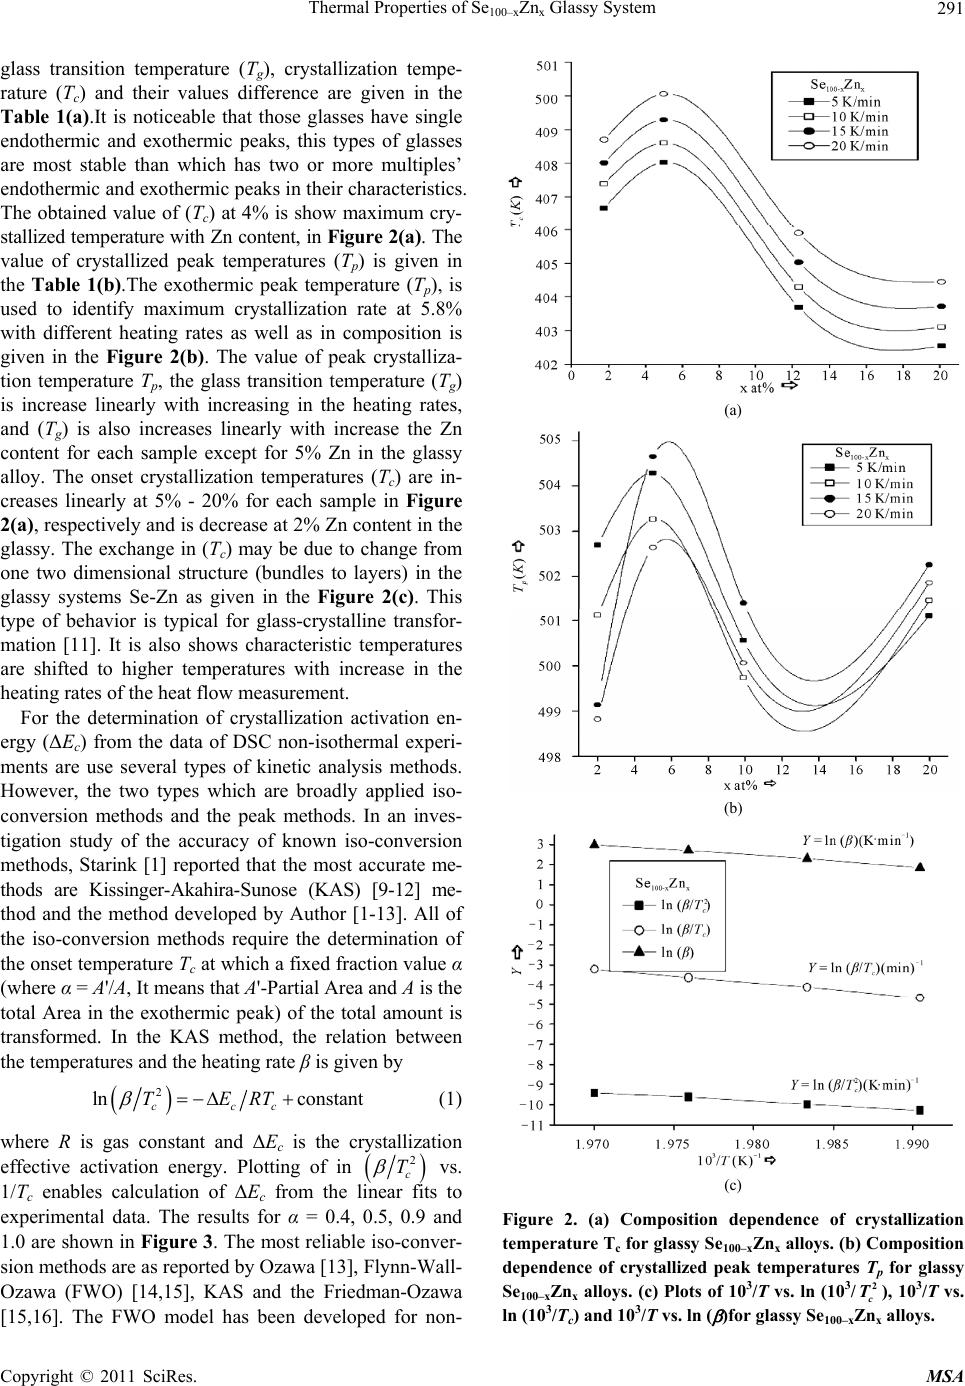 Thermal Properties of Se100–xZnx Glassy System Copyright © 2011 SciRes. MSA 291 glass transition temperature (Tg), crystallization tempe- rature (Tc) and their values difference are given in the Table 1(a).It is noticeable that those glasses have single endothermic and exothermic peaks, this types of glasses are most stable than which has two or more multiples’ endothermic and exothermic peaks in their characteristics. The obtained value of (Tc) at 4% is show maximum cry- stallized temperature with Zn content, in Figure 2(a). The value of crystallized peak temperatures (Tp) is given in the Table 1(b).The exothermic peak temperature (Tp), is used to identify maximum crystallization rate at 5.8% with different heating rates as well as in composition is given in the Figure 2(b). The value of peak crystalliza- tion temperature Tp, the glass transition temperature (Tg) is increase linearly with increasing in the heating rates, and (Tg) is also increases linearly with increase the Zn content for each sample except for 5% Zn in the glassy alloy. The onset crystallization temperatures (Tc) are in- creases linearly at 5% - 20% for each sample in Figure 2(a), respectively and is decrease at 2% Zn content in the glassy. The exchange in (Tc) may be due to change from one two dimensional structure (bundles to layers) in the glassy systems Se-Zn as given in the Figure 2(c). This type of behavior is typical for glass-crystalline transfor- mation [11]. It is also shows characteristic temperatures are shifted to higher temperatures with increase in the heating rates of the heat flow measurement. For the determination of crystallization activation en- ergy (ΔEc) from the data of DSC non-isothermal experi- ments are use several types of kinetic analysis methods. However, the two types which are broadly applied iso- conversion methods and the peak methods. In an inves- tigation study of the accuracy of known iso-conversion methods, Starink [1] reported that the most accurate me- thods are Kissinger-Akahira-Sunose (KAS) [9-12] me- thod and the method developed by Author [1-13]. All of the iso-conversion methods require the determination of the onset temperature Tc at which a fixed fraction value α (where α = A'/A, It means that A'-Partial Area and A is the total Area in the exothermic peak) of the total amount is transformed. In the KAS method, the relation between the temperatures and the heating rate β is given by 2 ln constant ccc TERT (1) where R is gas constant and ΔEc is the crystallization effective activation energy. Plotting of in 2 c T vs. 1/Tc enables calculation of ΔEc from the linear fits to experimental data. The results for α = 0.4, 0.5, 0.9 and 1.0 are shown in Figure 3. The most reliable iso-conver- sion methods are as reported by Ozawa [13], Flynn-Wall- Ozawa (FWO) [14,15], KAS and the Friedman-Ozawa [15,16]. The FWO model has been developed for non- (a) (b) (c) Figure 2. (a) Composition dependence of crystallization temperature Tc for glassy Se100–xZnx alloys. (b) Composition dependence of crystallized peak temperatures Tp for glassy Se100–xZnx alloys. (c) Plots of 103/T vs. ln (103/2 c T), 103/T vs. ln (103/Tc) and 103/T vs. ln ( )for glassy Se100–xZnx alloys. 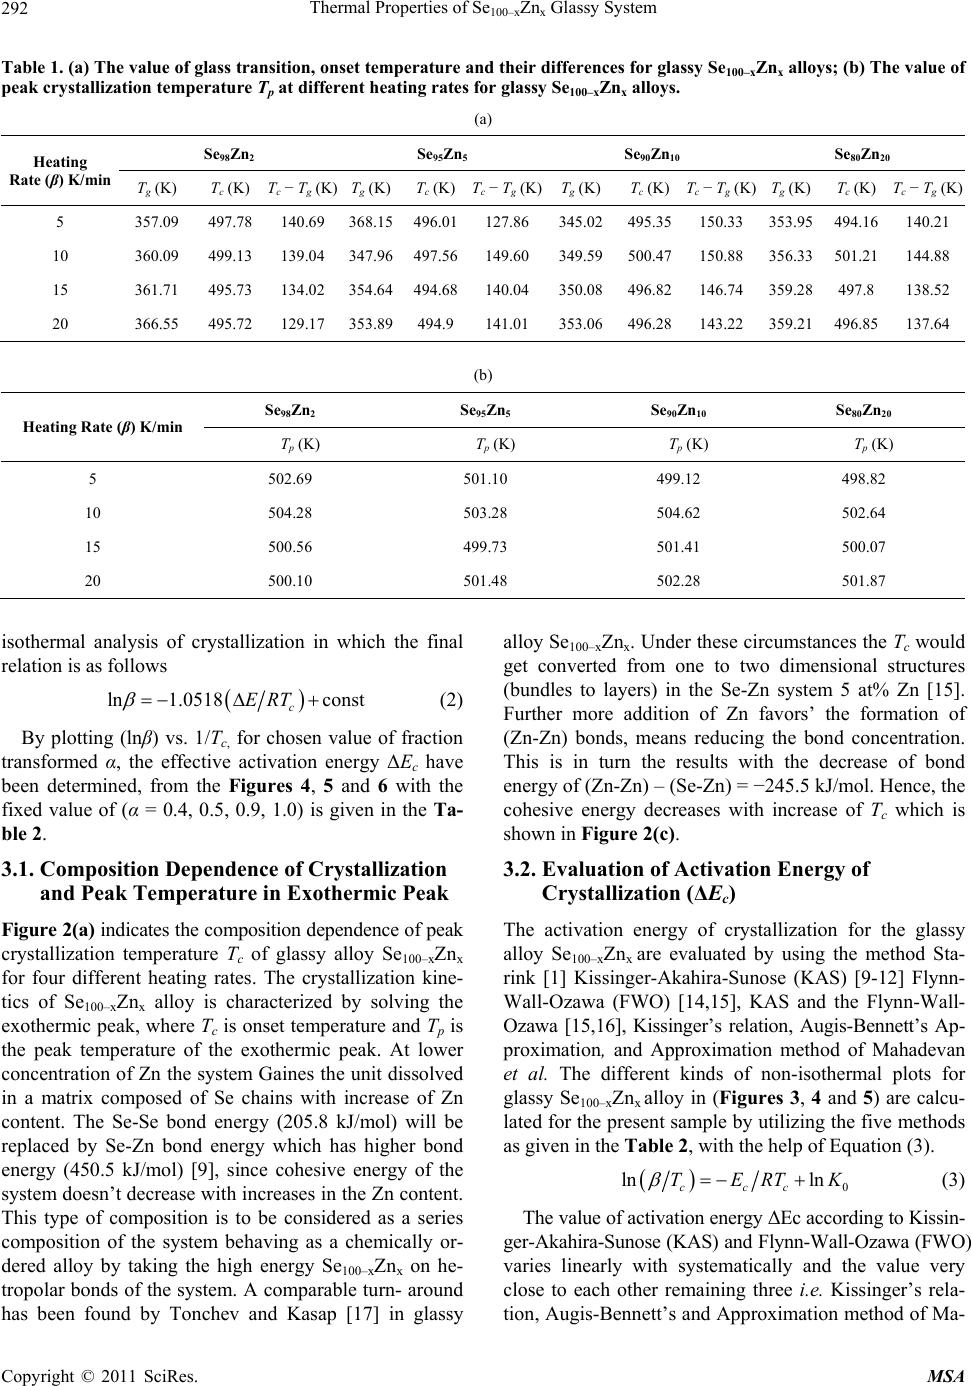 Thermal Properties of Se100–xZnx Glassy System Copyright © 2011 SciRes. MSA 292 Table 1. (a) The value of glass transition, onset temperature and their differences for glassy Se100–xZnx alloys; (b) The value of peak crystallization temperature Tp at different heating rates for glassy Se100–xZnx alloys. (a) Heating Rate (β) K/min Se98Zn2 Se95Zn5 Se90Zn10 Se80Zn20 Tg (K) T c (K) Tc − Tg (K) T g (K)Tc (K)Tc − Tg (K)Tg (K)Tc (K)Tc − Tg (K) Tg (K) Tc (K)Tc − Tg (K) 5 357.09 497.78 140.69 368.15 496.01127.86 345.02495.35150.33 353.95 494.16 140.21 10 360.09 499.13 139.04 347.96497.56149.60 349.59500.47 150.88 356.33 501.21 144.88 15 361.71 495.73 134.02 354.64 494.68140.04 350.08496.82 146.74 359.28 497.8 138.52 20 366.55 495.72129.17 353.89494.9141.01 353.06496.28143.22 359.21 496.85 137.64 (b) Heating Rate (β) K/min Se98Zn2 Se95Zn5 Se90Zn10 Se80Zn20 Tp (K) Tp (K) Tp (K) Tp (K) 5 502.69 501.10 499.12 498.82 10 504.28 503.28 504.62 502.64 15 500.56 499.73 501.41 500.07 20 500.10 501.48 502.28 501.87 isothermal analysis of crystallization in which the final relation is as follows ln 1.0518const c ERT (2) By plotting (lnβ) vs. 1/Tc, for chosen value of fraction transformed α, the effective activation energy ΔEc have been determined, from the Figures 4, 5 and 6 with the fixed value of (α = 0.4, 0.5, 0.9, 1.0) is given in the Ta- ble 2. 3.1. Composition Dependence of Crystallization and Peak Temperature in Exothermic Peak Figure 2(a) indicates the composition dependence of peak crystallization temperature Tc of glassy alloy Se100–xZnx for four different heating rates. The crystallization kine- tics of Se100–xZnx alloy is characterized by solving the exothermic peak, where Tc is onset temperature and Tp is the peak temperature of the exothermic peak. At lower concentration of Zn the system Gaines the unit dissolved in a matrix composed of Se chains with increase of Zn content. The Se-Se bond energy (205.8 kJ/mol) will be replaced by Se-Zn bond energy which has higher bond energy (450.5 kJ/mol) [9], since cohesive energy of the system doesn’t decrease with increases in the Zn content. This type of composition is to be considered as a series composition of the system behaving as a chemically or- dered alloy by taking the high energy Se100–xZnx on he- tropolar bonds of the system. A comparable turn- around has been found by Tonchev and Kasap [17] in glassy alloy Se100–xZnx. Under these circumstances the Tc would get converted from one to two dimensional structures (bundles to layers) in the Se-Zn system 5 at% Zn [15]. Further more addition of Zn favors’ the formation of (Zn-Zn) bonds, means reducing the bond concentration. This is in turn the results with the decrease of bond energy of (Zn-Zn) – (Se-Zn) = −245.5 kJ/mol. Hence, the cohesive energy decreases with increase of Tc which is shown in Figure 2(c). 3.2. Evaluation of Activation Energy of Crystallization (ΔEc) The activation energy of crystallization for the glassy alloy Se100–xZnx are evaluated by using the method Sta- rink [1] Kissinger-Akahira-Sunose (KAS) [9-12] Flynn- Wall-Ozawa (FWO) [14,15], KAS and the Flynn-Wall- Ozawa [15,16], Kissinger’s relation, Augis-Bennett’s Ap- proximation, and Approximation method of Mahadevan et al. The different kinds of non-isothermal plots for glassy Se100–xZnx alloy in (Figures 3, 4 and 5) are calcu- lated for the present sample by utilizing the five methods as given in the Table 2, with the help of Equation (3). 0 ln ln ccc TERTK (3) The value of activation energy ΔEc according to Kissin- ger-Akahira-Sunose (KAS) and Flynn-Wall-Ozawa (FWO) varies linearly with systematically and the value very close to each other remaining three i.e. Kissinger’s rela- tion, Augis-Bennett’s and Approximation method of Ma-  Thermal Properties of Se100–xZnx Glassy System Copyright © 2011 SciRes. MSA 293 (a) (b) (c) Figure 3. Plots of (103/2 c T) vs. ln (β/2 c T) 103/Tc vs. ln (β/Tc) and 103/Tc vs. (β) for glassy Se100–xZnx alloys. hadevan et al. show much variation in their activation energy for different composition in the glassy Se100–xZnx alloy. Kissinger’s relation, Augis-Bennett’s and Appro- ximation method of Mahadevan et al. method can be applied in the present analysis as recommended by the Kasap and Juhasz [18]. Comparative values of activation energy ΔEc is given in the Table 2, these values are in well agreement with one another, in the first three cases with each other in the giving two. 3.3. Evaluation of Avrami Index ‘n’ To calculate the order parameter ‘n’ and the activation energy ΔEc has great helped to evaluate Avrami index ‘n’ by using the methods Matusita-Ozawa and Vazquez. lnln 1lnln TK (4) Figure 6 shows the volume fraction increases with increases the temperature and variation of ln( ) with ln [−ln (1 − α)−1] varied in system for glassy Se100–xZnx al- loy at different temperatures with different heating rates [19,20]. The value of Avrami index ‘n’ have been evalu- ated from the slopes of these curves at four fixed differ- ent temperatures given in the Table 3. According to them, Avrami index ‘n’ basically depends on volume fraction in the exothermic peaks. It is linearly increases with con- centration of Zn and temperature for individual composi- tion of the sample as shown in the Table 3. This is an indicate property of the order parameter and for the fluid in the glass transition region, the relaxation times for the molecular movements change into experimental scale. At these circumstances the diffusive movements convert comparable to the experimental timescale. However dif- fusive motion of the liquid has been trapped and the sys- tem is not in the thermal equilibrium [18-21]. At this time, the size of the nuclei does not achieve the critical size required to initiate the nucleation process as the glass is supposed to have no nuclei (of critical size). When the glass is heated in the furnace, the rate of crys- tal nucleation in the glass reaches the highest value at a temperature than the glass transition temperature and then decrease suddenly with increasing the temperature, during this period the rate of crystal growth is much at a temperature higher than the temperature upon which the nucleation rate is highest. If the glass is heated at a con- stant rate, the crystal nuclei is formed only at very few temperatures and crystals rise-up in size at higher tem- peratures without any increase in number. From the Ta- ble 3, it is show that ‘n’ decreases with an increase in the temperature. It is very familiar that the crystallization of chalcogenide glasses is connected with nucleation and the growth process and the amount of crystallization α increases with increase in temperature, it approaches to with its standard value 1. Hence, increasing the tempera-  Thermal Properties of Se100–xZnx Glassy System Copyright © 2011 SciRes. MSA 294 Figure 4. Plots of (103/T) vs. ln (β/T) at fix value of crystallized fraction α for glassy Se100–xZnx alloys. Table 2. The values of activation energy of crystallization (Ec) and the activation energy structural relation Eg of glassy Se100- x Znx alloy evaluated by using non-isothermal methods. Non-isothermal method Activation Energy of crystallization Ec (kJ/mol) Se98Zn2 Se95Zn5 Se90Zn10 Se80Zn20 Kissinger’s relation 205.61 409.46 540.91 1052.39 Augis-Bennett’s app. 286.83 307.53 321.17 1044.82 Approximation method of Mahadevan et al. 369.47 263.55 386.19 744.10 FWO 451.48 150.02 315.88 795.76 KAS 483.22 149.43 340.60 828.66 Non- isothermal method The activation Energy of structural relation Eg (kJ/mol) Kissinger’s relation 152.39 281.59 155.39 333.47 Approximation method of Mahadevan et al. 156.55 206.10 160.38 238.19 FWO 95.34 101.70 92.22 101.26 KAS 94.09 100.78 90.76 100.22  Thermal Properties of Se100–xZnx Glassy System Copyright © 2011 SciRes. MSA 295 Figure 5. Plots of (103/Tc) vs. ln (β/2 c T) for glassy Se100–xZnx alloys. Table 3. Temperature dependence of Avrami index (n). Se98Zn2 Se95Zn5 Se90Zn10 Se80Zn20 Temp (K) ‘n’ Temp(K) ‘n’ Temp (K) ‘n’ Temp (K) ‘n’ 476.0 1.04 478.0 1.43 480.0 1.00 494.0 1.23 476.5 1.08 478.5 1.44 480.5 1.14 494.5 1.30 477.0 1.14 479.0 1.48 481.0 1.24 495.0 1.65 477.5 1.16 479.5 1.58 481.5 1.33 495.5 1.75 ture with increase in the order of the glassy Se100–xZnx alloys suggests that the character of characterization converts from a nucleation-driven system at the begin- ning to a growth-driven system by the crystallization process [13-21]. 3.4. Rate of Crystallization Glassy Se100–xZnx Alloys After knowing the calculated parameters as ΔEc is used to Equations (1), (3), and K0 with the help of Equation (3), and the value of rate constant K are evaluated from the Equation (4). Finally, the frequency factor K0 is ob- tained by using this relation and with the help of JMA model of authors [7]. 0exp c K KERT (5) Therefore, the values of lnK at different temperatures in the crystallization region are given in the Table 4, for  Thermal Properties of Se100–xZnx Glassy System Copyright © 2011 SciRes. MSA 296 Figure 6. Plots of ln (β) vs. ln [−ln (1 − αT] for four constant temperature for glassy Se100–xZnx alloys. Table 4. Temperature dependence of rate constant K in the crystallization region. Temp (K) lnK Se98Zn2 lnK Se95Zn5 lnK Se90Zn10 lnK Se80Zn20 475 −4.71 −4.79 −4.86 −5.12 480 −3.96 −4.09 −4.17 −4.41 485 −3.59 −3.71 −3.75 −4.01 490 −3.31 −3.41 −3.47 −3.72 glassy Se100–xZnx alloys, It shows that K increases with increase in temperature in the Figure 7(a). It is clear that the crystallization rate is highest for glassy Se80Zn20 alloy. To know more information about morphology of growth, the given Equation (5) from the Gao-Wang model [22] leads to the Equation (5) is 2 P cc K ERT (6) where KP being the value of the rate constant K at peak crystallization temperature Tc for the constant heating rate. Therefore, the heating rate dependence of KP is given in the following Table 4. The value of KP is in- creases with increasing in the x at% and with increasing the heating rates in Table 5. It is clear that the crystalli- zation rate constant is highest for glassy Se80Zn20 alloy as given in the Figure 7(b). The value of K0 increases with increases the x at% and with increase in the heating rates. It is clear that the frequency factor K0 is highest for glas- sy Se80Zn20 alloy as given in the Figure 7(c). Figure 8(a) shows the rigidity of glass sample [22]. Figure 8(b) (a) (b) (c) Figure 7. Plots of Temperature T(K) vs. Rate constant (lnK), ln( ) K/min vs. rate constant Kp min−1 and Temperature (T) K vs. K0 for glassy Se100–xZnx alloys as shown in the above figure.  Thermal Properties of Se100–xZnx Glassy System Copyright © 2011 SciRes. MSA 297 Table 5. Heating rate dependence of rate constant KP. Heating rate(β)K/min Kp (min−1) Se98Zn2 Kp (min−1) Se95Zn5 Kp (min−1) Se90Zn10 Kp (min−1) Se80Zn20 5 4.95 × 10⁻⁴ 10.05 × 10⁻⁴ 13.28 × 10⁻⁴ 25.83 × 10⁻⁴ 10 9.93 × 10⁻⁴ 20.02 × 10⁻⁴ 26.02 × 10⁻⁴ 51.87 × 10⁻⁴ 15 15.08 × 10⁻⁴ 29.43 × 10⁻⁴ 39.66 × 10⁻⁴ 77.81 × 10⁻⁴ 20 20.18 × 10⁻⁴ 39.88 × 10⁻⁴ 52.47 × 10⁻⁴ 102.90 × 10⁻⁴ (a) (b) Figure. 8. Plots of Zn content vs. glass transition temperature, (Tg) crystallization Temperature Tc and Tc − Tg (K) vs. ln K, for glassy Se100–x Znx glasses at different heating rates 5, 10, 15, and 20 as Mention in the above Figure (a) and (b). the glass alteration temperatures Tg represents the power or strictness of the glass structure in chalcogenide glasses. Since thermal stability depends on the Tg value in the glassy state [20-23]. From the Figure 8(b) Tg individual doesn’t give the information about the thermal stability [24] but the difference value Tc − Tg, is give in the thermal stability for all composition with different heating rates [25]. The maximum value of Tc − Tg is giving the informa- tion of highest thermal stability for the sample Se90Zn10 at 10 K/min as shown in the Table 1. It is very important to know the composition Se90Zn10 is more stable than other composition of the alloy Se100−xZnx. It is obvious from the Figure 8(a) and Table 1 in first the crystalliza- tion temperature increases with increase in the Zn con- tent up-to 10% and then decreases up-to 20 at% of Zn content in the Se100–xZnx system. Therefore, it is said that the rate of crystallization is highest at 10% of Zn content in the glassy system [26]. 4. Conclusions The kinetics parameter of crystallization has been inves- tigated under the non-isothermal methods in glassy Se100–xZnx (2 ≤ x ≤ 20). The DSC thermograms are used to evaluate the data of kinetic parameters. There are three best fit methods Kissinger’s relation, Augis-Bennett’s app and Approximation method of Mahadevan et al., the activation energy (ΔEc) is increases as increased the Zn concentration in the glassy. According to Flynn-Wall- Ozawa (FWO), Kissinger-Akahira-Sunose (KAS), the activation energy ΔEc also increases linearly on (5 - 20) at% Zn concentration systematically in the glassy. The activation energy of structural relation ΔEg is increase non-linearly with increases in the composition of the alloy. Avrami index ‘n’ is increases linearly with in- creasing the temperature and non-linearly with Zn con- centration in the glassy Se100–xZnx. The rate constant K increases with the temperature increases in the composi- tion of the glassy. The rate of crystallization is highest in the glassy Se98Zn2 alloy. The thermal stability on the ba- sis of experimental data is highest for the glassy Se90Zn10. The rate of crystallization constant is high because of the highest difference of Tc − Tg in Se90Zn10; furthermore it indicates that thermally is most stable this glass in the range of composition. It has been seen that the crystalli- zation is to deliberate for the chalcogenide glasses by taking the maximum thermal stability. Finally the fre- quency factor K0 is also increases with increase the tem- perature in the glassy Se100–x Znx. 5. Acknowledgements Thanks are due to Department of Physics (Materials Sciences Lab-2) of JMI, New Delhi (India) for providing financial assistance in the form of major research pro- grammed.  Thermal Properties of Se100–xZnx Glassy System Copyright © 2011 SciRes. MSA 298 REFERENCES [1] M. J. Starink, “Analysis of Aluminum Based Alloys by Calorimetric: Quantitative Analysis of Reactions and Reaction Kinetics,” International Materials Reviews, Vol. 49, No. 3-4, 2004, pp. 191-226. doi:10.1179/095066004225010532 [2] T. Ozawa, “Temperature Control Modes in Thermal Analysis,” Pure and Applied Chemistry, Vol. 72, No. 11, 2000, pp. 2083-2099. doi:10.1351/pac200072112083 [3] N. Mehta, M. Zulfequar and A. Kumar, “Kinetic Parame- ters of Crystallization in Glassy Se100–xZnx,” Physica Sta- tus Solidi (A), Vol. 203, No. 2, 2005, pp. 236-246. [4] E. Maruyama, “Amorphous Built-in-Field Effect Photore- ceptors,” Japanese Journal of Applied Physics, Vol. 21, No. 2, 1982, pp. 213-223. doi:10.1143/JJAP.21.213 [5] D. C. Hunt, S. S. Kirby and J. A. Rowland, “X-Ray Imag- ing with Amorphous Selenium: X-Ray to Charge Conver- sion Gain and Avalanche Multiplication Gain,” Medical Physics, Vol. 29, No. 11, 2002, p. 2464. doi:10.1118/1.1513157 [6] T. Ozawa, “Non-Stoichiometry of YBa2Cu3O7-d Ob- served by Repeated Temperature Scanning,” Journal of Thermal Analysis and Calorimetry, Vol. 72, No. 1, 2003, pp. 337-345. doi:10.1023/A:1023960928871 [7] H. S. Chen “A Method for Evaluating Viscosities of Me- tallic Glasses from the Rates of Thermal Transforma- tions,” Journal of Non-Crystalline Solids, Vol. 27, No. 2, 1978, pp. 257-263. doi:10.1016/0022-3093(78)90128-X [8] N. Mehta, P. Agarwal and A. Kumar, “Calorimetric Stu- dies on Se0.6Ge0.22M0.10 (M = Cd, In, Pb),” Turkish Jour- nal of Physics, 29, 2005, pp. 193-200. [9] H. E. Kissinger, “Reaction Kinetics in Differential Ther- mal Analysis,” Analytical Chemistry, Vol. 29, 1957, pp. 1702-1706. doi:10.1021/ac60131a045 [10] S. O. Kasap, In: A. S. Diamond, Ed., Handbook of Imag- ing Materials, Marcel Dekker, New York, 1991, p. 355. [11] M. A. El-Oyoum, “Determination of the Crystallization Kinetic Parameters of Ge22.5Te77.5 Glass Using Model- Free and Model Fitting Methods,” Journal of Alloys and Compounds, Vol. 486, No. 1-2, 2009, pp. 1-8. doi:10.1016/j.jallcom.2009.06.137 [12] T. Akahira and T. T. Sunuse, “Joint Convention of Four Electrical Institutes,” Research Report, Chiba Institute of Technology, Chiba, Vol. 16, 1971. pp. 22-31. [13] T. Ozawa, “Estimation of Activation Energy by Isocon- version Methods,” Thermochimica Acta, Vol. 203, 1992, pp. 159-165. doi:10.1016/0040-6031(92)85192-X [14] T. Ozawa, “A New Method of Analyzing Thermo Gravi- metric Data,” Bulletin of the Chemical Society of Japan, Vol. 38, No. 11, 1965, pp. 1881-1886. doi:10.1246/bcsj.38.1881 [15] J. H. Flynn and L. A. Wall, “A Quick, Direct Method for the Determination of Activation Energy from Thermo- gravimetric Data,” Journal of Polymer Science Part B: Polymer Letters, Vol. 4, No. 5, 1966, pp. 323-328. doi:10.1002/pol.1966.110040504 [16] H. L. Friedman, “Kinetics of Thermal Degradation of Charforming Plastics from Hermogravimetry. Application to a Phenolic Plastic,” Journal of Polymer Science Part C: Polymer Symposia, Vol. 6, No. 1, 1964, pp. 183-185. [17] D. Tonchev and S. O. Kasap, “Thermal Properties of SbxSe100−x Glasses Studied by Modulated Temperature Differential Scanning Calorimetric,” Journal of Non- Crystalline Solids, Vol. 248, No. 1, 1999, pp. 28-36. doi:10.1016/S0022-3093(99)00100-3 [18] S. O. Kasap and C. Juhasz, “Theory of Thermal Analysis of Non-Isothermal Crystallization Kinetics of Amorphous Solids,” Journal of the Chemical Society, Faraday Transactions, Vol. 81, 1985, pp. 811-831. doi:10.1039/f29858100811 [19] J. Vázquez, C. Wagner, P. Villares and R. Jiménez-Garay, “Glass Transition and Crystallization Kinetics in Sb0.18As0.34Se0.48 Glassy Alloy by Using Non-Isothermal Techniques,” Journal of Non-Crystalline Solids, Vol. 235-237, 1998, pp. 548-553. doi:10.1016/S0022-3093(98)00661-9 [20] K. Matusita, T. Konastsu and R. Yokota, “Kinetics of Non-Isothermal Crystallization Process and Activation Energy for Crystal Growth in Amorphous Materials,” Journal of Materials Science, Vol. 19, No. 1, 1984, pp. 291-296. doi:10.1007/BF02403137 [21] T. Ozawa, “Kinetics of Non-Isothermal Crystallization,” Polymer , Vol. 12, No. 3, 1971, pp. 150-158. doi:10.1016/0032-3861(71)90041-3 [22] Y. Q. Gao and W. Wang, “On the Activation Energy of Crystallization in Metallic Glasses,” Journal of Non- Crystalline Solids, Vol. 81, No. 1-2, 1986, pp. 129-134. doi:10.1016/0022-3093(86)90262-0 [23] K. Singh, N. S. Saxenaa, O. N. Srivastava, D. Patidara and T. P. Sharmaa, “Energy Band Gap of Se100–xInx Chal- cogenide Glasses,” Chalcogenide Letters, Vol. 3, No. 3, 2006, pp. 33-36. [24] A. Hurby, “Evaluation of Glass-Forming Tendency by Means of DTA,” Czechoslovak Journal of Physics, Vol. 22, No. 11, 1972, pp. 1187-1193. [25] S. A. Khan, F. S. Al-Hazmi, A. S. Maida and A. A. Al-Ghamdi, “Calorimetric studies of the crystallization process in a-Se75S25-xAgx,” Current Applied Physics, Vol. 9, No. 3, 2009, pp. 567-572. doi:10.1016/j.cap.2008.05.004 [26] N. Mehta and A. Kumar, “Thermal Characterization of Glassy Se70Te20M10 Using DSC Technique,” Journal of Materials Science, Vol. 39, No. 21, 2004, pp. 6433-6437. doi:10.1023/B:JMSC.0000044880.99215.be |