J. Electromagnetic Analysis & Applications, 2009, 2: 92-96
doi:10.4236/jemaa.2009.12014 Published Online June 2009 (www.SciRP.org/journal/jemaa)
Copyright © 2009 SciRes JEMAA
1
Partial Discharge Source Classification and
De-Noising in Rotating Machines Using Discrete
Wavelet Transform and Directional Coupling
Capacitor
Mohammad Amin Kashiha, Diman Zad Tootaghaj, Dolat Jamshidi
Communications Department, Niroo Research Institute (NRI), Tehran, Iran.
Email: makashiha@gmail.com, diman_zad@yahoo.com, djamshidi@nri.ac.ir
Received March 28th, 2009; revised May 22nd, 2009; accepted May 28th, 2009.
ABSTRACT
This paper introduces a new method to separate PD1 from other disturbing signals present on the high voltage genera-
tors and motors. The method is based on combination of a pattern classifier, the Discrete Wavelet Transform (DWT), to
de-noise PD and Time-Of-Arrival method to separate PD sources. Furthermore, it will be shown that it can recognize
PD sources including rotating machine’s internal and external discharge pulses (e.g. on the bus bar).
Keywords: Partial Discharge, Discrete Wavelet Transform, Time-Of-Arrival, Rotating Machines, De-Noising, Cou-
pling Capacitor
1. Introduction
As a result of deterioration of insulating systems in high
voltage equipments, small electrical spikes occur within
the insulation [1]. This could cause further degradation of
insulation and finally failure of the equipment. So, insu-
lation assessment of these equipments is necessary in
order to avoid catastrophic consequences. During last
decades a huge number of studies have been done on
recognizing Partial Discharge (PD) pulses in high voltage
equipments including rotating machines. Although there
have been good achievements in this field [1], still there
is a long way to introduce a method to separate PD from
noise and interferences in a perfect way. There are sev-
eral approaches to extract PD and there are a handful of
papers on each of them. Reference [2] discusses a method
based on fuzzy classification of PD. Although it is par-
tially successful in recognizing cross-coupling resulted
from adjacent phases, its authors admit that certainty of
their method is not high. There are also some methods
based on artificial intelligence [2] but they suffer from
low generality and high calculation needs. Nowadays it is
proved that time-frequency transforms such as Wavelet
[3,4] and Hilbert–Huang transform [5] have the best per-
formance in PD de-noising. As authors investigated al-
most all of published methods and most of survey papers
approve it too [6,7], the best and most successful method
to extract PD from noise and interferences is DWT.
Hence, the approach was developed based on DWT
de-noising but the method suffers from disability of
separating PD originating from rotating machine and the
bus bar. Thus, a complementary technique (Time-Of-Arri-
val) which is based on the method introduced in [8] was
used. The idea of the latter is based on directional cou-
pling capacitors as conventional sensors used to attach
measurement instruments to high voltage windings.
The paper is organized as follows: Section 2 clarifies
problems dealt with in PD de-noising. Section 3 discusses
DWT and its application in PD de-noising. Section 4 ex-
plains the Time-Of-Arrival technique. Section 5 discusses
the results obtained and Section 6 concludes the paper.
2. Problem Definition
PD measurement is a main concern of operators dealing
with generators and motors as they want to avoid ma-
chine failure. On the other hand, they prefer to do this
while the machine is operating (i.e. on-line measurement)
because detaching a generator from the network is costly
and time-consuming. Meanwhile in on-line operation of
1Partial Discharge
Partial Discharge Source Classification and De-noising in Rotating Machines 93
Using Discrete Wavelet Transform and Directional Coupling Capacitor
Copyright © 2009 SciRes JEMAA
these machines, there are different kinds of noise and
interference signals that make measurements unreliable.
Therefore, a method is needed to separate PD from these
signals. The method this paper follows is based on DWT
which is a time-frequency transform. As known, PD is a
non-stationary signal [9]. So, conventional transforms
such as Fourier Transform (FT) may not be used to ana-
lyze spectral specifications of PD as they do not distin-
guish short-term and long-term frequency components.
But DWT considers time events of the signal. Thus, it is
capable of interpreting short-time PD pulses. Next sec-
tion discusses PD de-noising using DWT.
3. PD De-Noising Using DWT
Wavelets have very attractive features which cause them
to be used in miscellaneous applications [10]. One of the
methods which works based on these features is decom-
posing and reconstructing signals using QMF2 filters.
Reference [2] is a good context to understand how DWT
decomposition using QMF filters works. But here the
focus is on applying this technique to develop the method.
In general, DWT decomposes a signal to its basic fre-
quency components as shown in Figure 1.
Recorded signal from sensors includes both PD and
noise. It is known that noise has a stochastic nature. So, it
is expected that its energy3 is divided equally between
filter bands. But PD’s energy is mostly concentrated in a
few bands [9]. Energy of the coefficients is a reliable cri-
terion to separate bands which may contain PD more than
noise. Author’s experience showed that using 2nd order
Daubechies (db2) mother wavelet [9], more than 80% of
PD signal’s energy is gathered in one of the detail coeffi-
cients (cDs) of DWT. This is a useful result which could
be considered to determine global threshold and finally
separate PD from noise. Energy distribution of a sample is
shown in Figure 2. As it is seen cD6 (detail coefficient of
6th decomposition level) includes most of PD’s energy.
Figure 1. The tree structure of the DWT [11]; cDn is the
detail .coefficient of nth decomposition level
Figure 2. Energy distribution of the signal on each level,
using db 2
Using mentioned method, thresholds are calculated (in
fact, we train the system.). The method we calculate a
threshold is called soft-thresholding and is discussed in [9].
Then decomposing is repeated and calculated thresholds
are exerted to make weak samples of the coefficients zero.
Weak samples are supposed to be related to noise com-
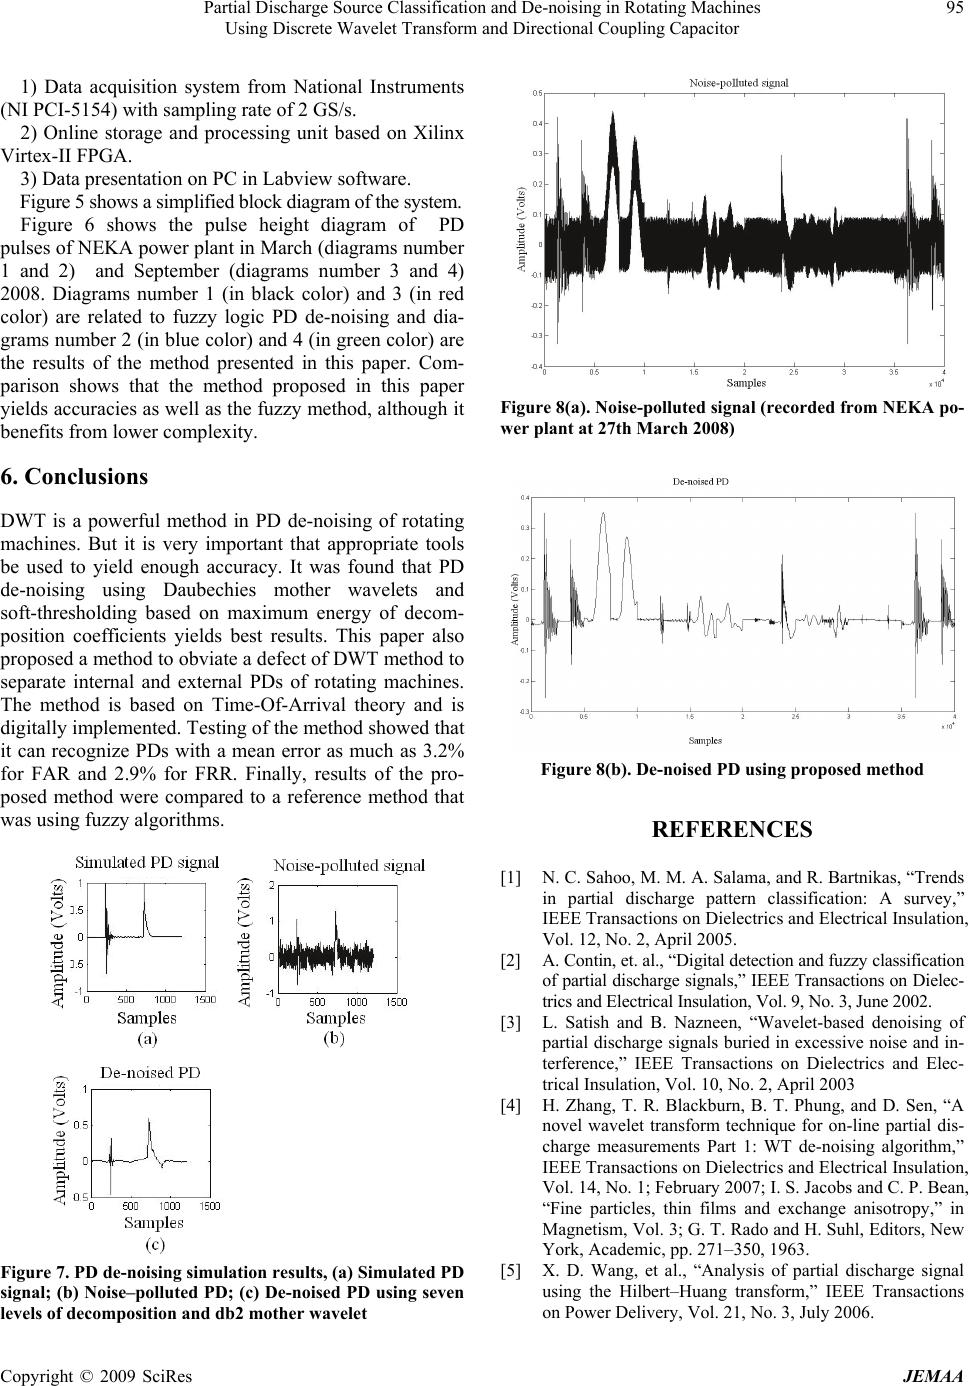
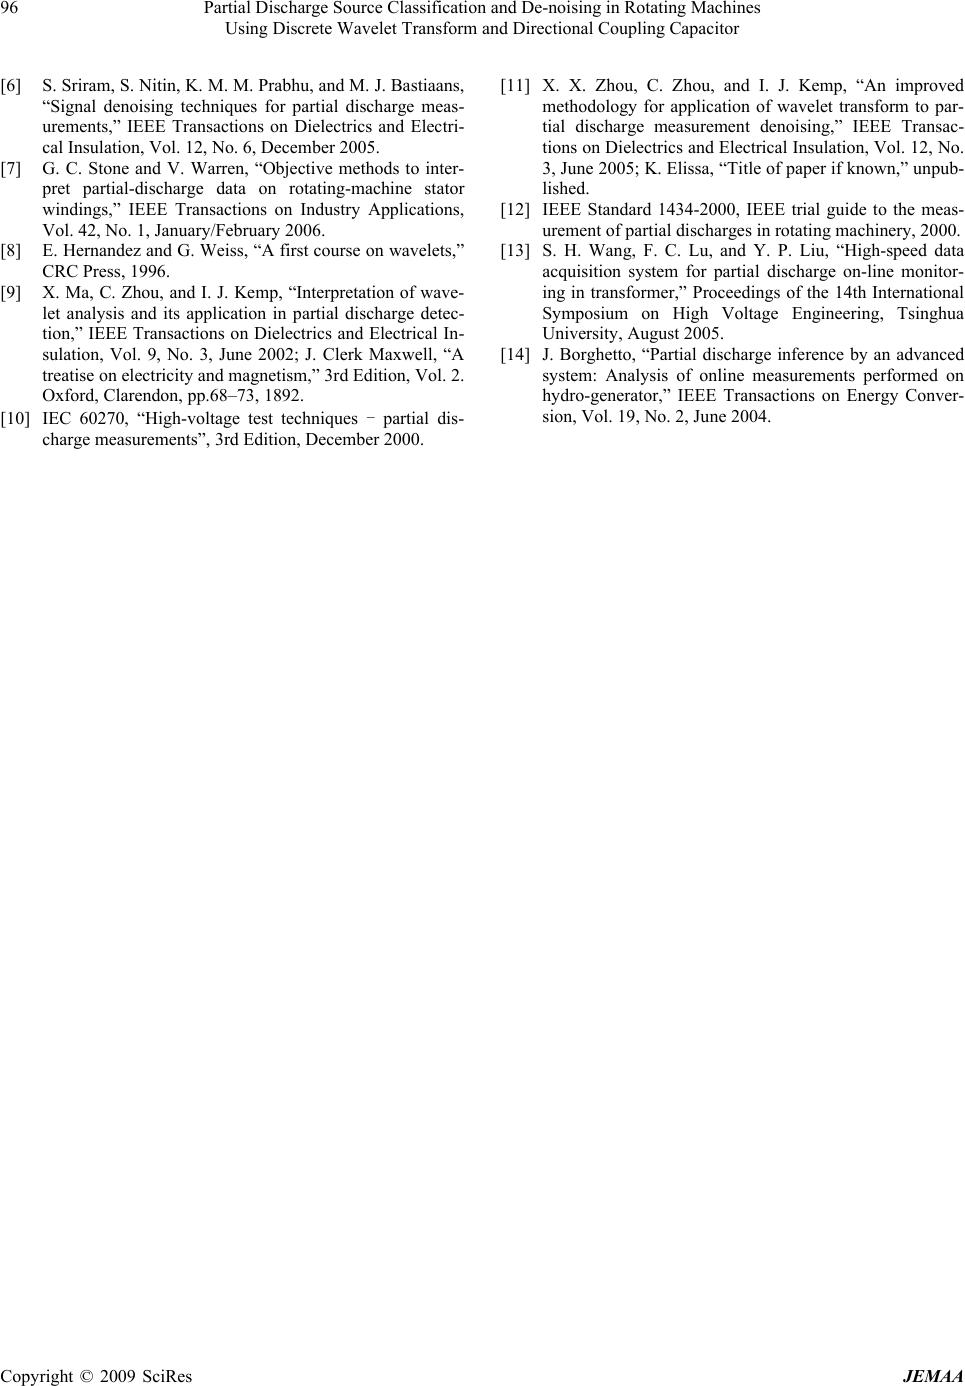
ponents. Figure 3 shows the reconstructed signal using
soft-thresholding in comparison with original noise-pol-
luted PD signal.
4. A Modification to the PD De-Noising
Method
The method introduced so far, suffers from a defect in
recognizing PD sources. There are four types of signals
that may reach PD-Analyzer (PDA) equipment:
1) Internal PD (i.e. PD pulses originating from rotat-
ing machine)
2) External PD (i.e. PD pulses originating from bus bar)
3) Internal noise (i.e. noise originating from other
sources except discharges)
4) External noise (i.e. noise originating from external
agents including interferences caused by communication
systems or PDA itself)
The problem of the mentioned method (and generally
pattern-based methods) encounter is that it cannot distin-
guish external PDs from internal PDs because it works
based on pulse shape and is not dependant on the direc-
tion PD comes from.
Hence, a technique is needed to separate internal and
external PD pulses. The method used to amend the ap-
proach works based on utilizing directional couplers [10].
Figure 4 shows the overall system measuring PD by this
technique. This method (called Time-Of-Arrival) was
initially used in an analogue system to separate internal
and external PD [7]. But a major disadvantage of the
analogue system is that one should design a system which
works in frequencies upper than 50 MHz [12] because it
does not utilize any de-noising technique. Therefore,
noise eliminating is done with high-pass filtering because
there is no noise or interference in this system at those
frequencies.
2Quadrature Mirror Filter
3Energy definition and formulation of calculating coefficients’ energy
is introduced in [11].
94 Partial Discharge Source Classification and De-noising in Rotating Machines
Using Discrete Wavelet Transform and Directional Coupling Capacitor
Figure 3. Noise-polluted PD pulse in comparison with the
coefficient with highest energy
Figure 4. Different kinds of signals reaching PDA
Signals shown in Figure 4 are not generally present in
every generator or motor. For example in hydro-generato-
rs there is some negligible internal noise that does not
affect the measurement. Also external PD may exist or
not based upon the characteristics of the bus system.
In previous sections a method to separate noise from
PD was discussed. So, the only issue which is remained
is to distinguish internal and external PD.
The “Time-Of-Arrival” technique helps us to separate
these two signals because cable length of sensors’ outputs
is different so that external PD pulses arrive at PDA ports
simultaneously but internal PD pulses arrive at different
times [7]. By capturing the two ports of PDA in fixed
sample steps using appropriate data acquisition systems
[13,14], we extract internal PD in two steps:
1) De-noising PD using DWT as discussed in Section 3.
2) Separating internal and external PD pulses using
Time-Of-Arrival technique.
5. Experimental Results
At first step the proposed method was tested successfully
on simulated data. Different kinds of noise and interfer-
ence (including AM interference, sinusoid harmonies and
Gaussian noise) were exerted on simulated DEP4 and
DOP5 [4] PD pulses. Then de-noising algorithm intro-
duced before was applied to them. Figure 7 shows a sam-
ple of simulation results.
For further evaluation of the proposed method, re-
cordings from NEKA6 power plant were made, which is
equipped with 4*440 MW turbo-generators. Various
kinds of noise were observed at the output of coupling
capacitors attached to the output of the generators. Main
noise types were harmonies and Gaussian noise and the
total mean SNR was about 3 dB. Applying the proposed
method to recorded signals and comparing results with
observations of experts showed that the method recog-
nizes PDs with a mean error as much as 3.2% for FAR7
and 2.9% for FRR8 (FAR happens when a noise pulse is
recognized as PD and FRR happens when a PD is recog-
nized as noise.). A sample of PD de-noising of recorded
data is shown is Figure 8(a) and 8(b).
As the result of this work will be used to manufacture a
PD Analyzer in NRI, major methods of de-noising PD to
measure its level and frequency band had to be consid-
ered. Therefore two successful methods i.e. fuzzy logic
presented in [2] and the method presented in this paper
were implemented on a high technology hardware com-
prised of the followings:
Figure 5. A simple block diagram of PD analyzer system used
4Damped Exponentially Pulse
5Damped Oscillatory Pulse
6NEKA is the most important and oldest power plant in north of Iran
7 False Acceptance Rate
8 False Re
j
ection Rate
Figure 6. Pulse height diagram of PD signals measured in
NEKA power plant; March 2008 (diagram no.1: fuzzy
method, diagram no.2: DWT method); September 2008
(diagram no.3: fuzzy method, diagram no.4: DWT method)
Copyright © 2009 SciRes JEMAA
Partial Discharge Source Classification and De-noising in Rotating Machines 95
Using Discrete Wavelet Transform and Directional Coupling Capacitor
Copyright © 2009 SciRes JEMAA
1) Data acquisition system from National Instruments
(NI PCI-5154) with sampling rate of 2 GS/s.
2) Online storage and processing unit based on Xilinx
Virtex-II FPGA.
3) Data presentation on PC in Labview software.
Figure 5 shows a simplified block diagram of the system.
Figure 6 shows the pulse height diagram of PD
pulses of NEKA power plant in March (diagrams number
1 and 2) and September (diagrams number 3 and 4)
2008. Diagrams number 1 (in black color) and 3 (in red
color) are related to fuzzy logic PD de-noising and dia-
grams number 2 (in blue color) and 4 (in green color) are
the results of the method presented in this paper. Com-
parison shows that the method proposed in this paper
yields accuracies as well as the fuzzy method, although it
benefits from lower complexity.
6. Conclusions
DWT is a powerful method in PD de-noising of rotating
machines. But it is very important that appropriate tools
be used to yield enough accuracy. It was found that PD
de-noising using Daubechies mother wavelets and
soft-thresholding based on maximum energy of decom-
position coefficients yields best results. This paper also
proposed a method to obviate a defect of DWT method to
separate internal and external PDs of rotating machines.
The method is based on Time-Of-Arrival theory and is
digitally implemented. Testing of the method showed that
it can recognize PDs with a mean error as much as 3.2%
for FAR and 2.9% for FRR. Finally, results of the pro-
posed method were compared to a reference method that
was using fuzzy algorithms.
Figure 7. PD de-noising simulation results, (a) Simulated PD
signal; (b) Noise–polluted PD; (c) De-noised PD using seven
levels of decomposition and db2 mother wavelet
Figure 8(a). Noise-polluted signal (recorded from NEKA po-
wer plant at 27th March 2008)
Figure 8(b). De-noised PD using proposed method
REFERENCES
[1] N. C. Sahoo, M. M. A. Salama, and R. Bartnikas, “Trends
in partial discharge pattern classification: A survey,”
IEEE Transactions on Dielectrics and Electrical Insulation,
Vol. 12, No. 2, April 2005.
[2] A. Contin, et. al., “Digital detection and fuzzy classification
of partial discharge signals,” IEEE Transactions on Dielec-
trics and Electrical Insulation, Vol. 9, No. 3, June 2002.
[3] L. Satish and B. Nazneen, “Wavelet-based denoising of
partial discharge signals buried in excessive noise and in-
terference,” IEEE Transactions on Dielectrics and Elec-
trical Insulation, Vol. 10, No. 2, April 2003
[4] H. Zhang, T. R. Blackburn, B. T. Phung, and D. Sen, “A
novel wavelet transform technique for on-line partial dis-
charge measurements Part 1: WT de-noising algorithm,”
IEEE Transactions on Dielectrics and Electrical Insulation,
Vol. 14, No. 1; February 2007; I. S. Jacobs and C. P. Bean,
“Fine particles, thin films and exchange anisotropy,” in
Magnetism, Vol. 3; G. T. Rado and H. Suhl, Editors, New
York, Academic, pp. 271–350, 1963.
[5] X. D. Wang, et al., “Analysis of partial discharge signal
using the Hilbert–Huang transform,” IEEE Transactions
on Power Delivery, Vol. 21, No. 3, July 2006.
96 Partial Discharge Source Classification and De-noising in Rotating Machines
Using Discrete Wavelet Transform and Directional Coupling Capacitor
Copyright © 2009 SciRes JEMAA
[6] S. Sriram, S. Nitin, K. M. M. Prabhu, and M. J. Bastiaans,
“Signal denoising techniques for partial discharge meas-
urements,” IEEE Transactions on Dielectrics and Electri-
cal Insulation, Vol. 12, No. 6, December 2005.
[7] G. C. Stone and V. Warren, “Objective methods to inter-
pret partial-discharge data on rotating-machine stator
windings,” IEEE Transactions on Industry Applications,
Vol. 42, No. 1, January/February 2006.
[8] E. Hernandez and G. Weiss, “A first course on wavelets,”
CRC Press, 1996.
[9] X. Ma, C. Zhou, and I. J. Kemp, “Interpretation of wave-
let analysis and its application in partial discharge detec-
tion,” IEEE Transactions on Dielectrics and Electrical In-
sulation, Vol. 9, No. 3, June 2002; J. Clerk Maxwell, “A
treatise on electricity and magnetism,” 3rd Edition, Vol. 2.
Oxford, Clarendon, pp.68–73, 1892.
[10] IEC 60270, “High-voltage test techniques - partial dis-
charge measurements”, 3rd Edition, December 2000.
[11] X. X. Zhou, C. Zhou, and I. J. Kemp, “An improved
methodology for application of wavelet transform to par-
tial discharge measurement denoising,” IEEE Transac-
tions on Dielectrics and Electrical Insulation, Vol. 12, No.
3, June 2005; K. Elissa, “Title of paper if known,” unpub-
lished.
[12] IEEE Standard 1434-2000, IEEE trial guide to the meas-
urement of partial discharges in rotating machinery, 2000.
[13] S. H. Wang, F. C. Lu, and Y. P. Liu, “High-speed data
acquisition system for partial discharge on-line monitor-
ing in transformer,” Proceedings of the 14th International
Symposium on High Voltage Engineering, Tsinghua
University, August 2005.
[14] J. Borghetto, “Partial discharge inference by an advanced
system: Analysis of online measurements performed on
hydro-generator,” IEEE Transactions on Energy Conver-
sion, Vol. 19, No. 2, June 2004.