 Journal of Modern Physics, 2011, 2, 200-209 doi:10.4236/jmp.2011.24028 Published Online April 2011 (http://www.SciRP.org/journal/jmp) Copyright © 2011 SciRes. JMP Designing and Modeling of Efficient Resonant Photo Acoustic Sensors for Spectroscopic Applications Fahem Yehya, Anil K. Chaudhary Advanced Centre of Research in High Energy Materials, University of Hyderabad, India E-mail: anilphys@yahoo.co m Received October 2, 2010; revised November 22, 2010; accepted November 25, 2010 Abstract We report the modeling and designing aspects of different types of photo-acoustic (PA) cell based on the excitation of longitudinal, radial and azimuthal mode using CW and pulse lasers. The results are obtained by employing fluid dynamics equations along with Bessel’s function. The obtained results based on stimulation of longitudinal, radial and azimuthally resonance modes of the Photo acoustic signals in the suitable cavity. This is utilized to design highly efficient low volume PA detector for the spectroscopic studies of different types of atmospheric pollutants. We have also studied the dependence of the excited photo acoustic signals on various parameters such as cell radius, laser power, absorption coefficient, quality factor ‘Q’ along with the first longitudinal, radial, azimuthal mode and the pressure. The simulated results show the linearity of the PA signal with different concentration of the gas sample. Keywords: Photo Acoustic, Resonance, Cavity, Spectroscopy, Modes 1. Introduction The photo acoustic effect was first reported by A. Bell (1880), he found th at thin disc emit sound when exposed to a rapidly interrupted beam of sunlight [1], in the fol- lowing years several renowned scientists studied this new phenomena in detail Tyndall [2], Rontgen [3]. But the first application of the effect of trace g as mon- itoring were reported in the late 1960s because of the two important steps leading to this techniqu e were the inven- tion of the laser as an intense light source and the devel- opment of the highly sensitive sound detector such as microphone and lock-in-amplifier for amplification. Kerr and Atwood were the first to apply the laser in photo acoustic signal (PAS) where they used CW (CO2) laser and they achieved the minimum detectable absorption coefficient αmin the order of 10-7cm-1 for CO2 buffered in N2, Kreuzer (1971) who reported on the sensitive detec- tion of (CH4) in N2with lowest detection order of 10-8 (ppb) using He Ne laser operating at 3.39 nm [4]. Typically non resonant photo acoustic cell of cylin- drical shape has been investigated by Sigrist et al. [5]. Resonant cell based on excitation of radial, azimuthal and longitudinal modes by different types of lasers are reported by different groups [6-10]. A special feature of PAS is the fact that the ultimate detection sensitivity de- pends on several factors such as the amount of energy stored in the absorption sample in the form of heat, size of absorbing sample, cell constant, in put laser power and the sensitivity of the microphone [11]. In the PA effect the molecular absorption of photons result in the excitation of molecular energy level, the excited state can released its energy either by radiative process or by non-radiative process (collisional relaxa- tion). As the radiative lifetime of vibrational level are long compared to the time required for collisional deac- tivation and the photon energy is too small to induce chemical reaction [6]. Thus, the absorbed energy is com- pletely released as heat in the sample as shown in Figure 1. In fact this process is generated by two distinct meth- ods [10]. 1.1. Modulated Excitation In modulated excitation scheme, the intensity of the ra- diation sources periodically modulated in the form of a square or a sine wave using mechanical chopper. The range of modulation frequencies usually lies between few Hz up to several kHz. The resulted pressure fluctuations generate sound waves in the audible range, which can be 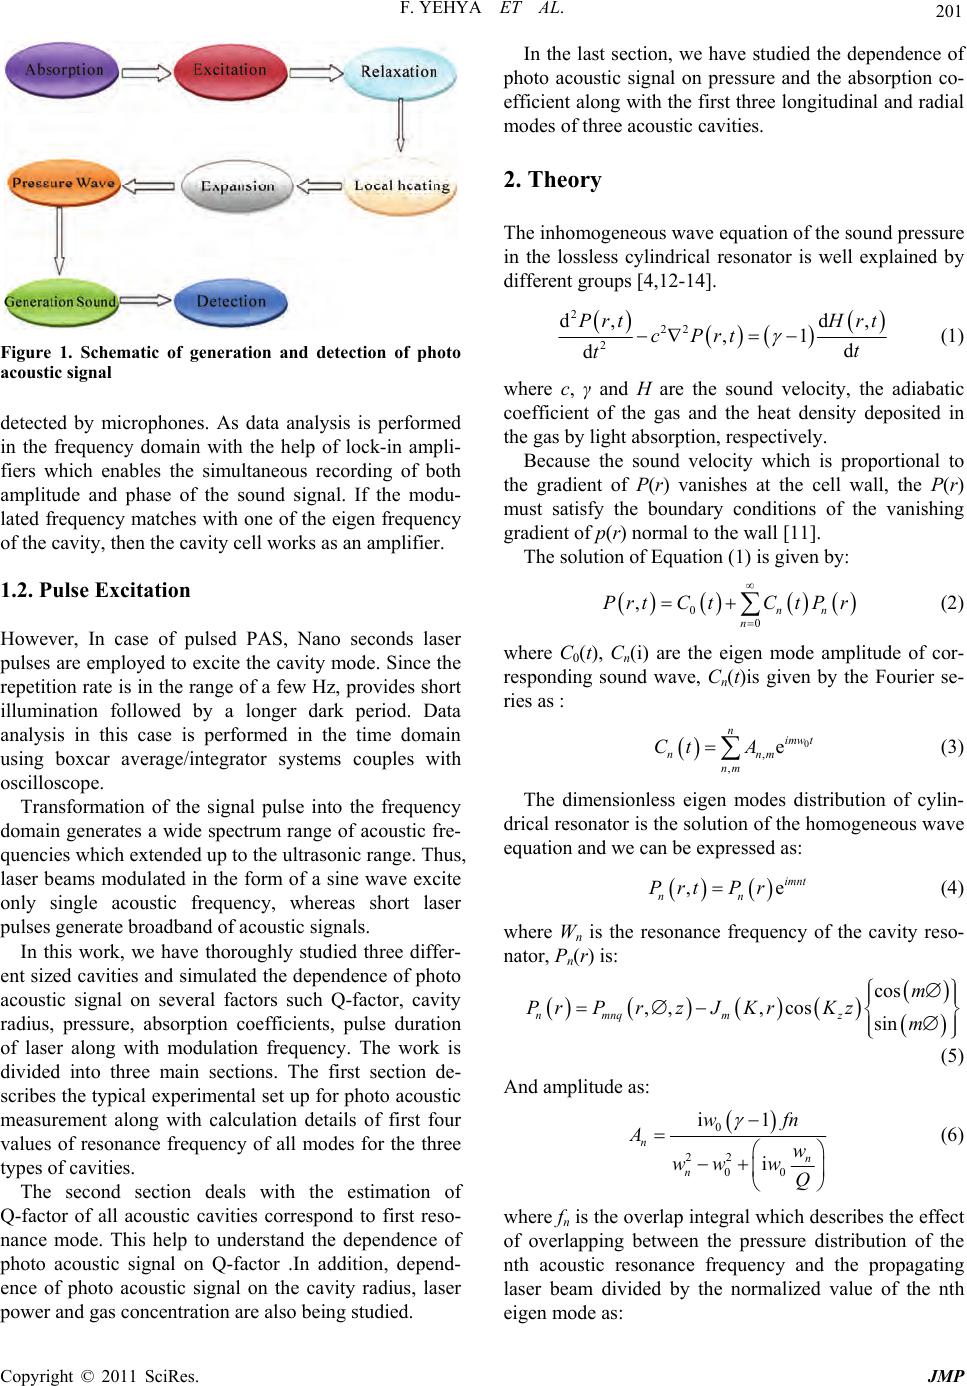 F. YEHYA ET AL. 201 Figure 1. Schematic of generation and detection of photo acoustic signal detected by microphones. As data analysis is performed in the frequency domain with the help of lock-in ampli- fiers which enables the simultaneous recording of both amplitude and phase of the sound signal. If the modu- lated frequency matches with one of the eigen frequency of the cavity, then the cavity cell works as an amplifier. 1.2. Pulse Excitation However, In case of pulsed PAS, Nano seconds laser pulses are employed to excite the cavity mode. Since the repetition rate is in the range of a few Hz, provid es short illumination followed by a longer dark period. Data analysis in this case is performed in the time domain using boxcar average/integrator systems couples with oscilloscope. Transformation of the signal pulse into the frequency domain generates a wide spectrum range of acoustic fre- quencies which extended up to the ultrasonic range. Thus, laser beams modulated in the form of a sine wave excite only single acoustic frequency, whereas short laser pulses generate broadband of acoustic signals. In this work, we have thoroughly studied three differ- ent sized cavities and simulated the dependence of photo acoustic signal on several factors such Q-factor, cavity radius, pressure, absorption coefficients, pulse duration of laser along with modulation frequency. The work is divided into three main sections. The first section de- scribes the typical experimental set up for photo acoustic measurement along with calculation details of first four values of resonance frequency of all modes for the three types of cavities. The second section deals with the estimation of Q-factor of all acoustic cavities correspond to first reso- nance mode. This help to understand the dependence of photo acoustic signal on Q-factor .In addition, depend- ence of photo acoustic signal on the cavity radius, laser power and gas concentration are also being studied. In the last section, we have studied the dependence of photo acoustic signal on pressure and the absorption co- efficient along with the first three longitudinal and radial modes of three acoustic cavities. 2. Theory The inhomogeneous wave equation of the sound pressure in the lossless cylindrical resonator is well explained by different groups [4,12-14]. 222 2 d, d, ,1 d d Prt Hrt cPrt t t (1) where c, γ and H are the sound velocity, the adiabatic coefficient of the gas and the heat density deposited in the gas by light absorption , respectively. Because the sound velocity which is proportional to the gradient of P(r) vanishes at the cell wall, the P(r) must satisfy the boundary conditions of the vanishing gradient of p(r) normal to the wall [11]. The solution of Equation (1) is given by: 00 ,nn n PrtCtCtPr (2) where C0(t), Cn(i) are the eigen mode amplitude of cor- responding sound wave, Cn(t)is given by the Fourier se- ries as : 0 , , e nimwt nnm nm Ct A (3) The dimensionless eigen modes distribution of cylin- drical resonator is the so lution of the homogeneous wave equation and we can be expressed as: ,imnt nn Prt Pre (4) where Wn is the resonance frequency of the cavity reso- nator, Pn(r) is: cos ,,,cos sin nmnq mz m PrPrzJ KrKzm (5) And amplitude as: 0 22 00 i1 i n n n wfn Aw ww w Q (6) where fn is the overlap integral which describes the effect of overlapping between the pressure distribution of the nth acoustic resonance frequency and the propagating laser beam divided by the normalized value of the nth eigen mode as: Copyright © 2011 SciRes. JMP  F. YEHYA ET AL. Copyright © 2011 SciRes. JMP 202 2 d d n n rP rv fPn rv (7) min min S CP (11) where Smin is the minimum detectable signal: min det mic S SS (12) 2.1. The Photo Acoustic Signal (PAS) where Sdet is the minimum detectable microphone signal and Smic is the microphone responsivity. The photo acoustic signal (s) is given by: SCP (8) The contribution of noise comes from the microphone, background noise, preamplifier, gas flow, and environ- ment …etc. effect on the value of Smin., [17] cell constant (c) = 175 pa·cm/w, the beam laser power p = 10 mw, microphone responsivity Smic = 100 mv/pa and the level of the PA detector Sdet = 100 nv - 1 µv, so from (12) the minimum absorption b e in the range (5 × 10⁻⁷ - 5 × 10⁻⁹) cm–1. We can also estimate the minimum detectable concentration of the sample by us ing this expression [4]: where C is the cell constant which can expressed as: 1nmic n flQ CR wV Pr (9) where Rmic is the microphone sensitivity (mv/pa), Q is the quality factor which physically means the accumu- lated energy in one period divided by the energy lost over one period, the quality factor can be defined as: min min tot C (13) 0 w Qw (10) For, min = 10–8 cm–1, Ntot = 1019 cm-3, σ = 10–8 cm–1 the minimum detectable concentration is Cmin = 10–9 this means in the ppb range. w0 and ∆w are the resonance frequency and the half width of the resonance profile (FWHM). Therefore the minimum detectable absorption coeffi- cient αmin is given by: The PAS for longitudinal and radial for different value of n and α can be written as [16,17]: 2 00 1e 21longitudnal mode14A π 1 ,12π 11eradial mode14B xl n x jM jjnj l n n PL PAS r vvfvV Jx 3. Results and Discussion It is divided into three parts, the first part deals with the experimental layout whereas second part deals with ef- fect of quality factor on PAS and third parts comprises the effect of pressure on PAS. 3.1. Typical Photo Acoustic Set Up for PA Measurement Figure 2 shows the typical experiment set up for re- cording the PAS exited by lasers. Where we are using a chopper for modulating the incident laser beam if CW laser is employed in place of pulsed laser, the different types of acoustic filter which can used to reduce the ex- ternal noise, the resonance cavity which is made of stainless steel and its first resonance frequencies in the range of the chopper values, a microphone coupled with lock-in-amplifier for CW laser or with boxcar average and oscilloscope in the case of pulsed laser. 3.2. Resonance Frequencies When the laser beam directed along the lossless cylin- drical resonator axis, the eigen frequencies fmnq of the Figure 2. The typical set up for PA measurement. 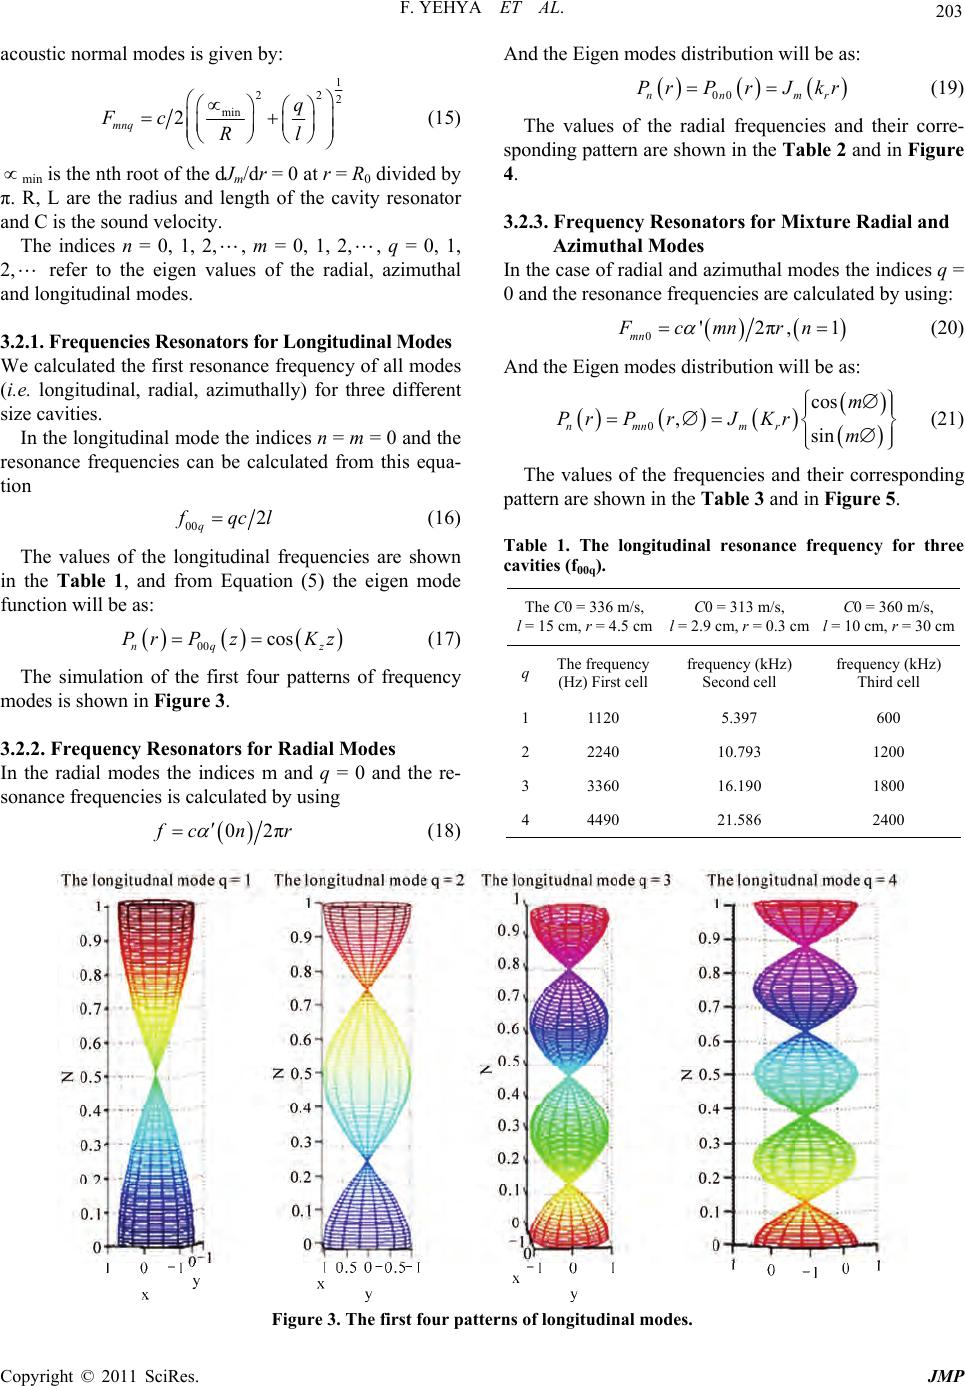 F. YEHYA ET AL. 203 acoustic normal modes is given by: 1 222 min 2 mnq q Fc Rl (15) min is the nth root of the dJm/dr = 0 at r = R0 divided by π. R, L are the radius and length of the cavity resonator and C is the sound velocity. The indices n = 0, 1, 2,, m = 0, 1, 2,, q = 0, 1, 2, refer to the eigen values of the radial, azimuthal and longitudinal modes. 3.2.1. Frequencies Resonators for Longitudinal Modes We calculated the first resonance frequency of all modes (i.e. longitudinal, radial, azimuthally) for three different size cavities. In the longitudinal mode the ind ices n = m = 0 and the resonance frequencies can be calculated from this equa- tion 00 2 q qc l (16) The values of the longitudinal frequencies are shown in the Table 1, and from Equation (5) the eigen mode function will be as: 00 cos nq PrP zKz z (17) The simulation of the first four patterns of frequency modes is shown in Figure 3. 3.2.2. Frequency Resonators for Radial Modes In the radial modes the indices m and q = 0 and the re- sonance frequencies is calculated by using 02π cn And the Eigen modes distribution will be as: 00nnm PrPrJ kr r (19) The values of the radial frequencies and their corre- sponding pattern are shown in the Tab le 2 and in Figure 4. 3.2.3. Frequen c y Res ona t ors for Mi xt ure Ra di al and Azimuthal Modes In the case of radial and azimuthal modes the indices q = 0 and the resonance frequencies are calculated by using: 0'2π,1 mn Fcmnrn (20) And the Eigen modes distribution will be as: 0 cos ,sin nmn mr m PrPrJKrm (21) The values of the frequencies and their corresponding pattern are shown in the Table 3 and in Figure 5. Table 1. The longitudinal resonance frequency for three cavities (f00q). The C0 = 336 m/s, l = 15 cm, r = 4.5 cmC0 = 313 m/s, l = 2.9 cm, r = 0.3 cm C0 = 360 m/s, l = 10 cm, r = 30 cm qThe frequency (Hz) First cellfrequency (kHz) Second cell frequency (kHz) Third cell 11120 5.397 600 22240 10.793 1200 33360 16.190 1800 44490 21.586 2400 r (18) Figure 3. The first four patterns of longitudinal modes. Copyright © 2011 SciRes. JMP  F. YEHYA ET AL. Copyright © 2011 SciRes. JMP 204 Table 2. The radial resonance frequencies for three cells. The C0 = 336 m/s, l = 15 cm, r = 4.5 cm C0 = 313 m/s, l = 2.9 cm, r = 0.3 cm C0 = 360 m/s, l = 30 cm, r = 10 cm n The frequency (Hz) (First cell) frequency (kHz) (Second cell) freq ue n cy (kHz) (Third cell) 1 4553 68.3 2.05 2 8337 125.1 3.75 3 12090 181.3 5.44 4 15833 237.5 7.125 Figure 4. The first three patterns of radial modes. Table 3. The resonance frequencies of both radial and azi- muthal. The C0 = 336 m/s, l = 15 cm, r = 4.5 cm C0 = 313 m/s, l = 2.9 cm, r = 0.3 cm C0 = 36 0 m/s, l = 30 cm, r = 10 cm m The frequency (Hz) (First cell) frequency (kHz) (Second cell) frequency (kHz) (Third cell) 1 6335 95.02 2.850 2 7969 119.5 3.586 3 9525 142.87 4.286 Figure 5. The radial and azimuthally patterns. In case of radial and azimuthal modes the excited fre- quency of the smallest cavity resonator are much higher than that for other cavities. 3.3. The Effect of the Quality Factor “Q” on the Profile of Eigen Frequency and PAS The cavity resonance having cross section in the range of centimeters usually has high-Q for cavity eigen modes [12]. In general, the typical quality factor is determined from the profile of the Eigen mode of the resonance cav- ity by using Equation (11). But this can also be estimated by considering different type of losses of the cavity [13, 15]. From equation [6], it is very much clear that the am- plitude of the resonance frequency can be enhanced by increasing the Q-factor which can only be achieved by decreasing the losses of the cavity. P. Hess et al. reported that the smoothness of the internal surface of cavity plays very important role to stabilize the profile of the excited mode along with position of maxima and minima. Therefore, it can easily be achieved by polishing the in- ternal surfaces and attaching acoustic filters as an exter- nal buffers at the end of the cavity along with selection of high acoustic impedance microphone. Figures 6(a), (b) and (c) show the effect of the Q- factor on the photo acoustic signals at first resonance frequency for three different modes i.e. longitudinal, azimuthal and radial, respectively for first cell of (R = 4.5 cm., L = 15 cm.). The corresponding frequency is also mentioned in Table 3 It is very much clear that the longitudinal modes with high Q provides the highest photo acoustic signal. Figures 7(a), (b) and (c) describe the effect of Q-factor on the photo acoustic signal of the second cell (R = 3.0 mm, L = 2.9 cm.). It is very much clear that the strength of the PAS related to high Q longitudinal mode shows superiority over the corresponding PAS of radial and azimuthal modes. For the third cell (R = 10.0 cm, L = 30.0 cm.), the graphs between Q-factor Vs. PAS are shown in Figures 8(a), (b) and (c) respectively. We find that the strength of photo acoustic signal is much higher than the signal from other two cavities. But it also to be noted that the effect of different types of losses are being neglected (the detailed study is communicated in another paper). These losses are directly proportional to the cavity size. There- fore, large sized cavity will always have more losses than the small sized cavity. In addition, the cell constant in- versely proportional to the cavity volume which is de- scribed in Figure 10. This shows th e superiority of small sized cavity over the large sized cavity.  F. YEHYA ET AL. 205 (a) (b) (c) Figure 6. Photo acoustic signal at first resonance frequency for all modes for different Q-factor (a), (b), (c) are the first longi- tudinal, radial and azimuthal resonance frequenc y for a fir st. (a) (b) (c) Figure 7. Photo acoustic signal at first resonance frequency for all modes for different Q-factor (a), (b), (c) are the first longi- tudinal, radial and azimuthal resonance frequenc y for a se cond cell. (a) (b) (c) Figure 8. Photo acoustic signal at first resonance frequency for all modes for different Q-factor (a), (b), (c) are the first longi- tudinal, radial and azimuthal resonance frequenc y for a third c e ll. Copyright © 2011 SciRes. JMP 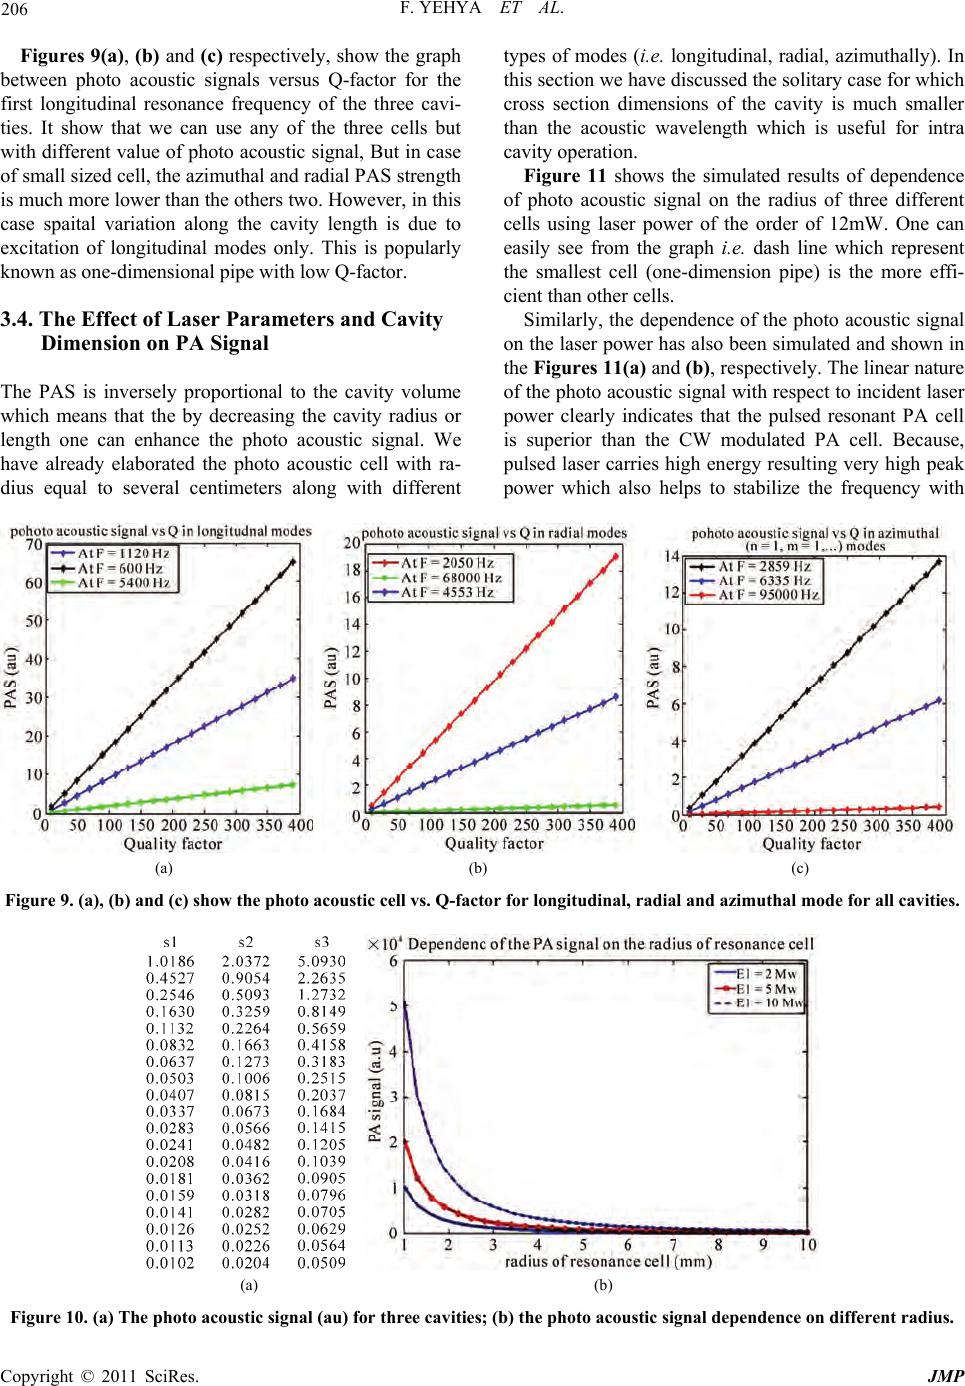 F. YEHYA ET AL. 206 be .4. The Effect of Laser Parameters and Cavity he PAS is inversely proportional to the cavity volume pes of modes (i.e. longitudinal, radial, azimuthally). In the simulated results of dependence of of the photo acoustic signal on Figures 9(a), (b) and (c) respectively, show the graph ty tween photo acoustic signals versus Q-factor for the first longitudinal resonance frequency of the three cavi- ties. It show that we can use any of the three cells but with different value of photo acoustic signal, But in case of small sized cell, the azimuthal and radial PAS strength is mu ch mo re lower t han the others two. However, in this case spaital variation along the cavity length is due to excitation of longitudinal modes only. This is popularly known as one-dimensional pipe with low Q-factor. 3Dimension on PA Signal T which means that the by decreasing the cavity radius or length one can enhance the photo acoustic signal. We have already elaborated the photo acoustic cell with ra- dius equal to several centimeters along with different this section we have discussed the solitary case for which cross section dimensions of the cavity is much smaller than the acoustic wavelength which is useful for intra cavity operation. Figure 11 shows photo acoustic signal on the radius of three different cells using laser power of the order of 12mW. One can easily see from the graph i.e. dash line which represent the smallest cell (one-dimension pipe) is the more effi- cient than other cells. Similarly, the dependence the laser power has also been simulated and shown in the Figures 11(a) and (b), respectively. The linear nature of the photo acoustic signal with respect to incident laser power clearly indicates that the pulsed resonant PA cell is superior than the CW modulated PA cell. Because, pulsed laser carries high energy resulting very high peak power which also helps to stabilize the frequency with (a) (b) (c) Figure 9. (a), (b) ande for all cavities. d (c) show the photo acoustic cell vs. Q-factor for longitudinal, radial and azimuthal mo (a) (b) Figure 10. (a) The photo acoustic signal dependence on different radius. stic signal (au) for three cavities; (b) the photo acou Copyright © 2011 SciRes. JMP  F. YEHYA ET AL. 207 (a) (b) (c) Figure 11. (a) The photo acic signal(au)for three cavi- odes at a time. ear in nature and PA Average Modulated Laser Power uaor of the PA gnal with respect to the incident input laser power ak igu hows the linear behavior of the PA signal ith respect to the incident pulse laser E, The strength of pendence of Photo Acoustic Signal on the igu l is increasing nearly with increase of the gas concentration. However, rst Three Longitudinal igu ow the Pressure dependence f the PAS which is plotted after optimizing the over- oust ties and the photo acoustic signal dependence on average laser power; (b) The photo acoustic signal(au) for three cavities and the photo acoustic signal dependence on pulse peak power; (c) The effect of the concentration of gas on the photo acoustic signal. excite all the exiting m negligible effect of “Q” value. Pulsed laser also help to Figure 11(c) shows the graph between PA signal Vs. Concentration of the gas which is lin S strength increases with the concentration of gas. 3.5. Dependence of the PA Signal on the tion (8) clearly shows the linear behaviEq si which is shown in Figure 11(a) for CW laser source. 3.6. Dependence of the PA Signal on Pulsed Pe Power re 11(b) sF w the PA signal gets enhanced with enhanced input laser power. 3.7. De Concentration of a Sample Gas re 11(c) clearly shows that the signaF li for some gases this linearity can be maintained up to certain limit as a factor of increasing the concentration of the sample gas which ultimately reduces the signal be- yond certain concentration due to adsorption of sample gas on the walls of cell. 3.8. Third Part: The Fi Modes vs. Pressure res 12(a), (b) and (c) shF o lapped integral factor Ft which also represent the interac- tion between laser beam and frequency modes .The value of Ft has been optimized to the unity by considering each specific location of eigen modes and suitable laser beam intensity at specific resonance frequency for the given photo acoustic detector. From Equation (15) it is very much clear that photo acoustic signal explicitly depends on the absorption coefficient α which means that the PA signal depends on the amount of optical power absorbed by the gas which is linear in nature with change of pres- sure of buffer gas. Figures 12(a), (b) and (c) show the photo acoustic dependency on the pressure at first three longitudinal modes for three different cavities. There are two distinguish pressure regions, out of which the in the first pressure region PA signal increases drastically with ascending value of pressure which is due to the change Copyright © 2011 SciRes. JMP  208 F. YEHYA ET AL. (a) (b) (c) (d) Figure 12. The simulation of photo a) L = 10 cm, R = 5 cm (b) L = f concentration and fast relaxation from excitation states. sure is no shows the dependence of PAS on the ab . Conclusions e have successfully simulated the designing aspects of nance frequencies for longitudinal, radial and azimuth- coustic signal Vs pressure for the first three longitudinal modes (a 2.9 cm, R = 3 mm (c) L = 15 cm, R = 4.5 cm (d) the dependence of PAS on the absorption coefficient with R = 10 cm, L = 30 cm. o While the second pressure region appears just after first region, where photo acoustic signal almost get saturated due to dominating effect of collision broadening. The dependence of PA signal on varying pres t similar for all resonance frequency because each re- sonance frequency has its own pressure which is respon- sible for getting saturation point for each one of them independently. Figure 12(d) sorption coefficient for the first longitudinal and radial modes for the third cell (R = 10.0 cm, L= 30.0 cm). 4 W different types of resonant photo acoustic systems/cells for trace gas monitoring. The calculated values of reso- ally modes for three different types of cavity resonators show that the reduced volumes of the resonator enhances the efficiency of the sensor. In addition, simulation re- sults also show that at radial and azimuthal modes related to the smallest cavity resonators are much higher than that for other cavities. In present work, we have success- fully demonstrated the feasibility aspects based on the dimension of the resonant cavity along with their limita- tions. For small sized cavity to it is difficult to detect PAS produced by excited radial and azimutal modes. In addition, the small sized PA cell has the cross section of the cavity resonator smaller than the acoustic wavelength as a result the excited field appears as a spaital variation along the cavity and treated as one dimensional pipe. Also the variation of pressure a, cavity radius, laser power and absorption coefficients along with the detec- tion concentration ha ve been studied. Copyright © 2011 SciRes. JMP 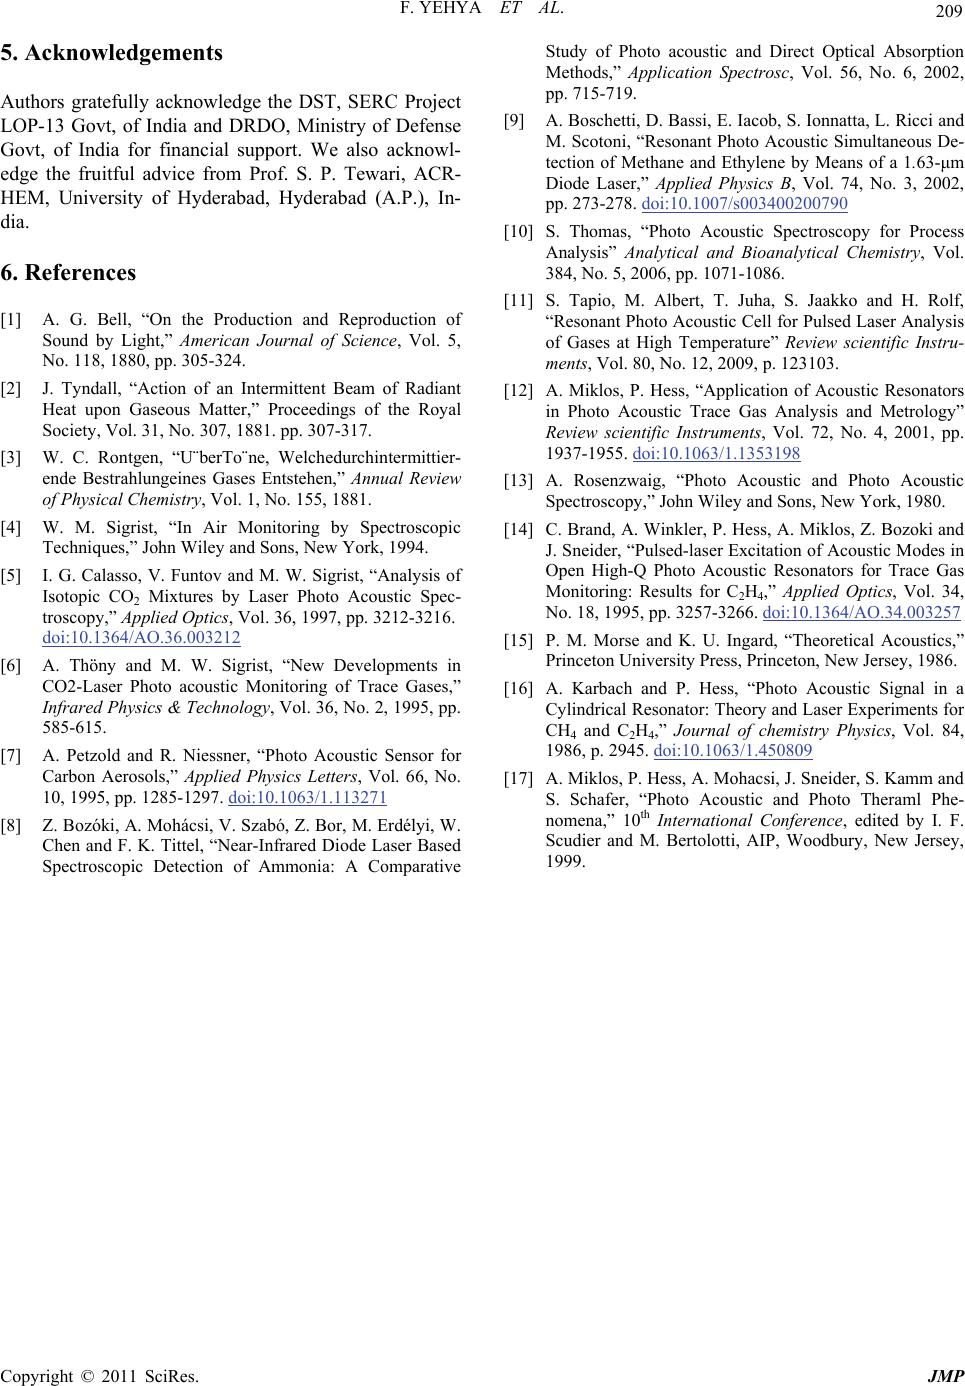 F. YEHYA ET AL. 209 the DST, SERC Project OP-13 Govt, of India and DRDO, Ministry of Defe eferences On the Production and Reproduction of American Journal of Science, Vol. 5, Proceedings of the Royal ual R , 1994. ec- 5. Acknowledgements Authors gratefully acknowledge Lnse Govt, of India for financial support. We also acknowl- edge the fruitful advice from Prof. S. P. Tewari, ACR- HEM, University of Hyderabad, Hyderabad (A.P.), In- dia. 6. R [1] A. G. Bell, “ Sound by Light,” No. 118, 1880, pp. 305-324. [2] J. Tyndall, “Action of an Intermittent Beam of Radiant Heat upon Gaseous Matter,” Society, Vol. 31, No. 307, 1881. pp. 307-317. [3] W. C. Rontgen, “U¨berTo¨ne, Welchedurchintermittier- ende Bestrahlungeines Gases Entstehen,” Anneview of Physical Chemistry, Vol. 1, No. 155, 1881. [4] W. M. Sigrist, “In Air Monitoring by Spectroscopic Techniques,” John Wiley and Sons, New York [5] I. G. Calasso, V. Funtov and M. W. Sigrist, “Analysis of Isotopic CO2 Mixtures by Laser Photo Acoustic Sp troscopy,” Applied Optics, Vol. 36, 1997, pp. 3212-3216. doi:10.1364/AO.36.003212 [6] A. Thöny and M. W. Sigrist, “New Developments in CO2-Laser Photo acoustic Monitoring of Trace Gases,” rosols,” Applied Physics Letters, Vol. 66 Infrared Physics & Technology, Vol. 36, No. 2, 1995, pp. 585-615. [7] A. Petzold and R. Niessner, “Photo Acoustic Sensor for Carbon Ae, No. 10, 1995, pp. 1285-1297. doi:10.1063/1.113271 [8] Z. Bozóki, A. Mohácsi, V. Szabó, Z. Bor, M. Erdélyi, W. Chen and F. K. Tittel, “Near-Infrared Diode Laser Based Spectroscopic Detection of Ammonia: A Comparative Study of Photo acoustic and Direct Optical Absorption Methods,” Application Spectrosc, Vol. 56, No. 6, 2002, pp. 715-719. [9] A. Boschetti, D. Bassi, E. Iacob, S. Ionnatta, L. Ricci and M. Scotoni, “Resonant Photo Acoustic Simultaneous De- tection of Methane and Ethylene by Means of a 1.63-μm Diode Laser,” Applied Physics B, Vol. 74, No. 3, 2002, pp. 273-278. doi:10.1007/s003400200790 [10] S. Thomas, “Photo Acoustic Spectroscopy for Process Analysis” Analytical and Bioanalytical Chemistry, Vol. 384, No. 5, 2006, pp. 1071-1086. [11] S. Tapio, M. Albert, T. Juha, S. Jaakko and H. Rolf, “Resonant Photo Acoustic Cell for Pulsed Laser Analysis of Gases at High Temperature” Review scientific Instru- ments, Vol. 80, No. 12, 2009, p. 123103. [12] A. Miklos, P. Hess, “Application of Acoustic Resonators in Photo Acoustic Trace Gas Analysis and Metrology” Review scientific Instruments, Vol. 72, No. 4, 2001, pp. 1937-1955. doi:10.1063/1.1353198 [13] A. Rosenzwaig, “Photo Acoustic and Photo Acoustic Spectroscopy,” John Wiley and Sons, New York, 1980. [14] C. Brand, A. Winkler, P. Hess, A. Miklos, Z. Bozoki and J. Sneider, “Pulsed-laser Excitation of Acoustic Modes in Open High-Q Photo Acoustic Resonators for Trace Gas Monitoring: Results for C2H4,” Applied Optics, Vol. 34, No. 18, 1995, pp. 3257-3266. doi:10.1364/AO.34.003257 [15] P. M. Morse and K. U. Ingard, “Theoretical Acoustics,” Princeton University Press, Princeton, New Jersey, 1986. [16] A. Karbach and P. Hess, “Photo Acoustic Signal in a Cylindrical Resonator: Theory and Laser Experiments for CH4 and C2H4,” Journal of chemistry Physics, Vol. 84, 1986, p. 2945. doi:10.1063/1.450809 [17] A. Miklos, P. Hess, A. Mohacsi, J. Sneider, S. Kamm and S. Schafer, “Photo Acoustic and Photo Theraml Phe- nomena,” 10th International Conference, edited by I. F. Scudier and M. Bertolotti, AIP, Woodbury, New Jersey, 1999. Copyright © 2011 SciRes. JMP
|