 Journal of Geoscience and Environment Protection, 2014, 2, 181-189 Published Online June 2014 in SciRes. http://www.scirp.org/journal/gep http://dx.doi.org/10.4236/gep.2014.23023 How to cite this paper: Subasinghe, N. D. et al. (2014). Analytical Signal and Reduction to Pole Interpretation of Total Magnetic Field Data at Eppawala Phosphate Deposit. Journal of Geoscience and Environment Protection, 2, 181-189. http://dx.doi.org/10.4236/gep.2014.23023 Analytical Signal and Reduction to Pole Interpretation of Total Magnetic Field Data at Eppawala Phosphate Deposit N. D. Subasinghe1*, W. K. D. G. D. R. Charles1, S. N. De Silva2 1Institute of Fundamental Studies, Kandy, Sri Lanka 2Geological Survey and Mines Bureau, Pitakotte, Sri Lanka Email: *deepal@ifs.ac.lk Received April 2014 Abstract A magnetic survey was carried out to find out the possibilities of demarcating a phosphate deposit from the surrounding country rocks. It is a well-established fact that the magnetic mapping can be utilised to investigate the subsurface objects, materials or different rock types based on their magnetic properties. Those rocks with ferro-magnetic minerals such as magnetite generate mag- netic anomalies which in turn help to investigate the subsurface occurrence of mineral deposits. An economic phosphate deposit in Sri Lanka, known as Eppawala Phosphate deposit was selected for this study. The deposit was formed as an accumulation of secondary products of an apatite-rich carbonatite. Due to weathering of iron-rich carbonatite, magnetite and its derivatives are inti- mately bound with the said deposit. Therefore, the magnetic signature of the phosphate body is different to that of the surrounding country rocks. Despite some studies on different aspects of the deposit, subsurface extents of the ore body are so far not adequately studied. Therefore, this study was conducted to identify the boundaries of the phosphate body. The study was carried over an area of 12 km2 5 km north from the current mining site and survey was conducted. GSM-19 Over- houser system with integrated GPS was used to collect field data. Magnetic anomalies were plotted using a predefined grid. The maximum positive and negative anomalies encountered in the survey area are 690 nT and 829 nT respectively. This study showed that magnetite is not distributed evenly in the area and the deposit extended along the north south direction. Further, processing of analytical signal using the anomalies showed that the carbonatite occurs as a continuous body trending in North South direction. Low magnetic latitudes magnetic data interpretation is difficult because the vector nature of the magnetic field. Therefore, “reduction to pole” concept and “ana- lytical signal concept” were used for the data analysis. Reduction to pole map and analytical signal map are comparatively similar and the change of declination value has no significant effect on the map of reduction to pole. Keywords Magnetic Anomal y, Analytical Signal, Reduction to Pole *  N. D. Subasinghe et al. 1. Introduction Sri Lanka is situated between longitudes 79˚40'E to 81˚55'E and latitudes 5˚55'N to 9˚50'N. It has an area of ap- proximately 65,000 km2. Ninety percent of the country is underlain by Precambrian metamorphic rocks and rest of the country (north and northwest) is covered by limestone of Miocene period. Precambrian crystalline rocks are divided into three main zones (Highland complex, Wanni complex and Vijayan complex) and sub-zones (e.g. Kadugannawa com- plex) based on rock type, metamorphic grade and isotopic characteristics, as shown in Figure 1 (Kroner et al., 2013). Eppawala Phosphate deposit is located in Anuradapura district of Sri Lanka as shown in Figure 2. It was first reported by Jayawardena (1976). Among the natural resources in Sri Lanka, Eppawala phosphate deposit has a significant place, due to its economic importance. Magmatic origin was suggested by Jayawardena (1976) for this phosphate deposit, since the parent rock is a carbonatite intrusion. Major minerals of the deposit are calcite, dolomite, apatite and olivine, while minor minerals include spinel, ilmonite, magnetite, amphiboles and micas (Manthilake et al., 2008; Pitawela & Lottermoser, 2012). Despite having a number of studies on geological, geochemical and petrological aspects of the deposit, litera- ture on geophysical aspects are rare. Apart from some bore hole studies conducted in 1970’s no systematic sur- vey has been conducted to estimate the extent and the boundaries of the Eppawala phosphate deposit. The de- marcation of the apatite deposit and country rock is economically important for mining and planning activities. Gravity method and resistivity method are the widely used geophysical techniques for resource exploration in general. Magnetic method is widely used for exploring ore bodies containing magnetic minerals such as iron, nickel and cobalt bearing minerals. In this project, we used magnetic method as the geophysical technique, be- cause Eppawala phosphate deposit contains magnetite (Dahanayake & S uba singh e, 1988; Subasinghe, 1998), which is a common accessory mineral found in many other apatite deposits around the world (Rajesh et al., 2006). This ferromagnetic mineral produces an induced magnetic field influenced by earth’s magnetic field, which is useful in demarcating the magnetite-bearing rocks from the others. Since Sri Lanka is located near the magnetic equator, “reduce to pole” concept is employed for data analysis (MacLeod et al., 1998). 2. Theory Nabighian (1972 &1974) developed the concept of 2-D analytical signal, or energy envelope, of magnetic anomalies. The amplitude of the 3-D analytic magnetic field signal at location (x,y) can be expressed as: 2 22 |( ,)|dT dT dT Axydx dydz = ++ where, is the amplitude of the analytical signal at (x,y); T is the observed magnetic field at (x,y). The purpose of the reduction to the pole is to take an observed total magnetic field map and produce a magnetic map that would result, had an area been surveyed at the magnetic pole. Assumpsion is, all the observed magnetic fields of the survey area are due to induced magnetic effects. [ ] 2 1 () sin( )cos( )cos() LIi ID Θ= + −Θ where, is the wavenumber direction; I is the magnetic inclination; D is the magnetic declination. 3. Methodology GSM-19 portable magnetometer with integrated GPS (Global positioning System) system was used for the magnetic survey, with a base-station for diurnal correction. Based on the literature and preliminary studies, the survey was started at a point 5 km away from the current northern quarry of the deposit (Figure 1). The survey lines were extended up to 3.0 km in the east-west direction 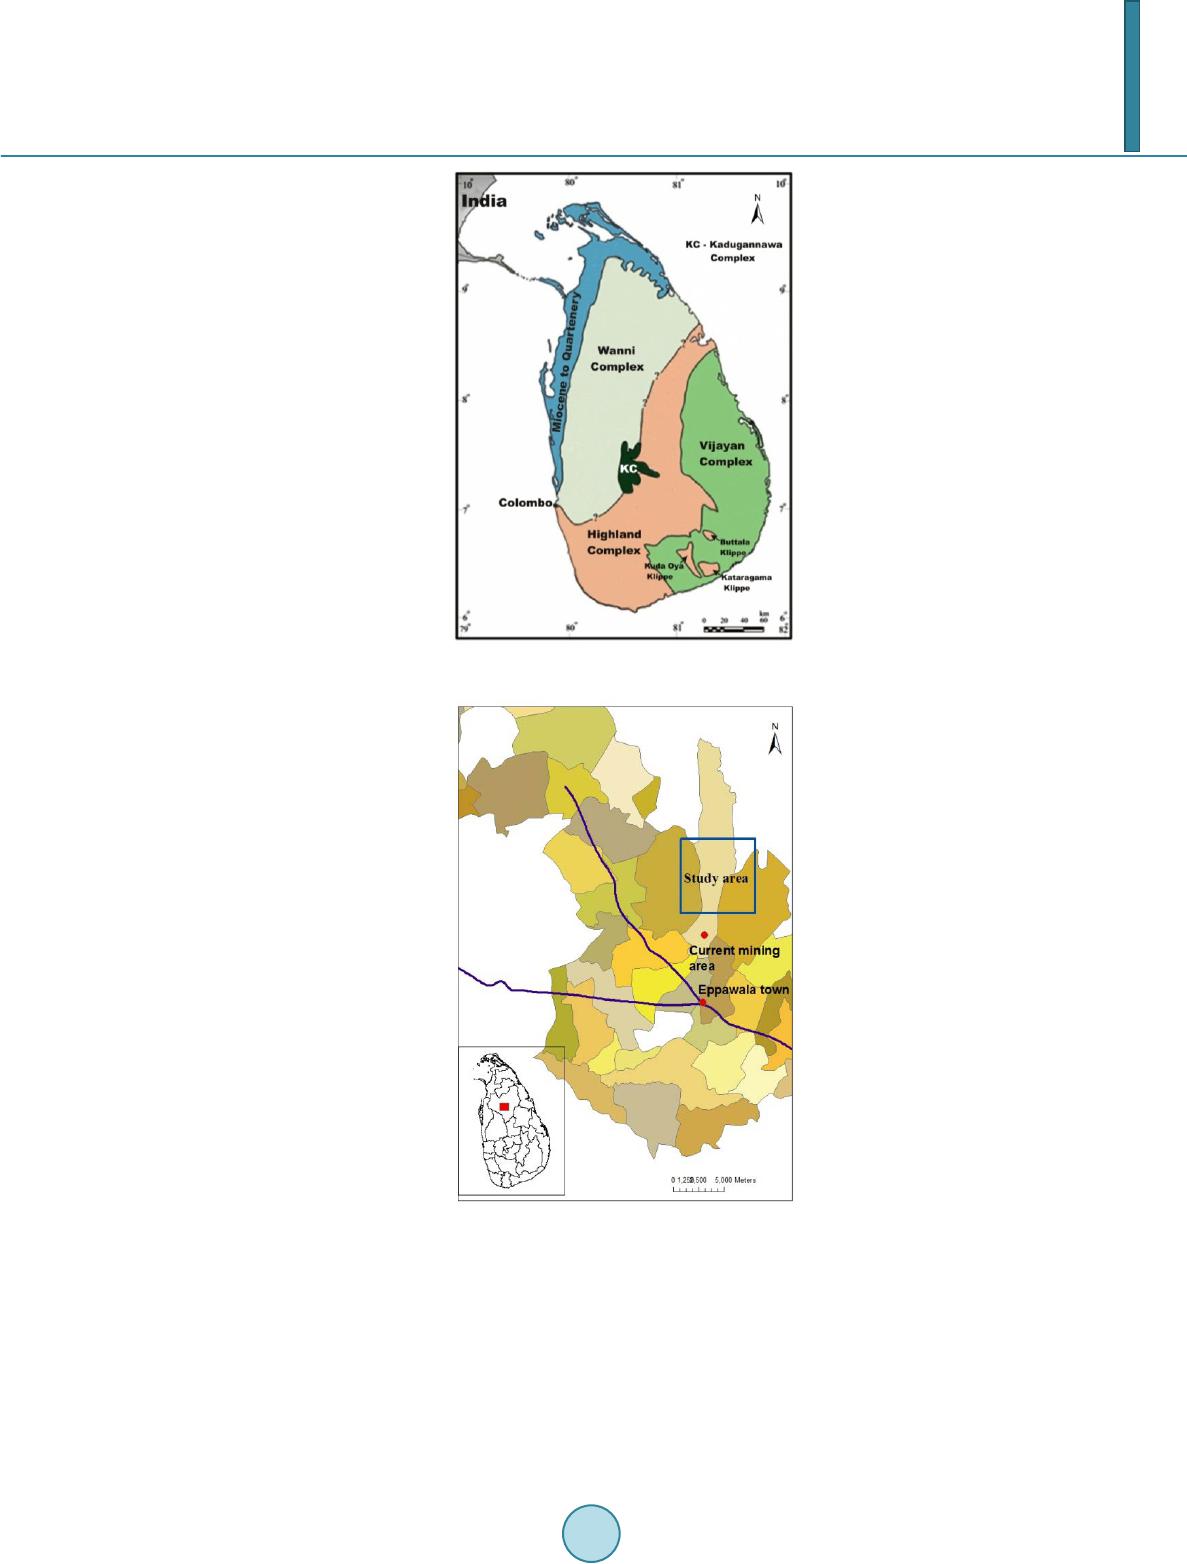 N. D. Subasinghe et al. Figure 1. Main precambrian lithotectonic units. Figure 2. Apatite deposit and area of study. with a 500 m distance between them to make up the grid. The base station was located either on the survey line or on the adjacent one. 4. Area of Study Eppawala apatite deposit was located about 200 km away from capital city of Colombo, in Anuradapura district (Figure 2 inset). The carbonatite complex forms six hillocks and seconday apatite deposit which is leached from carbonatite  N. D. Subasinghe et al. complex (Jayawardena, 1976). Our study area was located about 5 km north of the current mining site (Figure 2). Present mining process is based on the map made in 1976. 5. Results and Discussion Magnetic anomalies were calculated using walking magnetometer data and base-station data. Distribution of the magnetic anomaly is shown in the Figure 3. Location 01 and 02 showed maximum positive anomaly where lo- cation 03 showed maximum negative anomaly. Earth induced magnetic field of the magnetite in the carbonatite causes the anomaly. According to magnetic anomalies, locations 01 and 02 may have the maximum concentra- tion of magnetite. Magnetic anomalies show that magnetite is neither distributed evenly in the area nor continu- ally. An object with two magnetic poles can produce positive and negative anomalies. In Figure 3, pink areas show the positive anomaly, whereas blue areas show the negative anomaly. If a grain of magnetite is assumed to be a bar-magnet, each side of the grain act as either North or South Pole. All magnetite grains in the area act as a single magnetite body and produce anomalies in the area. Figure 4 shows the magnetic anomaly map after assuming all magnetite grains act as one magnetite body. Location 01 in Figure 4 shows the body of the magnetite. According to the literature, country rock in the area is mainly granitic gneiss, while magnetite is mostly found in the carbonatite rock, which is the parent rock of the phosphate de- posit. Therefore, the phosphate deposit extends along north south direction. The carbonatite host rock extends further to the north from our surveyed area. Though there are no outcrops in the area, the data suggests a sub- surface deposit. Central part of the deposit is close to the surface and depth of the deposit is increasing along the East-West direction. Magnetic data were further analysed using reduce to pole (RTP) method and the resulted maps are shown in Figure 5. The inclination was kept in constant and declination was change from 30˚ to 90˚. Maps of RTP were compared with map of the analytical signal. Comparison of maps of RTP and map of analytical, no significance difference is shown. Area of “A” in the map of analytical signal shows gradual decrease of the anomaly from middle to left side of the map. However, in maps of RTP, drastic change of the anomaly from higher to lower values is evident. Declination of the induced field was changed from 30˚ to 90˚, but there is no significant dif- ference in the middle area of the maps. This suggests that the declination has no significant effect on this in- duced field. The natural inclination and declination in Sri Lanka are −1.2 ˚ and −2.4˚ respectively. Figure 6 shows a map derived by substituting those inclination and declination values in Sri Lanka. In Figure 7, inclination of 30˚ is kept constant and declination was changed from 30˚ to 90˚ by 30 degree in- tervals. Relatively these three maps are similar. Even the maps with inclination 0˚ (in Figure 5) show similari- ties with the maps with inclination 30˚. According to the literature, most suitable approach is the analytical sig- nal concept because very large amplitude correction is required for north-south features at low magnetic lati- tudes. Contour map of analytical signal is shown in Figure 8. Contour values were extracted where the horizontal lines cross the contours and plot the contour value as a function of distance (Figure 9). A cross section of the deposit can be constructed using the above graphs. It is a well established fact that the parent rock of the Eppawala phosphate deposit is carbonatite, which is an igneous rock. This igneous body has been intruded as an intrusive body into the surrounding meta-sedimentary country rocks. Therefore, most prob- able the shape of the cross sectionalong the line 4 is as shown in Figure 10. 6. Conclusion Map of RTP and map of analytical signal show comparatively similar map and declination has no significant ef- fect on this map of RTP. The magnetic anomalies are not evenly distributed in the area and so is the magnetite. Highest positive magnetic anomaly value is 690.29 nT and the negative value is −825.66 nT. The phosphate de- posit extends along the north south direction in the subsurface confirming the supposition made by the previous workers. However, the extent of the phosphate deposit extends further to the north than the earlier workers sug- gested. 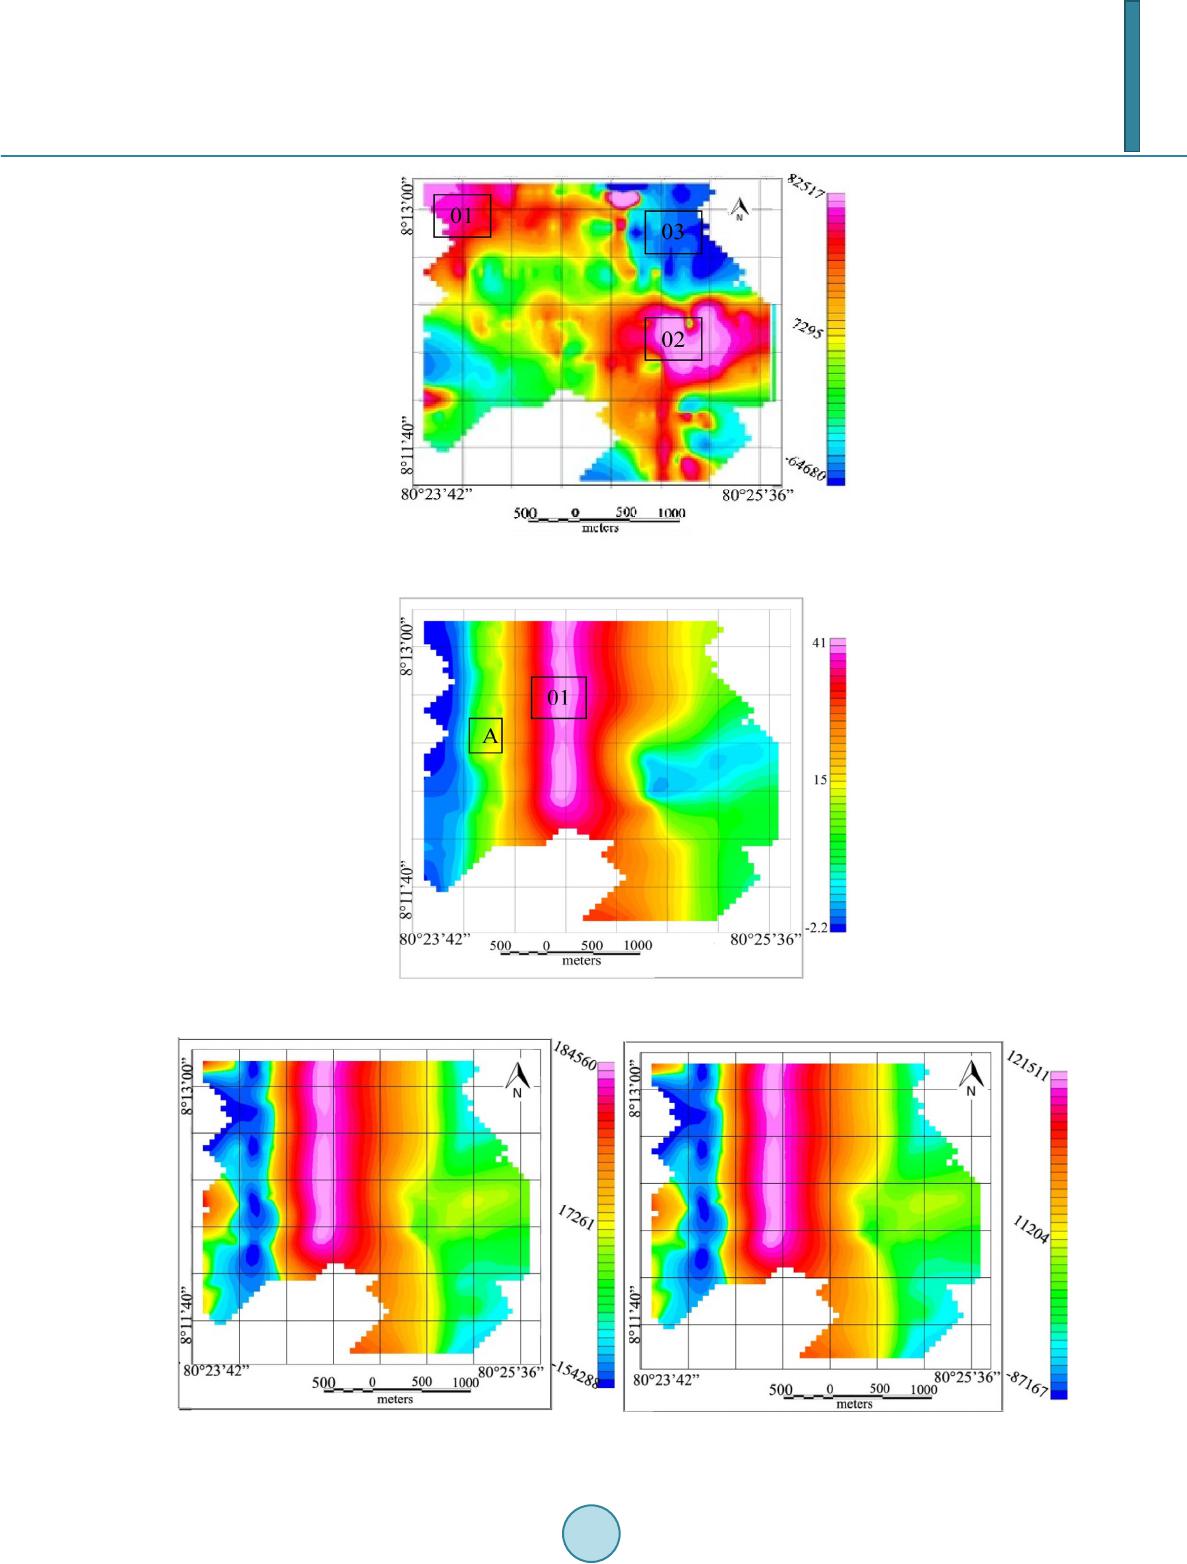 N. D. Subasinghe et al. Figure 3. Magnetic anomaly map. Figure 4. Map of analytical signal. (a) (b) 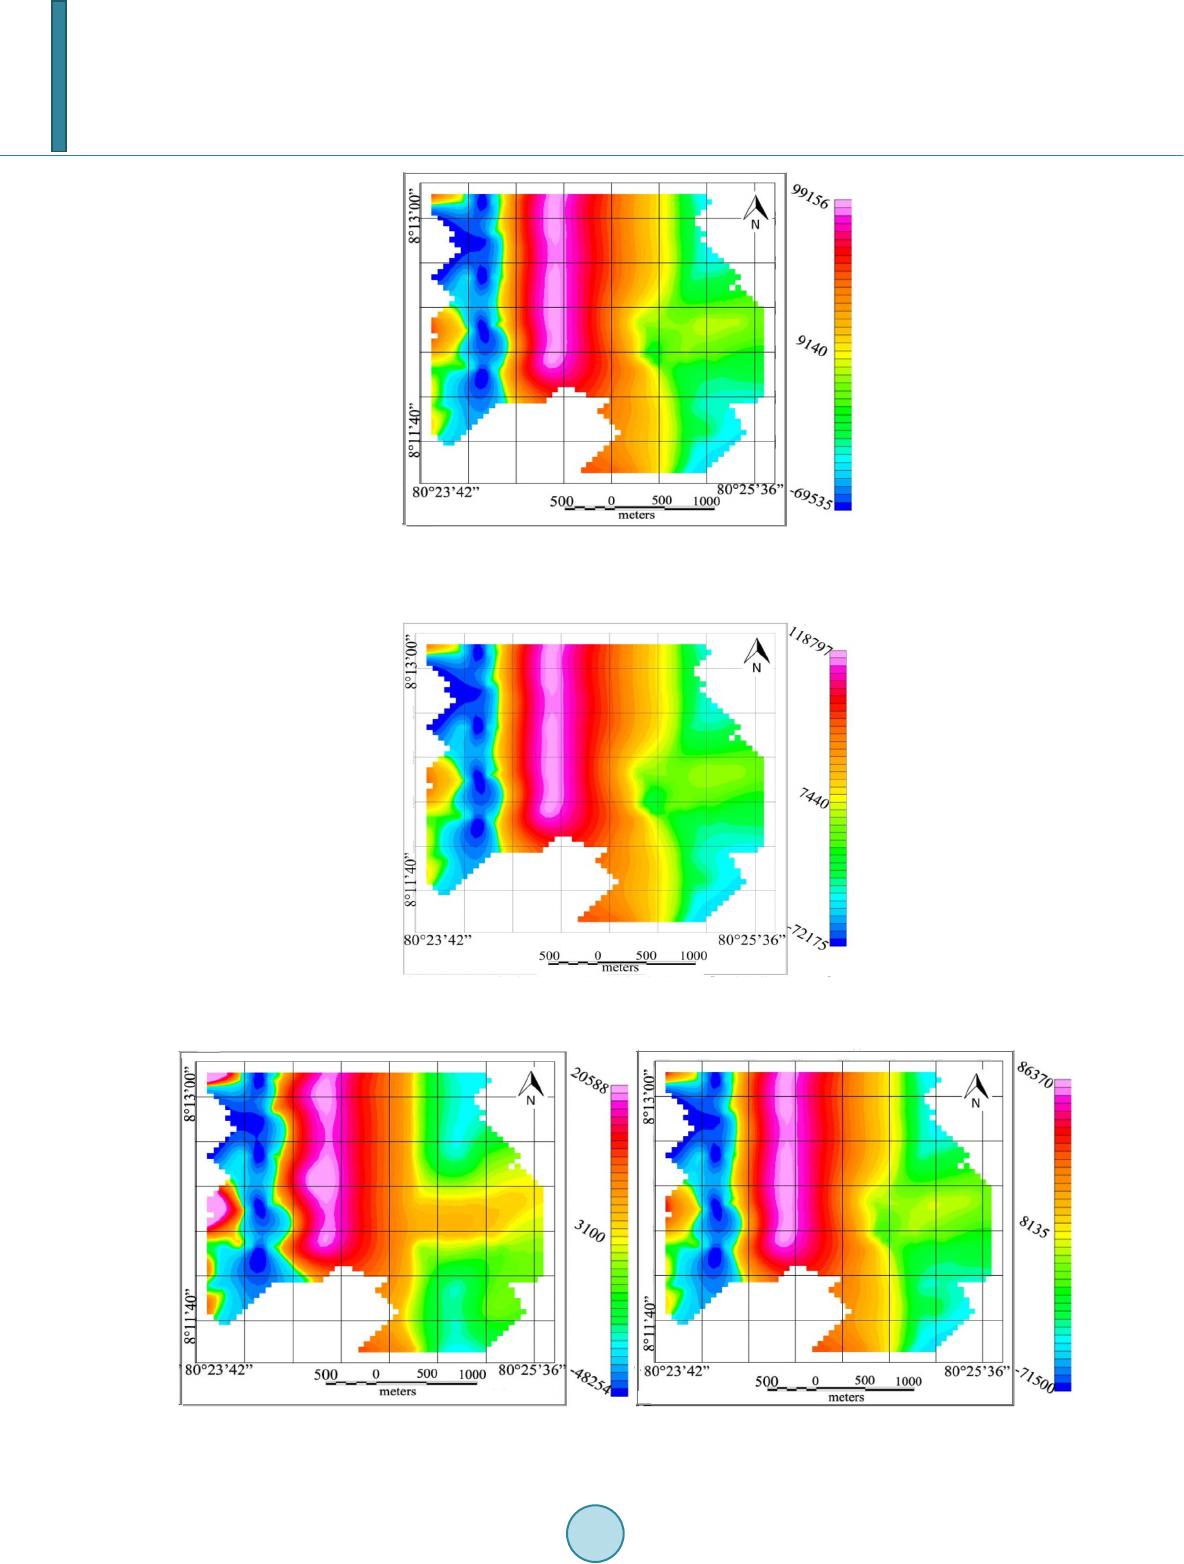 N. D. Subasinghe et al. (c) Figure 5. Map of reduce to pole (a) inclination 0˚ and declination 30˚ (b) inclination 0˚ and declination 60˚ (c) inclination 0˚ and declination 90˚. Figure 6. Map of reduction to pole with inclination −1.2˚ and declination −2.4˚. (a) (b) 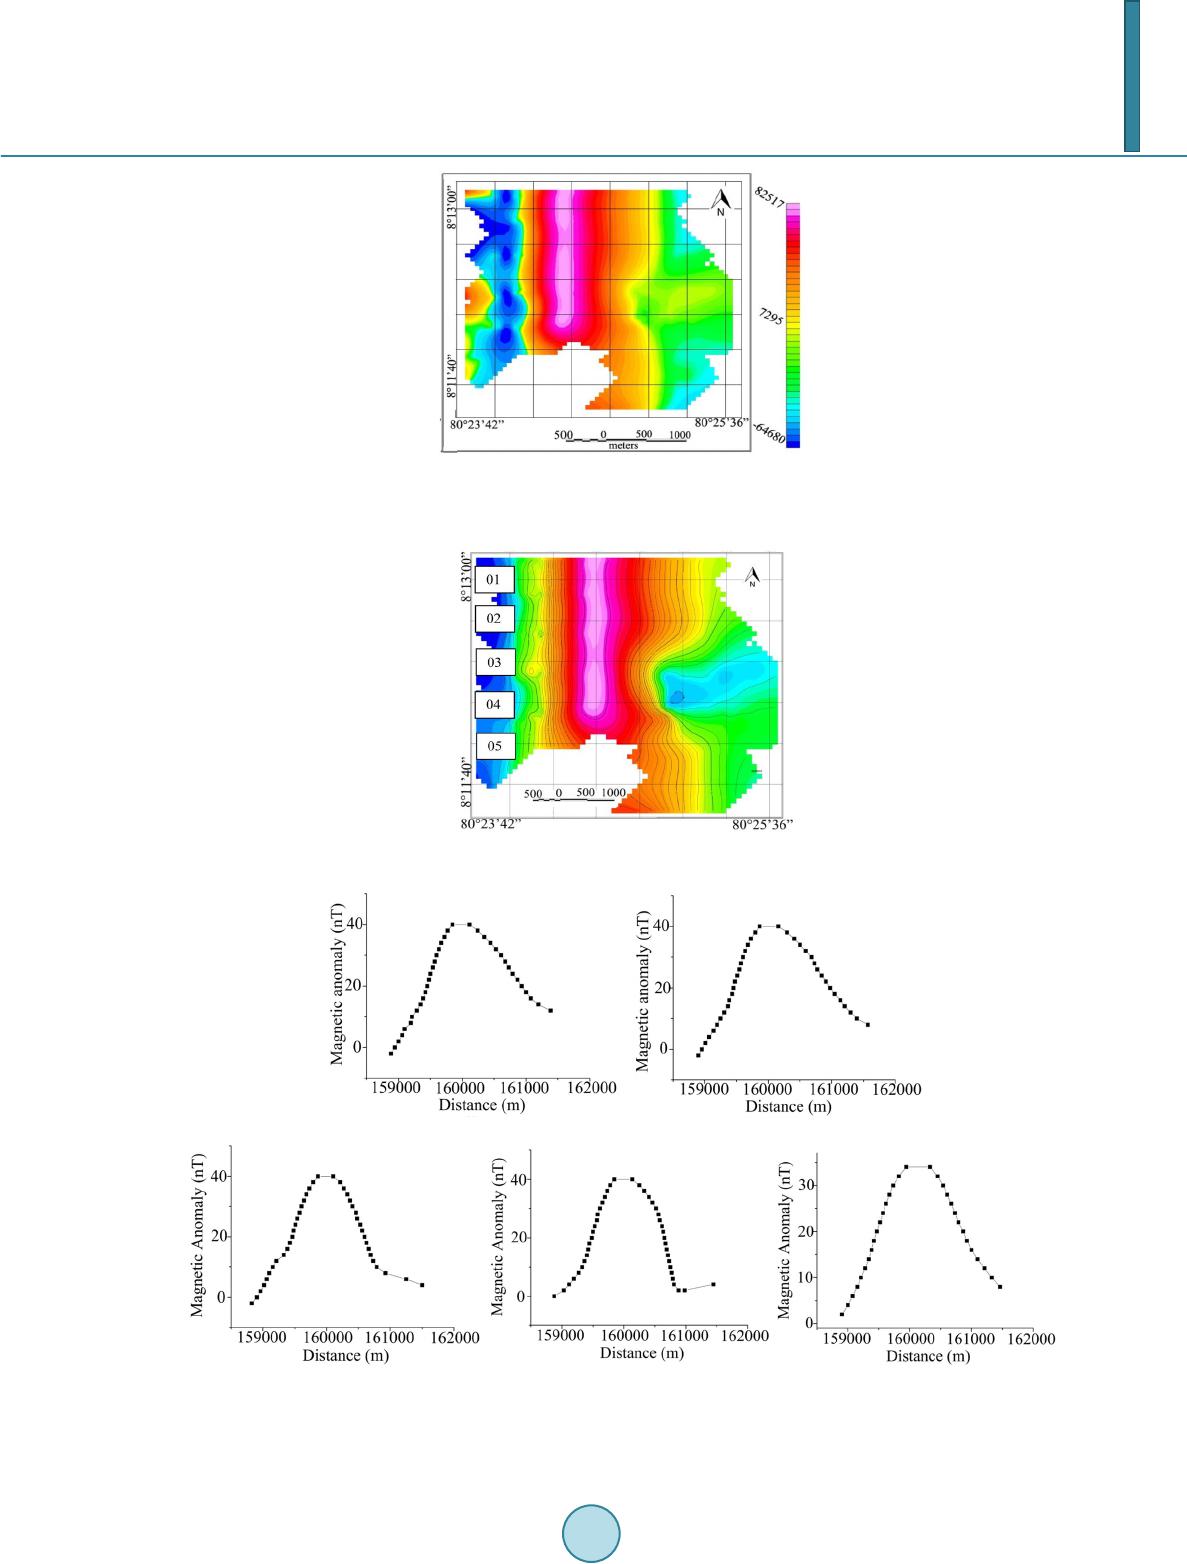 N. D. Subasinghe et al. (c) Figure 7. Map of reduce to pole (a) inclination 30˚ and declination 30˚ (b) inclination 30˚ and declination 60˚ (c) inclination 30˚ and declination 90˚. Figure 8. Contour map of analytical signal. (a) (b) (c) (d) (e) Figure 9. Variation of contour values as a function of distance (a) line one, (b) line two, (c) line three, (d) line four, (e) line five. 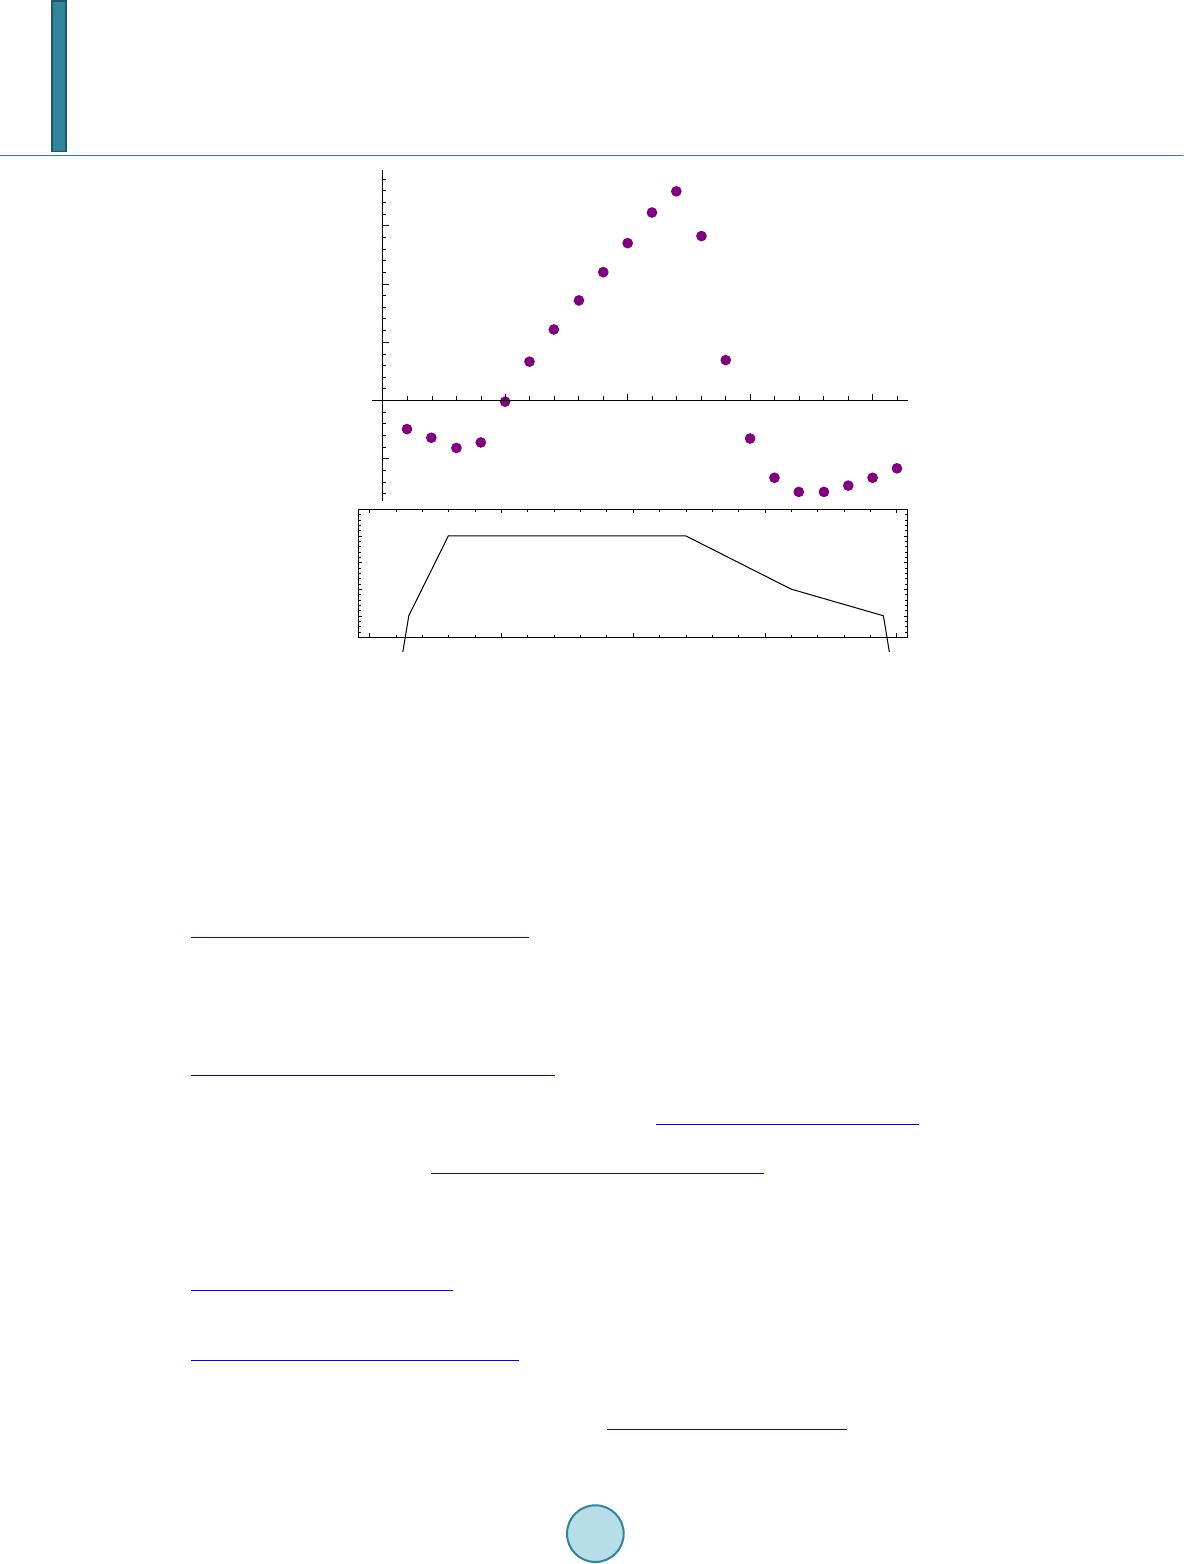 N. D. Subasinghe et al. Figure 10. Cross section along line four. Acknowledgements Authors wish to thank the Director of Institute of Fundamental Studies (Sri Lanka), Geological survey and mines bureau (GSMB Sri Lanka), Dr. A. Pitawela Ms. A. Samaranayake and Mr. A. Tennakoon. Grant RG/ 2012/NRB/03 from National Science Foundation, Sri Lanka is acknowledged for the financial support. References Dahanayake, K., & Subasinghe, S. M. N. D. (1988). Development of Recent Stromatolitic Structures and Phosphatic En- richment in Precambrian Marble of Sri Lanka. Economic Geology, 83, 1468-1474. http://dx.doi.org/10.2113/gsecongeo.83.7.1468 Jayawardena, D. E. de S. (1976). The Eppawala Carbonatite Complex in North-West Sri Lanka. Geological Survey Depart- ment Bulletin. Kröner, A., Rojas-Agramonte, Y., Kehelpannala, K. V. W., Zack, T., Hegner, E., Geng, H. Y., Wong, J., & Bar th , M. (2013). Age, Nd-Hf Isotopes, and Geochemistry of the Vijayan Complex of Eastern and Southern Sri Lanka: A Grenville-Age Magmatic Arc of Unknown Derivation. Precambrian Research, 234, 288-321. http://dx.doi.org/10.1016/j.precamres.2012.11.001 MacLeod, I. N., Jones, K., & Dai, T. F. (1993). 3-D Analytic Signal in the Interpretation of Total Magnetic Field Data at Low Magnetic Latitudes. Exploration Geophysics, 24, 679-688. http://dx.doi.org/10.1071/EG993679 Manthilake, M., Sawada, Y., & Sakai, S. (2008). Genesis and Evolution of Eppawala Carbonatites, Sri Lanka. Journal of Asian Earth Sciences, 32, 66-75. http://dx.doi.org/10.1016/j.jseaes.2007.10.015 Nabighian, M., Grauch, V. J. S., Hansen, R. O., LaFehr, T. R., Li, Y., Peirce, J. W., Phillips, J. D., & Ruder, M. E. (2005). The Historical Development of the Magnetic Method in Exploration. Geophysics, 70, 33ND-61ND. Nabighian, M. N. (1972). The Analytic Signal of Two-Dimensional Magnetic Bodies with Polygonal Cross-Section: Its Properties and Use for Automated Anomaly Interpretation. Geophysics, 37, 507-517. http://dx.doi.org/10.1190/1.1440276 Pitawala, A., & Lottermoser, B. G. (2012). Petrogenesis of the Eppawala carbonatites, Sri Lanka: A Cathodoluminescence and Electron Microprobe Study. Mineralogy and Petrology, 105, 57-70. http://dx.doi.org/10.1007/s00710-012-0193-y Rajesh, V. J., Yokoyama, K., Santosh, M., Arai, S., Oh, C. W., & Kim, S. W. (2006). Zirconolite and Baddeleyite in an Ul- tramafic Suite from Southern India: Early Ordovician Carbonatite-Type Melts Associated with Extensional Collapse of the Gondwana Crust. The Journal of Geology, 114, 171-188. http://dx.doi.org/10.1086/499571  N. D. Subasinghe et al. Subasinghe, N. D. (1998). Formation of a Phosphate Deposit through Weathering and Diagenesis—An Example from Sri Lanka. PhD Thesis (Unpubl.) University of Reading. Talwani, M. (1965). Computation with the Help of a Digital Computer of Magnetic Anomalies Caused by Bodies of Arbi- trary Shape. Geophysics, 30, 797-817. http://dx.doi.org/10.1190/1.1439654
|