Paper Menu >>
Journal Menu >>
 Geomaterials, 2011, 1, 14-20 doi:10.4236/gm.2011.11002 Published Online April 2011 (http://www.SciRP.org/journal/gm) Copyright © 2011 SciRes. GM Engineering Economy Analysis on the Production of Iron Ore in Nigeria R. A. Adebimpe1*, J. M. Akande2 1The Federal Polytechnic, Ado-Ekiti, Deparment of Mineral Resources Engineering, Ado-Ekiti, Nigeria 2Federal University of Technology, Akure, Dept of Mining Engineering, Ado-Ekiti, Nigeria E-mail: rasheed4u1@yahoo.com Received February 24, 2011; revised March 2, 2011; accepted March 22, 2011 Abstract In line with the Federal government decision to attract direct foreign investment to the solid mineral sector and to further diversify the Nigerian economy; this study used the discounted cash flow micro-economic as- sessment to evaluate large-scale iron ore production in Nigeria. The iron ore project has an initial investment cost of US$ 73.934 m, annual expenditure and benefit of US$ 48.128 m and US$ 270 m respectively. The net present value (NPV), internal rate of return (IRR) and payback period of financial analysis at 100% ca- pacity utilizations are US$ 833.10 m, 444.36% and 6 years respectively. The economic assessment also shows a positive NPV at both 75% and 60% capacity utilizations. The study further show that the iron ore project has good economic potential and will also guide potential investor(s) in making decision on whether or not to commit resources to the project. Keywords: Iron Ore, Micro-Economic Assessment, Solid Mineral Sector, Nigeria 1. Introduction The decision to develop a particular deposit is based on the net present value (NPV) 1. NPV is one of the mi- cro-economic assessment tool used to evaluate the feasi- bility of project and it must be positive for a project to be considered worthwhile. The use of discounted cash flow analysis is a tool in the economics of the mining industry in the last 30 years, it has become common to define an ore reserve as that part of a mineral resource whose ex- ploitation can generate maximum net present value (NPV) or return on investment 2. NPV entails forecasting the stream of future net revenues a mineral resource would generate if exploited optimally, and then discounting this revenue stream using appropriate cost of capital 3.At the planning stage of a mining project it is necessary to gather relevant data and also determine factors that would influence the attainment of the highest NPV.The objective of the planning process for an open pit mine is usually to find optimum annual schedules that will give highest net present value(NPV) while meeting the vari- ous production, blending, sequencing and pit slope con- stra ints 4. Determining the feasibility of a mineral property may be simple or sophisticated but has one pri- mary goal and this is to demonstrate that the project is economically viable if it is designed and operated appro- priately 5. Iron ore occurrence has been established in Itakpe, Ajabanoko, Agbaja, Chokochoko, Agbade Okude and Nsude hills (Figure 1; Table 1). The ore reserves vary from two billion tons to thirty million tons and the deposits are of the type’s hematite-magnetite, heama- tite-geothite and siderite goethite 6. However out of the iron ore deposits listed above only the Itakpe iron ore mine have so far been developed and it started produc- tion in 1979.The exploitation of the iron ore includes the following process: i) development of the access roads, the creation of benches,platforms,safety ramps and the development of safe and economically acceptable slope faces; ii) drilling and blasting of the benches; iii) truck haulage of the run-of-mine to the crushing plant; iv) truck haulage of the crushed rock to the beneficiation plant, and v) beneficiation of the iron ore. The National Iron Ore Mining Project (NIOMP) was established to exploit the Itakpe iron ore deposit. The corporate objec- tives of NIOMP are listed as follows 7: i) to produce and supply 100% of the iron ore requirements of the Ajaokuta Steel Company Limited (ASCL) amounting to 2.15 × 10⁶ tons per year assaying 63% Fe ii) to produce and supply 40% of the iron ore requirements of the Delta Steel Company, Aladja (Warri) (DSC) amounting to 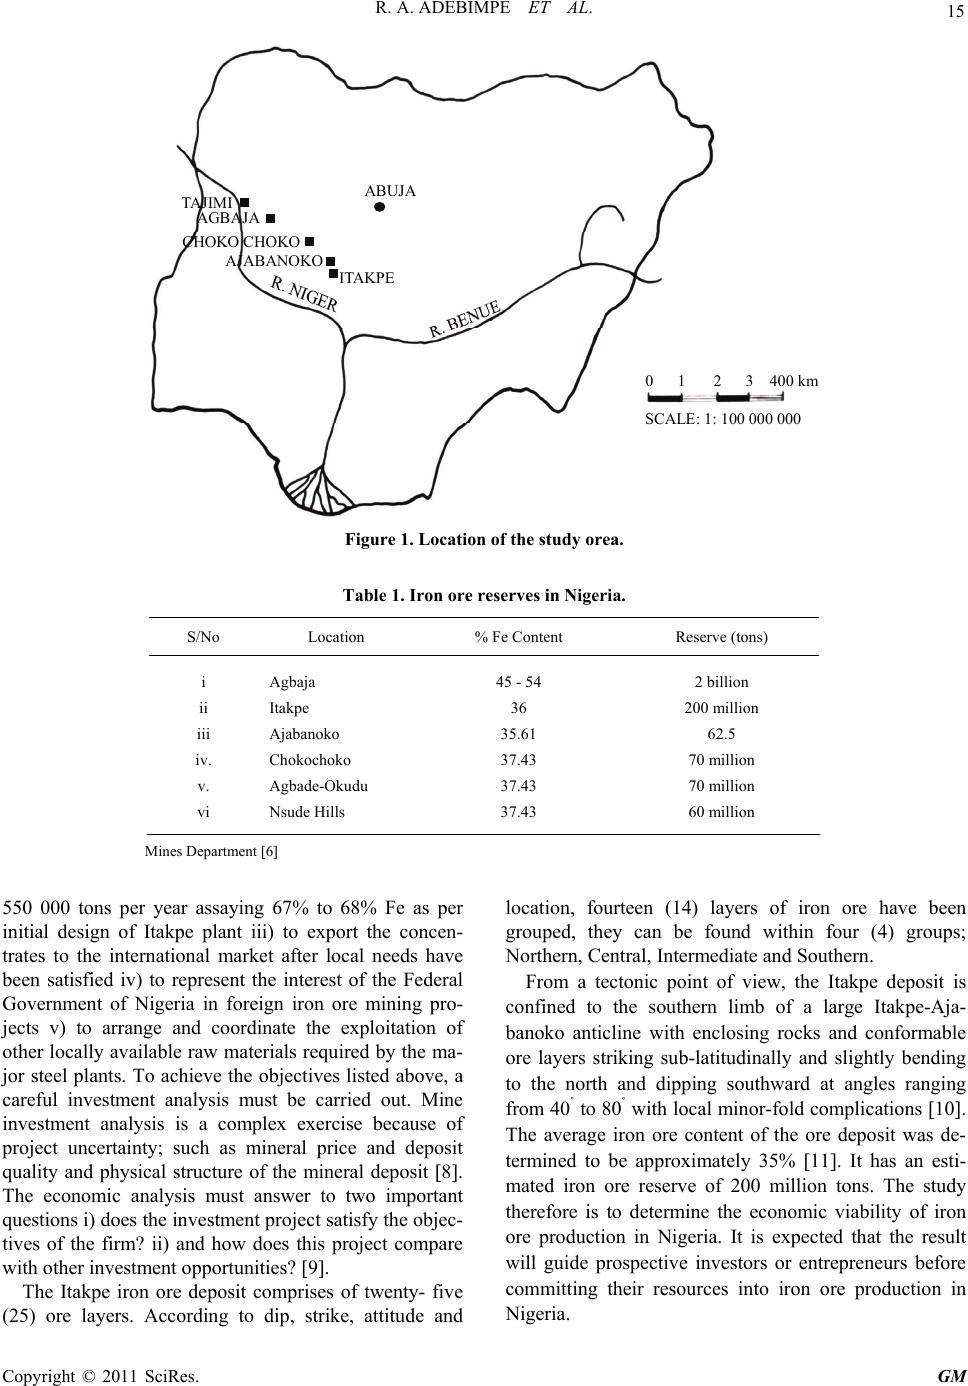 R. A. ADEBIMPE ET AL. Copyright © 2011 SciRes. GM 15 0 1 2 3 400 km SCALE: 1: 100 000 000 ABUJA ITAKPE AJABANOKO CHOKO CHOKO AGBAJA TAJIMI Figure 1. Location of the study orea. Table 1. Iron ore reserves in Nigeria. S/No Location % Fe Content Reserve (tons) i ii iii iv. v. vi Agbaja Itakpe Ajabanoko Chokochoko Agbade-Okudu Nsude Hills 45 - 54 36 35.61 37.43 37.43 37.43 2 billion 200 million 62.5 70 million 70 million 60 million Mines Department 6 550 000 tons per year assaying 67% to 68% Fe as per initial design of Itakpe plant iii) to export the concen- trates to the international market after local needs have been satisfied iv) to represent the interest of the Federal Government of Nigeria in foreign iron ore mining pro- jects v) to arrange and coordinate the exploitation of other locally available raw materials required by the ma- jor steel plants. To achieve the objectives listed above, a careful investment analysis must be carried out. Mine investment analysis is a complex exercise because of project uncertainty; such as mineral price and deposit quality and physical structure of the mineral deposit 8. The economic analysis must answer to two important questions i) does the investment project satisfy the objec- tives of the firm? ii) and how does this project compare with other investment opportunities? 9. The Itakpe iron ore deposit comprises of twenty- five (25) ore layers. According to dip, strike, attitude and location, fourteen (14) layers of iron ore have been grouped, they can be found within four (4) groups; Northern, Central, Intermediate and Southern. From a tectonic point of view, the Itakpe deposit is confined to the southern limb of a large Itakpe-Aja- banoko anticline with enclosing rocks and conformable ore layers striking sub-latitudinally and slightly bending to the north and dipping southward at angles ranging from 40˚ to 80˚ with local minor-fold complications 10. The average iron ore content of the ore deposit was de- termined to be approximately 35% 11. It has an esti- mated iron ore reserve of 200 million tons. The study therefore is to determine the economic viability of iron ore production in Nigeria. It is expected that the result will guide prospective investors or entrepreneurs before committing their resources into iron ore production in Nigeria.  16 R. A. ADEBIMPE ET AL. 2. Methodology 2.1. Engineering Economy Studies The purpose of engineering economic studies is to estab- lish whether a technically feasible project is also eco- nomically viable 12,13. 2.2. Data Collection The study assessed a large scale iron ore production from Itakpe iron ore deposit. The annual run-of-mine produc- tion per year is 7.374 million tons while the annual pro- duction at the beneficiation plant is 2.7 million tons (Ta- ble 2). Facilities for the project were identified and their cost estimates were obtained from equipment fabricators and suppliers. The operating (equipment running, drilling. blasting, loading, haulage, maintenance costs, office overheads and other administrative charges) were esti- mated and categorized as production and overhead cost. The gradient series model was used to estimate the annual operating cost over the economic life cycle (n) of the iron ore mine. In the model, the annual operating cost of the project was assumed to be A1 in the first year and G more naira for each additional year until the end of the twenty-seventh year for Itakpe iron ore mine. The Pre- sent Worth-Cost (PW-C) of annual operating expenses was first estimated and there-after converted to Annual Worth-Cost (AW-C) using the expression, after DeGarmo et al., (1979). 1 -,,PWCAPAinGP Gi n ,, (1) -,, A WCPWCxAPin (2) Where: i is the Minimum Attractive Rate of Return (MARR), and the factors (P/A, i, n), the uniform series present worth factor, (P/G, i, n), the gradient worth con- version factor, and (A/P, i, n), the capital recovery factor were obtained from the interest table. A1 and G were es- timated by the author as US$ 48.128 million and US$ 16.043 million respectively, for the Itakpe iron ore mine operating at full capacity. The MARR, i, of 9.44% as calculated below was used in the analysis. It was ad- justed for inflation using Equation 3: 100100100 100iPa (3) where the average marketrate ofinterest24%P [14] rate ofinflation13.3%a [15] 10024100 13.31001009.44%i The number of employees required for the project at various capacity utilization was estimated and their wages also estimated on the basis of experience, qualifi- cation and situation at the Nigerian labour market. All estimates were made in dollars. The economic output expected from the project is the sales of 64% Fe at the international market price of US$100/ton. This and the salvage value at the end of the project life cycle, put at 27 years for Itakpe iron ore mine. The financial estimate of the output was based on the prevailing market price, exclusive of VAT. 2.3. Approach to Data Analysis 2.3.1. Net Present Value (NPV) The model was used to determine the profitability of the project before tax 12. The NPV model refers to the equivalent of a single sum of money to be received or disbursed at t = 0, if all future receipts and expenses over time are discounted to the present time. The model is specified as 00 1, nn t tt tt NPVAiAPFi n , (4) where At is the net cash flow in the year (t), i is the cut-off discount rate while n is the economic life cycle, and the factor (P/F,i,n), the single payment per cent worth, is also obtained from the interest table. If NPV is positive, then the project can be accepted. Table 2. Open pit technical parameters. Parameter Itakpe iron ore mine i. Pit length ii. Pit depth iii. Ore reserve iv. Life span v. Annual rom production vi. Annual waste production vii. Waste to ore ratio viii. Daily ore production ix. Daily waste production x. Average ore grade xi. Minimum width of pit bottom xii. Ultimate pit slope 4 km 250 m 200 million tons 27 years 7.373 million tons 29.492 million tons 4:1 30 721.44 122 885.76 36% 50 m 72˚ Copyright © 2011 SciRes. GM  R. A. ADEBIMPE ET AL. Copyright © 2011 SciRes. GM 17 2.3.2. Internal Rate of Return (IRR) The IRR solves for the interest rate that equates the equivalent of cash inflow to the equivalent worth of cash outflow 13. Using the present worth model after 16, the IRR is the discount rate, irr that makes the NPV equal to zero. Its calculation formula is: 1, nn t tt to to AirrAP Firrn ,0 (5) The IRR criterion reflects the profitability of the pro- ject 16. The project is acceptable when the irr ≥ i, the MARR, otherwise not accepted 12,13,16. 2.3.3. The Discounted Payback Period (Pt) This model determines the period of time, starting from the first day of the investment period, required to fully recover the investment and operation cost 16. And such determination, to be meaningful, must be made on an after-tax basis, sometimes with the project salvage value ignored 12. The model is specified in present worth as16: t 11 1 t PP t bcbc t tt CC iCCPFiP ,,0 make profit at 60, 75 and 100% capacity utilization. (6) where, Cb is the cash benefit of the investment, Cc is the cash cost of the investment. Payback as a decision tool is used to measure how risky a project is 12. In evaluating the payback period, a 30% corporate tax on gross earnings has being used; with the project salvage value ignored. The iron ore pro- ject is acceptable if the maximum acceptable payback period, Pt(max) > Pt otherwise not. In this study Pt(max) has being set equal to the life-cycle of the project . 2.4. Mine Economic Investment Model The following mine economic investment model has been used in the estimation of the various costs associ- ated with exploitation of the iron ore 17-19. Equipment cost ($m) = 6000 (tons of deposit and waste mined daily)0.7 + 5000 (tons of deposit and waste mined daily)0.5 (7) Maintenance cost ($m) = $ 150000 (tons of deposit and waste mined daily)0.3 (8) Labour cost = $ 58.563 (tons of deposit and waste mined daily)–0.5 + $ 3.591 (tons of deposit and waste mined daily)–0.3 (9) Supplies cost ($) = $ 13.40 (tons of deposit and waste mined daily)–0.5 + $ 1.24 (tons of deposit and waste mined daily)–03 + $ 0.90 (tons of deposit and waste mined daily)–0.2 (10) Daily crushing cost = $ 7.90 × T0.6 (11) Daily grinding cost = $ 4.90 × T0.8 (12) Daily processing cost = $ 54 × T0.6 (13) Daily tailing cost = $ 0.92 × T0.8 (14) Electrical power cost = $ 145 × T0.56 (15) Drilling cost per ton = $ 1.90 (16) 0.3 p T Blasting cost per ton = $ 3.17 (17) 0.3 p T Loading cost per ton = $ 2.67 (18) 0.3 p T Haulage cost per ton = $ 18.07 (19) 0.3 p T 2.5. Personnel Calculation Number of open pit personnel (Nop) = 0.034 × Tp (20) Number of mill personnel (Nmp) = 7.2 × T0.3 (21) Number of service personnel (Nsv) = 0.254 × (Nop + Nml) (22) Number of administrative and technical personnel, Nat = 0.11 (Nop + Nml + Nsv) (23) 3. Results and Discussion Table 3 presents the list of facilities and civil structures required for the iron ore project at a large-scale level. The project is estimated to have a production capacity of 7 373 145.6 tons per annum working 6 days per week running three shifts per day. The initial investment (or first cost), US $ 73.934 m is made up of pre-production expenses, which include site allocation (including mining lease), prospecting activities and capital investment in- cluding installation expenses (Table 4).The annual oper- ating cost includes cost of labour, maintenance, field consumables, raw materials and equipment running cost, estimated at US$ 48.128 m for the first year at 100% capacity utilization (Table 4). The iron ore mining pro- ject will require 314 number of staff; this include 132 open pit personne l,94 mill personne l,57 service per- sonnel and 31 administrative and technical staff. Their wages in the first year will amount to $ 1.641 m while ore processing costs were estimated at US$ 7.821 m.The NPV of the iron ore project at 100% production capacity is US$ 833.10 million which is greater than zero. The profitability analysis as seen from Table 3 shows a posi- tive NPV before tax when the mine is operated and will  R. A. ADEBIMPE ET AL. 18 the pr .1. Sensitivity Analysis of Factors Affecting the ensitivity analysis was carried out on the iron ore pro- ructures (Itakpe iron ore mine). S/No Equipment desc$m) Total cost(US$m) The project IRR is 444.36%, which is greater than esent cut-off discount rate of 09.4%. This indicates that the project is worthy of investment and has the ability to make profit. The payback period before tax is 6 years, which shows that the project has a good feature of not being a risk as first and operating costs of the project can be recovered under a short duration of 6 years when compared with the economic life cycle of the project of 27 years (Table 5). 3 Economic Benefit of the Iron Ore Project in Nigeria S ject to determine its impact on the profitability of project. Two factors affecting the IRR at 100% capacity utiliza- tion were considered (Table 6).The two sensitivity fac- tors are initial investment and price of iron. The IRR of the project was evaluated using a 20% variation. The IRR of the project will decrease from 444.36% to 424.42% if the initial investment cost is increased by 20% and will increase to 456.80% if the initial investment cost de- crease by 20%. Also the IRR of the project will increase to 469.60% if the revenue from sales of iron ore is in- creased by 20% while it will decrease to 331.13% if the revenue from sales of iron ore decrease by 20% With the IRR of varied factors greater than 9.44%, the MARR, this shows that the two factors if varied in cost by 20% will affect the IRR and or the profitability of the project significantly. Hence the order of sensitivity factors af- fecting the economic benefit of the project is: the price of iron ore, followed by the initial investment cost. The result of this sensitivity analysis shows that a decrease in costs and an increase in price of iron ore increase the project’s profitability, while an increase in costs and a decrease in price of iron ore decrease the profitability of the project. Table 3. Facilities and civil st ription Capacity Quantity Unit price(US 1 Dump truck 100 tons 20 0.78 15.6 2 Wheel Loader M3 2 drill rig 5000 gallon n r 0 lant 8 T 7 8 m3 3 6 0.973 5.84 3 Excavator 5.6 m 3 0.42 1.26 4 Bulldozer ax 15 m0.46 0.92 5 Scraper ic 15 /h 2 0.1 0.2 0.6 Pneumatm8 0.1 80 7 Rotary drill rig 3 h 2 0.86 1.72 8 Jack Hammer m/8 0.003 0.027 9 Compressor 8 bar 4 0.047 0.187 10 Water tanker2 0.047 0.094 11 Admin. Car 6 0.04 0.24 12 Workshop va 6 0.033 0.2 13 Gyratory crushe 1 0.689 .689 14 Primary crushing p 1 20.76 20.76 15 Process capital cost road 1 21.21 21.21 16 Construction access km0.163 1.304 17 Staff buses ing and offices 4 0.08 0.32 18 Factory hous 1 0.133 0.133 19 Incidental 1.77 otal 3.274 Table 4. Cashflow (US $m) for Itakpe iron ore project. Cost factor Capacity C Capacity A Capacity B Initial investmvestment ent Capital in 73.274 73.274 73.274 Pre-production expenses 0.66 7 0.66 7 0.66 7 Sub total eration expenses Pr 3.934 3.934 3.934 Annual Opoduction costs 1.168 1.460 1.947 ts ost ech. staff e 471. Drilling costs Blasting cost 1.949 2.437 3.249 Loading cos1.642 2.052 2.737 Haulage costs c 11.11 13.891 18.521 General service4.089 5.112 6.816 Maintenance cost t 3.238 4.047 5.396 Ore processing cos4.693 5.866 7.821 Salary of admi. and t0.985 1.231 1.641 Sub total venue Sales of iron or 28.874 36.096 48.128 Annual Re162 202.5 270 Savage value NPV 15.12 33 606. 10.8 76 833. 8.64 10 Copyright © 2011 SciRes. GM  R. A. ADEBIMPE ET AL. 19 Table 5. Result of other ecc assessment of the I iron ore mine. Profi essment onomi takpe tability index at i = 9.44%, n = 27 years Economic ass Internal rate of return IRR(%) 444.36 Payback period (Years) 6 Table 6. Result of sensitivity analysis of Itakpe iron ore mine. Factor Varied rate of IRR(%) IRR(%)Original state Variation incr% ease by 20424.42 Initial int cost nvestme444.36 decrease by 20% 456.80 increase by 20% 469.60 Revenue from iron ore 440.36 decrease by 20% 331.13 From the results of this micro-economic analysis, in- e ulate Growth in he as wo firmed that the production of iron ore and R. Moles, “Investment decisions of international mining firms: Policy approaches,” Sim tion. Vol. 78, No. 6, 2002, pp. 362-379. . 243. a, United States, ncentrate,” Maejo International vstment in this large-scale iron ore project in Nigeria becomes infeasible in financial terms of IRRfinance < 09.44%, the MARR of the project. .2. Government Policy to Stim3 the Solid Mineral Sector of Nigeria ministry of mines and steel development hT a rked [4] K. Dagdelen, “Open pit optimisation –Strategies for im- proving economics of mining projects through mine planning,” .17th International Mining Congress and Exhi- bition of Turkey- IMCET 2001.Turkey. pp. 117. package of incentives for potential investors in the solid mineral sector and is embedded in the Mineral Act, 2007 20 .Some of these include: i) Exemption from payment of customs and import duty in respect of plant , machinery, equipment and accessories imported specifi- cally and exclusively for mining operation ii) expatriate quota and resident permit in respect of the approved ex- patriate personnel iii) personnel remittance quota for expatriate for personnel, free from any tax imposed by any enactment for the transfer of external currency out of Nigeria iv) the Act provides a tax relief period of 3 years for any company granted a Mineral Title under the Act and can be extended for a further period of 2 years v) Section 30 of the Act provide for deductibility of envi- ronmental cost. . Conclusion4 he study has conT in Nigeria is economically viable. With the introduction of non-renewable period of a 5-year tax holiday on cor- porate income in Nigeria, the micro-economic profitabil- ity of the project is expected to increase, therefore mak- ing investment in the iron ore enterprise more worth- while for investors. . References 5 1] B. O’Reagan,[ ula- [2] S. Iloiu, and M Iloiu, “Ore reserve estimation and project profitability,” Annals of the University of Petrosani, Me- chanical Engineering, Vol. 10, 2008, pp. 85-88. [3] E. V Domingo, and E. E. P Lopez-Dee, “Valuation meth- ods of mineral resources,” 11th Meeting of the London Group, Pretoria, South Africa, 26-30th March, 2007. pp. 7. [5] S. Rupprecht, “Establishing the feasibility of your pro- posed mining venture,” International Platinum Confer- ence ‘Platinum adding value’. The South African Institute of Mining and Metallurgy, South Africa, 2004, pp [6] Mines Department,“Inventory of Nigerian minerals, mines and miners,”Federal Ministry of Petroleum and Mineral Resources. Lagos, 1993, pp. 1-10. [7] U. Turaki, “Management of the mineral sector in a de- pressed economy,” NIOMP experience. Nigerian Mining Journal. Vol. 2, No. 1, 1997, pp. 12-19. [8] M. Samis, “Valuing a multi-zone as a real asset portfo- lio-A modern asset pricing(real options) approach,” 5th Annual International Conference on real options-theory meets practice. Los Angeles, Californi 13-14th July, 2001. pp. 1. [9] D.,Csiminga, and M. Iloiu, “Economic analysis of mining projects,” .Annals of the Oradea University. Fascille of Management and Technological Engineering, Volume VI(XVI), 2007. pp. 2094. [10] A. O, Solomon, O. A Adewole, A. U, Garba, A. A Odunaike, S. M, Kollere, and P. O Ajiboye, “Study on magnetic concentration of Nigerian Itakpe sinter concen- trate to a Midrex-grade co Journal of Science and Technology. Vol. 3 No. 03, 2009, pp. 400-407. [11] P. U Umunakwe, “Developing a new mine-The Itakpe case,” Proceedings of the annual conference of Nigeria mining and geosciences society, Jos, 1985, pp. [12] E. P. DeGarmo, J. R. Canada, and W. G. Sullivan, “En- gineering economy,” 6th edition. Macmillan, New York. Copyright © 2011 SciRes. GM  R. A. ADEBIMPE ET AL. 20 gineering 1979. [13] M. O Ilori, I. A. Irefin, and A. A Adeniyi,. “En economy studies on the production of non-alcoholic bev- erages from some tropical crops,” Technovation. Vol. 17, No. 11/12, 1997, pp. 715-721. nomic evaluation of a fam- [14] T. “Agboola, Naccima decries high interest rate,”The Nation(02/04/2009). Lagos. [15] O. Chiama, “Inflation slows further to 13.3%,”The Na- tion.(20/05/2009) Lagos. [16] O Adeoti,., M. O., Ilori, T. O Oyebisi,. and L. O Adekoya, “Engineering design and eco ily-sized biogas project in Nigeria,” Technovation, Vol. 20, 2000, pp.103. [17] T. A. O’ Hara, “Quick guide, to the evaluation of ore bodies,” CIM Bull etin (no 814) 73 (2), 1980, pp. 87-89. : ylor and Francis London, 2006, ederal Republic of Nigeria., 2007, A479- [18] T. A. O’ Hara, and S.C. Suboleski, “Chapter 6:3: costs and cost estimation,” In: H.L Hartman, (Senior Editor) SME mining Engineering Handbook 2nd Edition (Vol. 1 ), SME, 1992, pp. 405-424. [19] W. Hustrulid, and M. Kuchta, “Open pit mine planning and design,”2nd Edition. Ta pp. 137-152. [20] Federal Republic of Nigeria, “Nigerian minerals and mining act,” F A538. Copyright © 2011 SciRes. GM |