Paper Menu >>
Journal Menu >>
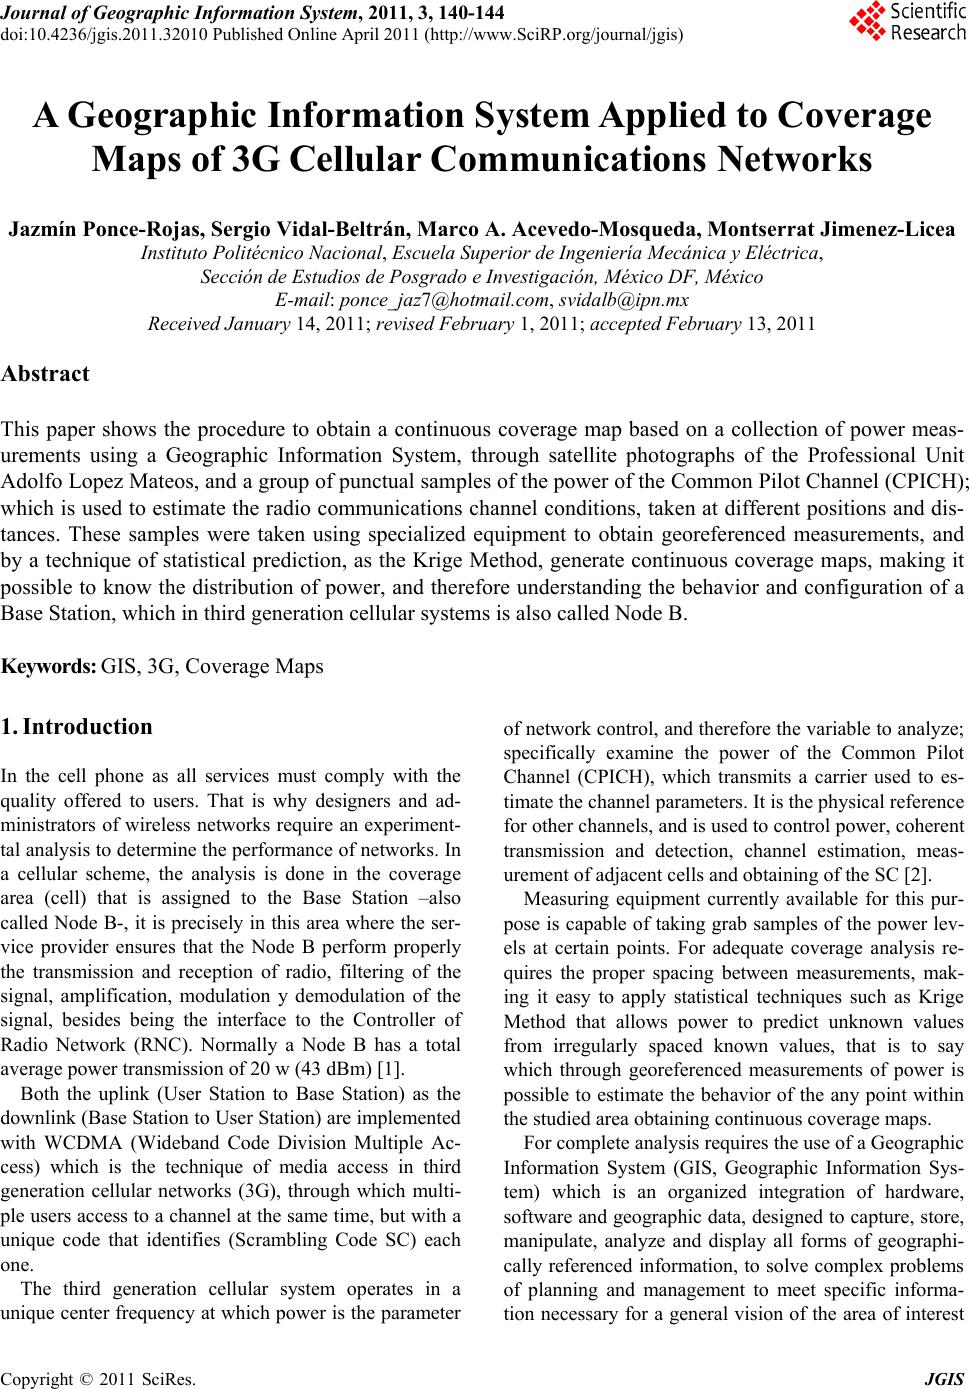 Journal of Geographic Information System, 2011, 3, 140-144 doi:10.4236/jgis.2011.32010 Published Online April 2011 (http://www.SciRP.org/journal/jgis) Copyright © 2011 SciRes. JGIS A Geographic Information System Applied to Coverage Maps of 3G Cellular Communications Networks Jazmín Ponce-Rojas, Sergio Vidal-Beltrán, Marco A. Acevedo-Mosqueda, Montserrat Jimenez-Licea Instituto Politécnico Nacional, Escuela Superior de Ingeniería Mecánica y Eléctrica, Sección de Estudios de Posgrado e Investigación, México DF, México E-mail: ponce_jaz7@hotmail.com, svidalb@ipn.mx Received January 14, 2011; revised February 1, 2011; accepted February 13, 201 1 Abstract This paper shows the procedure to obtain a continuous coverage map based on a collection of power meas- urements using a Geographic Information System, through satellite photographs of the Professional Unit Adolfo Lopez Mateos, and a group of punctual samples of the power of the Common Pilot Channel (CPICH); which is used to estimate the radio communications channel conditions, taken at different positions and dis- tances. These samples were taken using specialized equipment to obtain georeferenced measurements, and by a technique of statistical prediction, as the Krige Method, generate continuous coverage maps, making it possible to know the distribution of power, and therefore understanding the behavior and configuration of a Base Station, which in third generation cellular systems is also called Node B. Keywords: GIS, 3G, Coverage Maps 1. Introduction In the cell phone as all services must comply with the quality offered to users. That is why designers and ad- ministrators of wireless networks require an experiment- tal analysis to determine the performance of networks. In a cellular scheme, the analysis is done in the coverage area (cell) that is assigned to the Base Station –also called Node B-, it is precisely in this area where the ser- vice provider ensures that the Node B perform properly the transmission and reception of radio, filtering of the signal, amplification, modulation y demodulation of the signal, besides being the interface to the Controller of Radio Network (RNC). Normally a Node B has a total average powe r t ran smission of 20 w (43 dBm) [1]. Both the uplink (User Station to Base Station) as the downlink (Base Station to User Station) are implemented with WCDMA (Wideband Code Division Multiple Ac- cess) which is the technique of media access in third generation cellular networks (3G), through which multi- ple users access to a channel at the same time, but with a unique code that identifies (Scrambling Code SC) each one. The third generation cellular system operates in a unique center frequency at which power is the parameter of network control, and therefore the variable to analyze; specifically examine the power of the Common Pilot Channel (CPICH), which transmits a carrier used to es- timate the channel parameters. It is the physical reference for other channels, and is used to control power, coherent transmission and detection, channel estimation, meas- urement of adjacent cells and obtaining of the SC [2]. Measuring equipment currently available for this pur- pose is capable of taking grab samples of the power lev- els at certain points. For adequate coverage analysis re- quires the proper spacing between measurements, mak- ing it easy to apply statistical techniques such as Krige Method that allows power to predict unknown values from irregularly spaced known values, that is to say which through georeferenced measurements of power is possible to estimate the behavior of the any point within the studied area obtaining continuous coverage maps. For complete analysis requires the use of a Geographic Information System (GIS, Geographic Information Sys- tem) which is an organized integration of hardware, software and geographic data, designed to capture, store, manipulate, analyze and display all forms of geographi- cally referenced information, to solve complex problems of planning and management to meet specific informa- tion necessary for a general vision of the area of interest 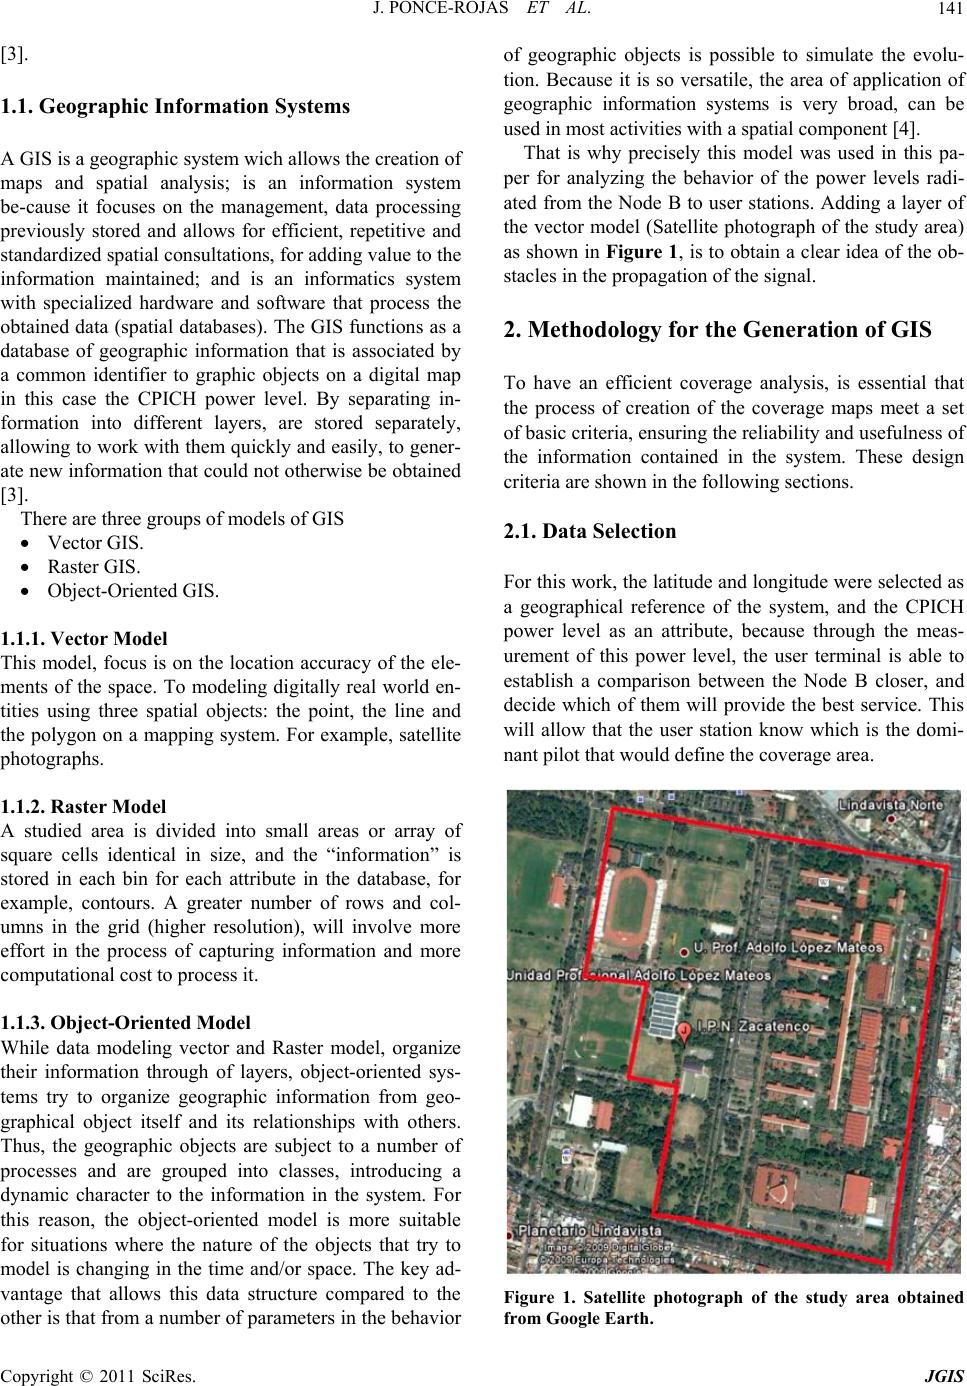 J. PONCE-ROJAS ET AL.141 [3]. 1.1. Geographic Information Systems A GIS is a geographic system wich allows the creation of maps and spatial analysis; is an information system be-cause it focuses on the management, data processing previously stored and allows for efficient, repetitive and standardized spatial consultations, for adding value to the information maintained; and is an informatics system with specialized hardware and software that process the obtained data (spatial databases). The GIS functions as a database of geographic information that is associated by a common identifier to graphic objects on a digital map in this case the CPICH power level. By separating in- formation into different layers, are stored separately, allowing to work with them quickly and easily, to gener- ate new information that could not otherwise be obtained [3]. There are three groups of models of GIS Vector GIS. Raster GIS. Object-Oriented GIS. 1.1.1. Vec tor Model This model, focus is on the location accuracy of the ele- ments of the space. To modeling digitally real world en- tities using three spatial objects: the point, the line and the polygon on a mapping system. For example, satellite photographs. 1.1.2. Raster Model A studied area is divided into small areas or array of square cells identical in size, and the “information” is stored in each bin for each attribute in the database, for example, contours. A greater number of rows and col- umns in the grid (higher resolution), will involve more effort in the process of capturing information and more computational cost to process it. 1.1.3. Ob jec t -Oriented Mod el While data modeling vector and Raster model, organize their information through of layers, object-oriented sys- tems try to organize geographic information from geo- graphical object itself and its relationships with others. Thus, the geographic objects are subject to a number of processes and are grouped into classes, introducing a dynamic character to the information in the system. For this reason, the object-oriented model is more suitable for situations where the nature of the objects that try to model is changing in the time and/or space. The key ad- vantage that allows this data structure compared to the other is that from a number of parameters in the behavior of geographic objects is possible to simulate the evolu- tion. Because it is so versatile, the area of application of geographic information systems is very broad, can be used in most activities with a spatial component [4]. That is why precisely this model was used in this pa- per for analyzing the behavior of the power levels radi- ated from the Node B to user stations. Adding a layer of the vector model (Satellite photograph of the study area) as shown in Figure 1, is to obtain a clear idea of the ob- stacles in the propagatio n of the signa l. 2. Methodology for the Generation of GIS To have an efficient coverage analysis, is essential that the process of creation of the coverage maps meet a set of basic criteria, ensuring the reliability and usefu lness of the information contained in the system. These design criteria are shown in the following sections. 2.1. Data Selection For this work, the latitud e and longitude were selected as a geographical reference of the system, and the CPICH power level as an attribute, because through the meas- urement of this power level, the user terminal is able to establish a comparison between the Node B closer, and decide which of them will provide the best service. This will allow that the user station know which is the domi- nant pilot that would define the coverage area. Figure 1. Satellite photograph of the study area obtained from Google Earth. Copyright © 2011 SciRes. JGIS 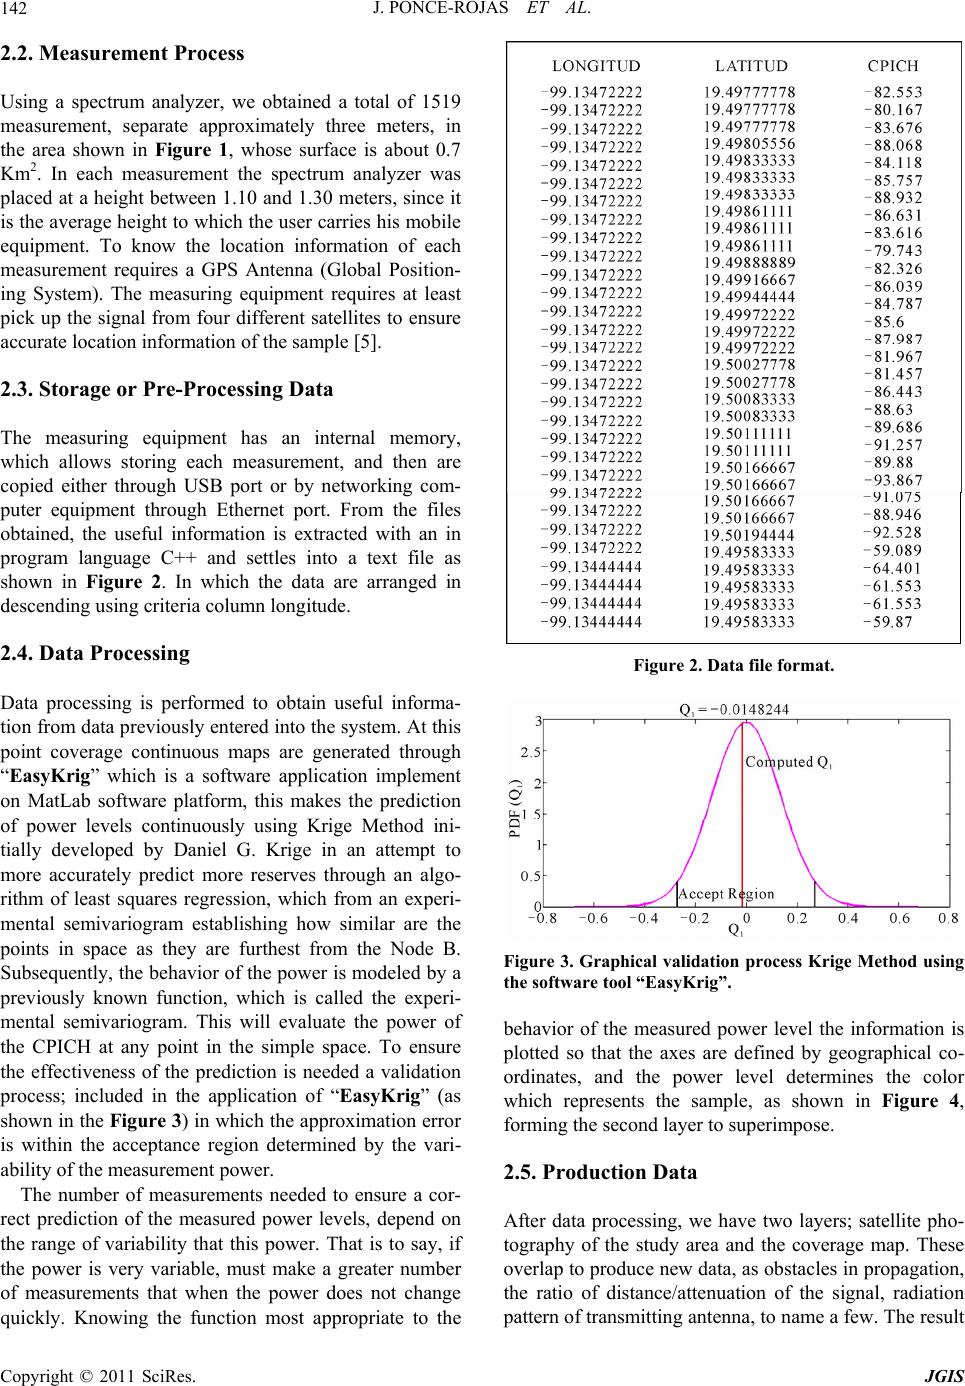 J. PONCE-ROJAS ET AL. 142 2.2. Measurement Process Using a spectrum analyzer, we obtained a total of 1519 measurement, separate approximately three meters, in the area shown in Figure 1, whose surface is about 0.7 Km2. In each measurement the spectrum analyzer was placed at a height between 1.10 and 1.30 meters, since it is the average height to which the user carries his mobile equipment. To know the location information of each measurement requires a GPS Antenna (Global Position- ing System). The measuring equipment requires at least pick up the signal from four different satellites to ensure accurate location information of the sample [5]. 2.3. Storage or Pre-Processing Data The measuring equipment has an internal memory, which allows storing each measurement, and then are copied either through USB port or by networking com- puter equipment through Ethernet port. From the files obtained, the useful information is extracted with an in program language C++ and settles into a text file as shown in Figure 2. In which the data are arranged in descending using criteria column longitude. 2.4. Data Processing Data processing is performed to obtain useful informa- tion from data previou sly entered into the syste m. At this point coverage continuous maps are generated through “EasyKrig” which is a software application implement on MatLab software platform, this makes the prediction of power levels continuously using Krige Method ini- tially developed by Daniel G. Krige in an attempt to more accurately predict more reserves through an algo- rithm of least squares regression, which from an experi- mental semivariogram establishing how similar are the points in space as they are furthest from the Node B. Subsequently, the behavior of the power is modeled by a previously known function, which is called the experi- mental semivariogram. This will evaluate the power of the CPICH at any point in the simple space. To ensure the effectiveness of the prediction is needed a validation process; included in the application of “EasyKrig” (as shown in the Figure 3) in which the approximation error is within the acceptance region determined by the vari- ability of the measurement power. The number of measurements needed to ensure a cor- rect prediction of the measured power levels, depend on the range of variability that this power. That is to say, if the power is very variable, must make a greater number of measurements that when the power does not change quickly. Knowing the function most appropriate to the Figure 2. Data file format. Figure 3. Graphical validation process Krige Method using the software tool “EasyKrig”. behavior of the measured power level the information is plotted so that the axes are defined by geographical co- ordinates, and the power level determines the color which represents the sample, as shown in Figure 4, forming the second layer to superimpose. 2.5. Production Data After data processing, we have two layers; satellite pho- tography of the study area and the coverage map. These overlap to produce new data, as obstacles in propagation, the ratio of distance/attenuation of the signal, radiation pattern of transmitting anten na, to na me a few. The result Copyright © 2011 SciRes. JGIS 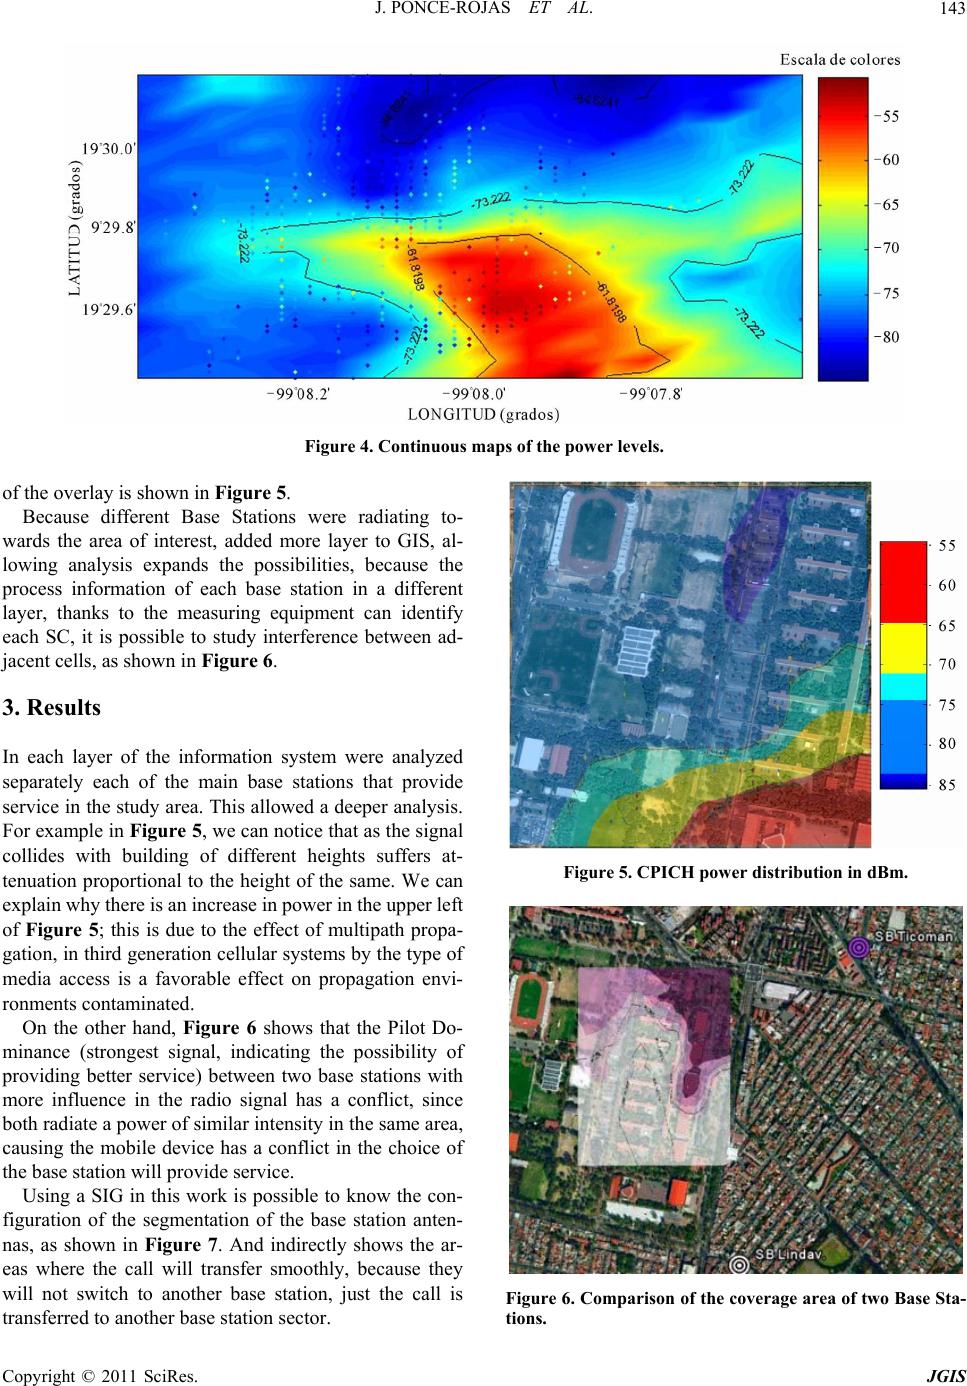 J. PONCE-ROJAS ET AL. Copyright © 2011 SciRes. JGIS 143 Figure 4. Continuous maps of the pow er le vels. of the overlay is shown in Figure 5. Because different Base Stations were radiating to- wards the area of interest, added more layer to GIS, al- lowing analysis expands the possibilities, because the process information of each base station in a different layer, thanks to the measuring equipment can identify each SC, it is possible to study interference between ad- jacent cells, as shown in Figure 6. 3. Results In each layer of the information system were analyzed separately each of the main base stations that provide service in the study area. This allowed a deeper analysis. For example in Figure 5, we can notice that as the signal collides with building of different heights suffers at- tenuation proportional to the height of the same. We can explain why there is an inc rease in power in the upper left of Figure 5; this is due to the effect of multipath propa- gation, in third generation cellular systems by the type of media access is a favorable effect on propagation envi- ronments contaminated. Figure 5. CPICH power distribution in dBm. On the other hand, Figure 6 shows that the Pilot Do- minance (strongest signal, indicating the possibility of providing better service) between two base stations with more influence in the radio signal has a conflict, since both radiate a power of similar intensity in the same area, causing the mobile device has a conflict in the choice of the base station will provide service. Using a SIG in this work is possible to know the con- figuration of the segmentation of the base station anten- nas, as shown in Figure 7. And indirectly shows the ar- eas where the call will transfer smoothly, because they will not switch to another base station, just the call is transferred to another base station sector. Figure 6. Comparison of the coverage area of two Base Sta- tions. 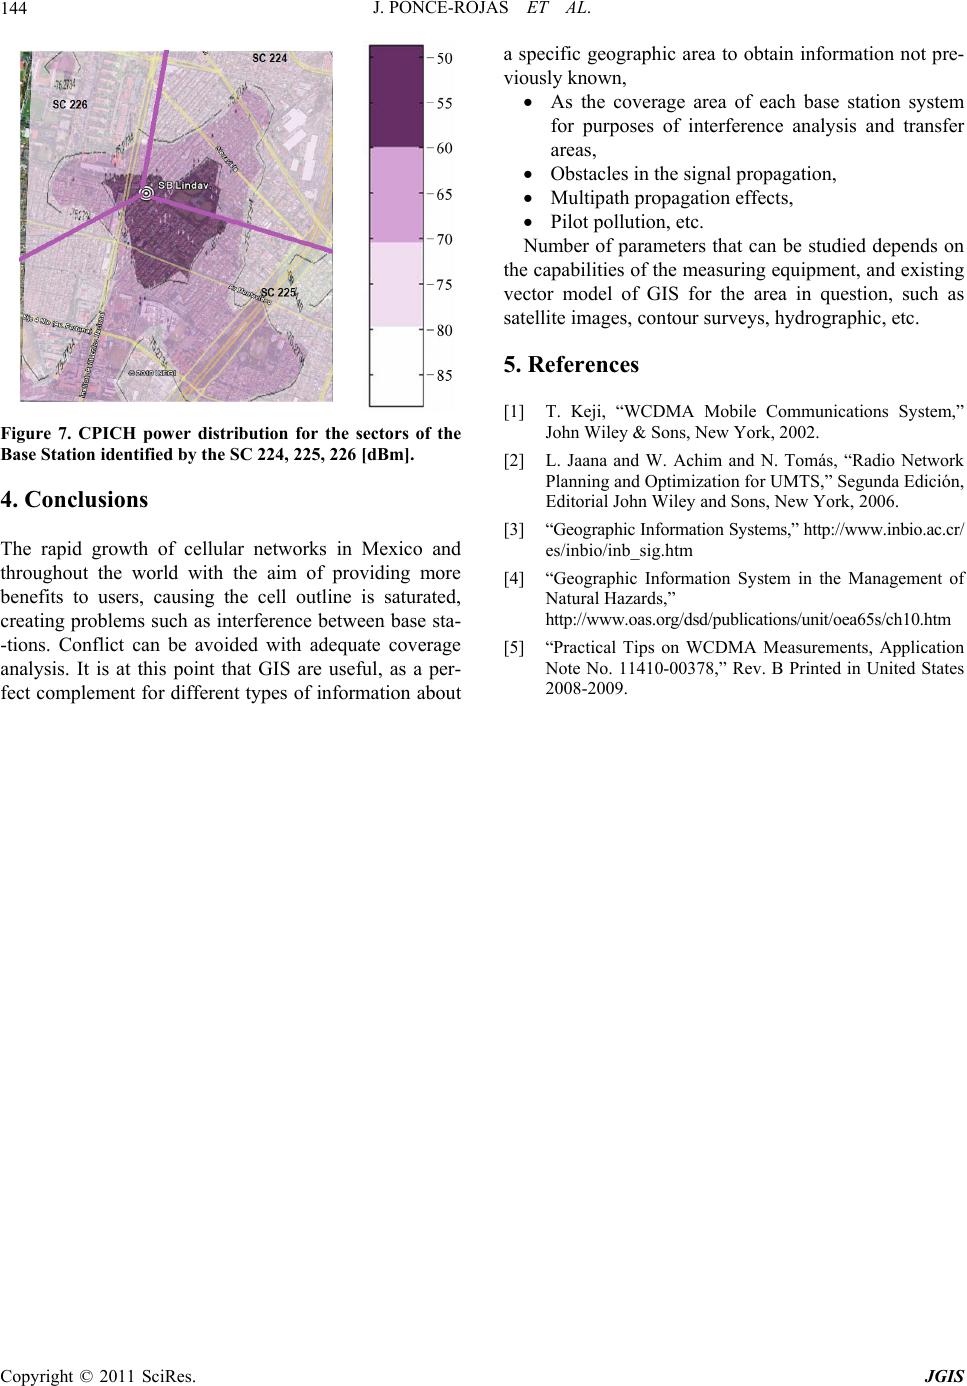 J. PONCE-ROJAS ET AL. 144 Figure 7. CPICH power distribution for the sectors of the Base Station identified by the SC 224, 225, 226 [dBm]. 4. Conclusions The rapid growth of cellular networks in Mexico and throughout the world with the aim of providing more benefits to users, causing the cell outline is saturated, creating problems such as interference between base sta- -tions. Conflict can be avoided with adequate coverage analysis. It is at this point that GIS are useful, as a per- fect complement for different types of information about a specific geographic area to obtain information not pre- viously known, As the coverage area of each base station system for purposes of interference analysis and transfer areas, Obstacles in the signal propagation, Multipath propagation effects, Pilot pollution, etc. Number of parameters that can be studied depends on the capabilities of the measurin g equipment, and existing vector model of GIS for the area in question, such as satellite images, contour surveys, hydrographic, etc. 5. References [1] T. Keji, “WCDMA Mobile Communications System,” John Wiley & Sons, New York, 2002. [2] L. Jaana and W. Achim and N. Tomás, “Radio Network Planning and Optimization for UMTS,” Segunda Edición, Editorial John Wiley and Sons, New York, 2006. [3] “Geographic Information Systems,” http://www.inbio.ac.cr/ es/inbio/inb_sig.htm [4] “Geographic Information System in the Management of Natural Hazards,” http://www.oas.org/dsd/publications/unit/oea65s/ch10.htm [5] “Practical Tips on WCDMA Measurements, Application Note No. 11410-00378,” Rev. B Printed in United States 2008-2009. Copyright © 2011 SciRes. JGIS |