Paper Menu >>
Journal Menu >>
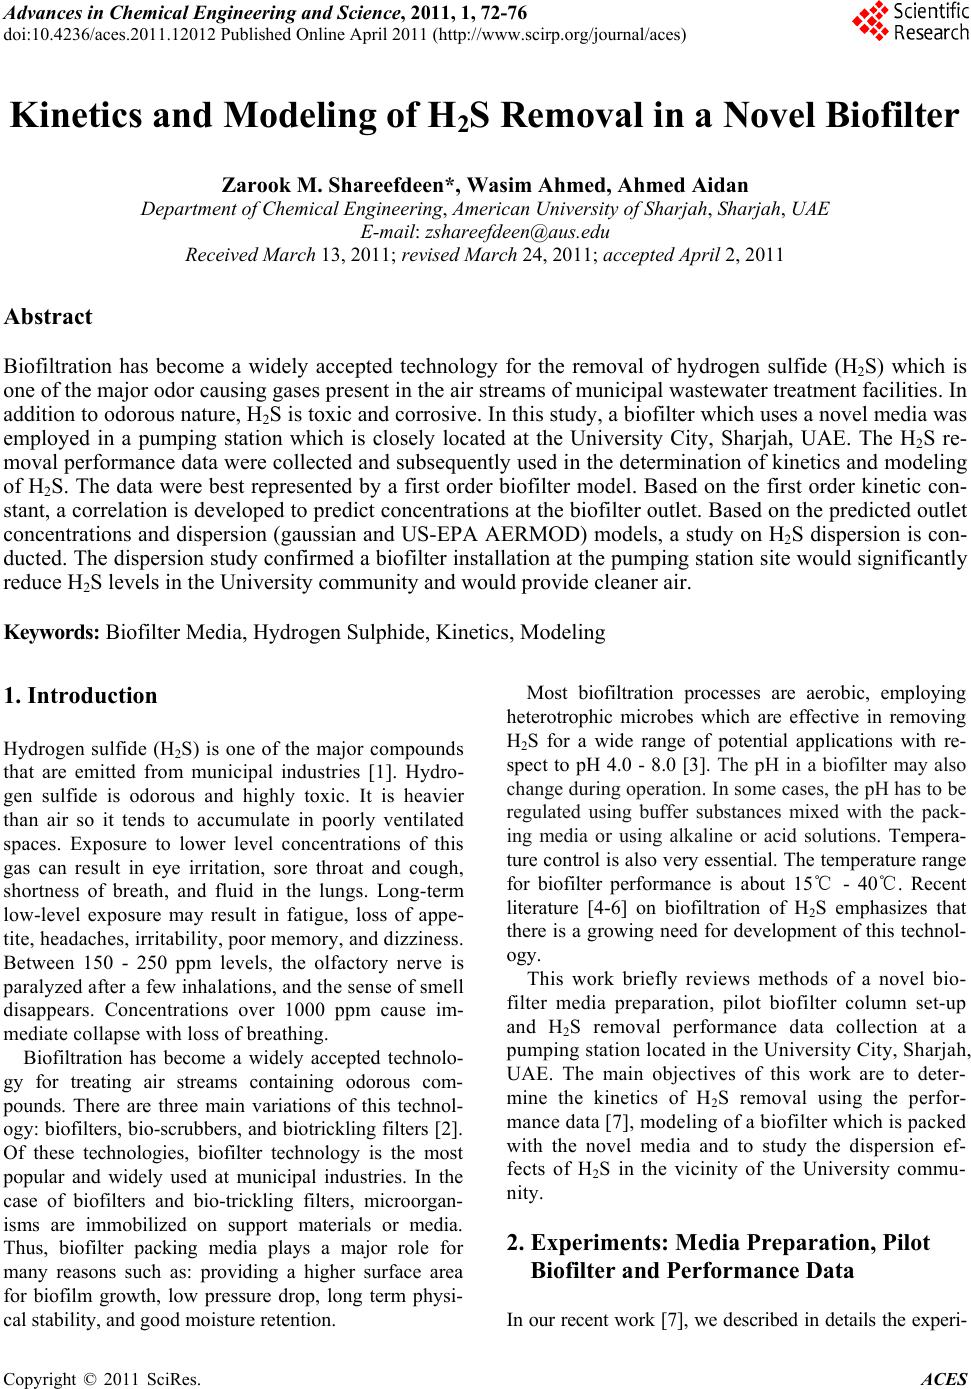 Advances in Chemical Engi neering and Science , 2011, 1, 72-76 doi:10.4236/aces.2011.12012 Published Online April 2011 (http://www.scirp.org/journal/aces) Copyright © 2011 SciRes. ACES Kinetics and Modeling of H2S Removal in a Novel Biofilter Zarook M. Shareefdeen*, Wasim Ahmed, Ahmed Aidan Department of Chemical Engineering, American University of Sharjah, Sharjah, UAE E-mail: zshareefdeen@aus.edu Received March 13, 2011; revised March 24, 2011; accepted April 2, 2011 Abstract Biofiltration has become a widely accepted technology for the removal of hydrogen sulfide (H2S) which is one of the major odor causing gases present in the air streams of municipal wastewater treatment facilities. In addition to odorous nature, H2S is toxic and corrosive. In this study, a biofilter which uses a novel media was employed in a pumping station which is closely located at the University City, Sharjah, UAE. The H2S re- moval performance data were collected and subsequently used in the determination of kinetics and modeling of H2S. The data were best represented by a first order biofilter model. Based on the first order kinetic con- stant, a correlation is developed to predict concentrations at the biofilter outlet. Based on the predicted outlet concentrations and dispersion (gaussian and US-EPA AERMOD) models, a study on H2S dispersion is con- ducted. The dispersion study confirmed a biofilter installation at the pumping station site would significantly reduce H2S levels in the University community and would provide cleaner air. Keywords: Biofilter Media, Hydrogen Sulphide, Kinetics, Modeling 1. Introduction Hydrogen sulfide (H2S) is one of the major compounds that are emitted from municipal industries [1]. Hydro- gen sulfide is odorous and highly toxic. It is heavier than air so it tends to accumulate in poorly ventilated spaces. Exposure to lower level concentrations of this gas can result in eye irritation, sore throat and cough, shortness of breath, and fluid in the lungs. Long-term low-level exposure may result in fatigue, loss of appe- tite, headaches, irritability, poor memory, and dizziness. Between 150 - 250 ppm levels, the olfactory nerve is paralyzed after a few inhalations, and the sense of smell disappears. Concentrations over 1000 ppm cause im- mediate collapse with loss of breathing. Biofiltration has become a widely accepted technolo- gy for treating air streams containing odorous com- pounds. There are three main variations of this technol- ogy: biofilters, bio-scrubbers, and biotrickling filters [2]. Of these technologies, biofilter technology is the most popular and widely used at municipal industries. In the case of biofilters and bio-trickling filters, microorgan- isms are immobilized on support materials or media. Thus, biofilter packing media plays a major role for many reasons such as: providing a higher surface area for biofilm growth, low pressure drop, long term physi- cal stability, and good moisture retention. Most biofiltration processes are aerobic, employing heterotrophic microbes which are effective in removing H2S for a wide range of potential applications with re- spect to pH 4.0 - 8.0 [3]. The pH in a biofilter may also change during operation. In some cases, the pH has to be regulated using buffer substances mixed with the pack- ing media or using alkaline or acid solutions. Tempera- ture control is also very essential. The temperature range for biofilter performance is about 15℃ - 40℃. Recent literature [4-6] on biofiltration of H2S emphasizes that there is a growing need for development of this technol- ogy. This work briefly reviews methods of a novel bio- filter media preparation, pilot biofilter column set-up and H2S removal performance data collection at a pumping station located in the University City, Sharjah, UAE. The main objectives of this work are to deter- mine the kinetics of H2S removal using the perfor- mance data [7], modeling of a biofilter which is packed with the novel media and to study the dispersion ef- fects of H2S in the vicinity of the University commu- nity. 2. Experiments: Media Preparation, Pilot Biofilter and Performance Data In our recent work [7], we described in details the experi- 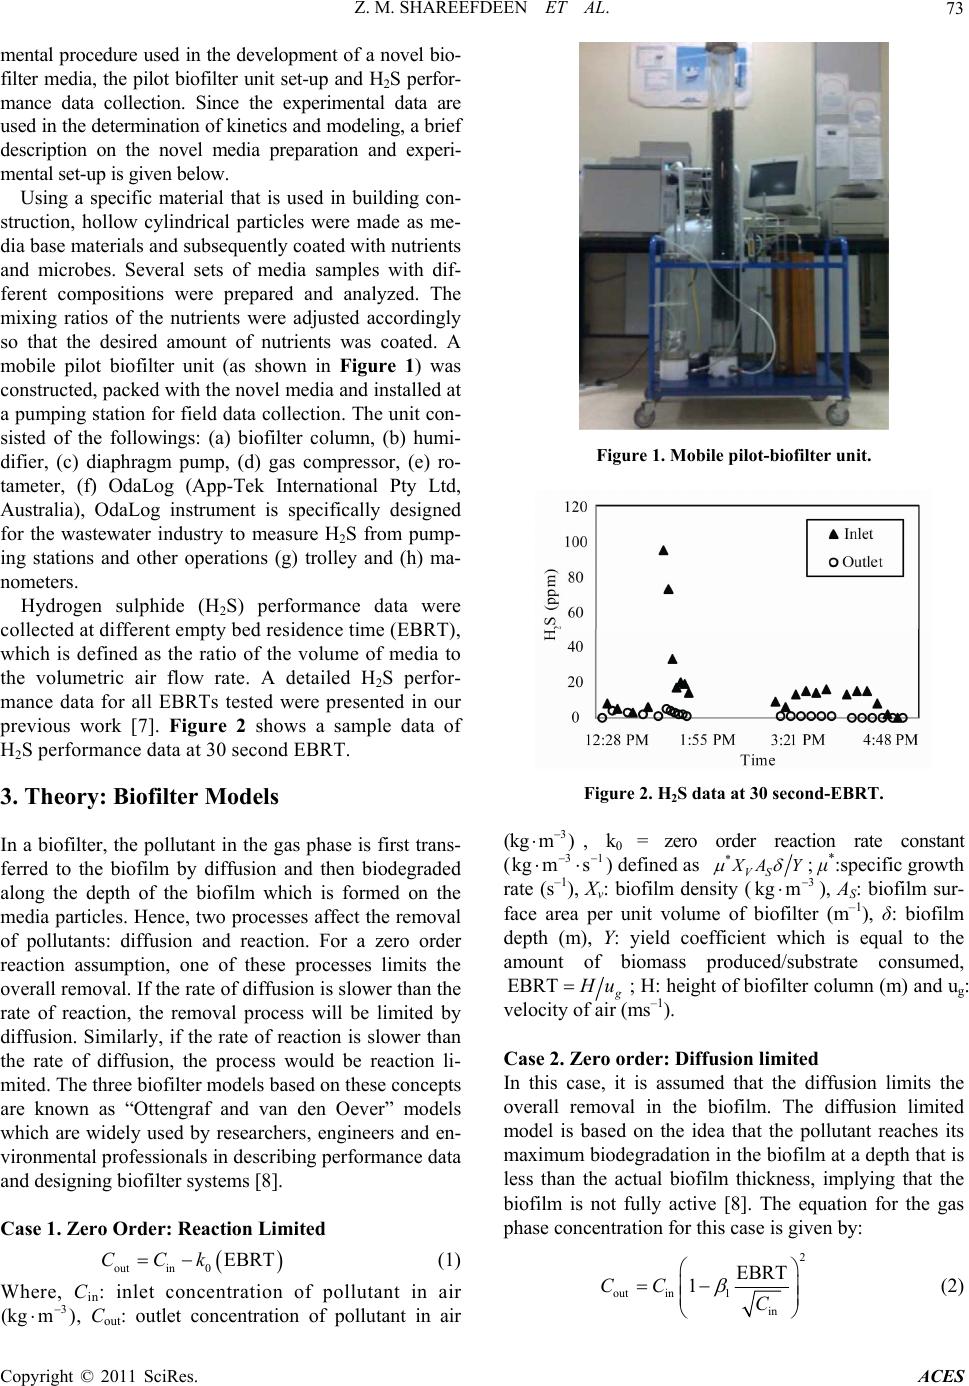 Z. M. SHAREEFDEEN ET AL. Copyright © 2011 SciRes. ACES 73 mental procedure used in the development of a novel bio- filter media, the pilot biofilter unit set-up and H2S perfor- mance data collection. Since the experimental data are used in the determination of kinetics and modeling, a brief description on the novel media preparation and experi- mental set-up is given below. Using a specific material that is used in building con- struction, hollow cylindrical particles were made as me- dia base materials and subsequently coated with nutrients and microbes. Several sets of media samples with dif- ferent compositions were prepared and analyzed. The mixing ratios of the nutrients were adjusted accordingly so that the desired amount of nutrients was coated. A mobile pilot biofilter unit (as shown in Figure 1) was constructed, packed with the novel media and installed at a pumping station for field data collection. The unit con- sisted of the followings: (a) biofilter column, (b) humi- difier, (c) diaphragm pump, (d) gas compressor, (e) ro- tameter, (f) OdaLog (App-Tek International Pty Ltd, Australia), OdaLog instrument is specifically designed for the wastewater industry to measure H2S from pump- ing stations and other operations (g) trolley and (h) ma- nometers. Hydrogen sulphide (H2S) performance data were collected at different empty bed residence time (EBRT), which is defined as the ratio of the volume of media to the volumetric air flow rate. A detailed H2S perfor- mance data for all EBRTs tested were presented in our previous work [7]. Figure 2 shows a sample data of H2S performance data at 30 second EBRT. 3. Theory: Biofilter Models In a biofilter, the pollutant in the gas phase is first trans- ferred to the biofilm by diffusion and then biodegraded along the depth of the biofilm which is formed on the media particles. Hence, two processes affect the removal of pollutants: diffusion and reaction. For a zero order reaction assumption, one of these processes limits the overall removal. If the rate of diffusion is slower than the rate of reaction, the removal process will be limited by diffusion. Similarly, if the rate of reaction is slower than the rate of diffusion, the process would be reaction li- mited. The three biofilter models based on these concepts are known as “Ottengraf and van den Oever” models which are widely used by researchers, engineers and en- vironmental professionals in describing performance data and designing biofilter systems [8]. Case 1. Zero Order: Reaction Limited outin0 EBRTCCk (1) Where, Cin: inlet concentration of pollutant in air 3 (kg m) , Cout: outlet concentration of pollutant in air Figure 1. Mobile pilot-biofilter unit. Figure 2. H2S data at 30 second-EBRT. 3 (kg m) , k0 = zero order reaction rate constant (31 kg ms ) defined as * VS X AY ; μ*:specific growth rate (s–1), Xv: biofilm density (3 kg m ), AS: biofilm sur- face area per unit volume of biofilter (m–1), δ: biofilm depth (m), Y: yield coefficient which is equal to the amount of biomass produced/substrate consumed, EBRT g H u ; H: height of biofilter column (m) and ug: velocity of air (ms–1). Case 2. Zero order: Diffusion limited In this case, it is assumed that the diffusion limits the overall removal in the biofilm. The diffusion limited model is based on the idea that the pollutant reaches its maximum biodegradation in the biofilm at a depth that is less than the actual biofilm thickness, implying that the biofilm is not fully active [8]. The equation for the gas phase concentration for this case is given by: 2 out in1 in EBRT 1CC C (2) 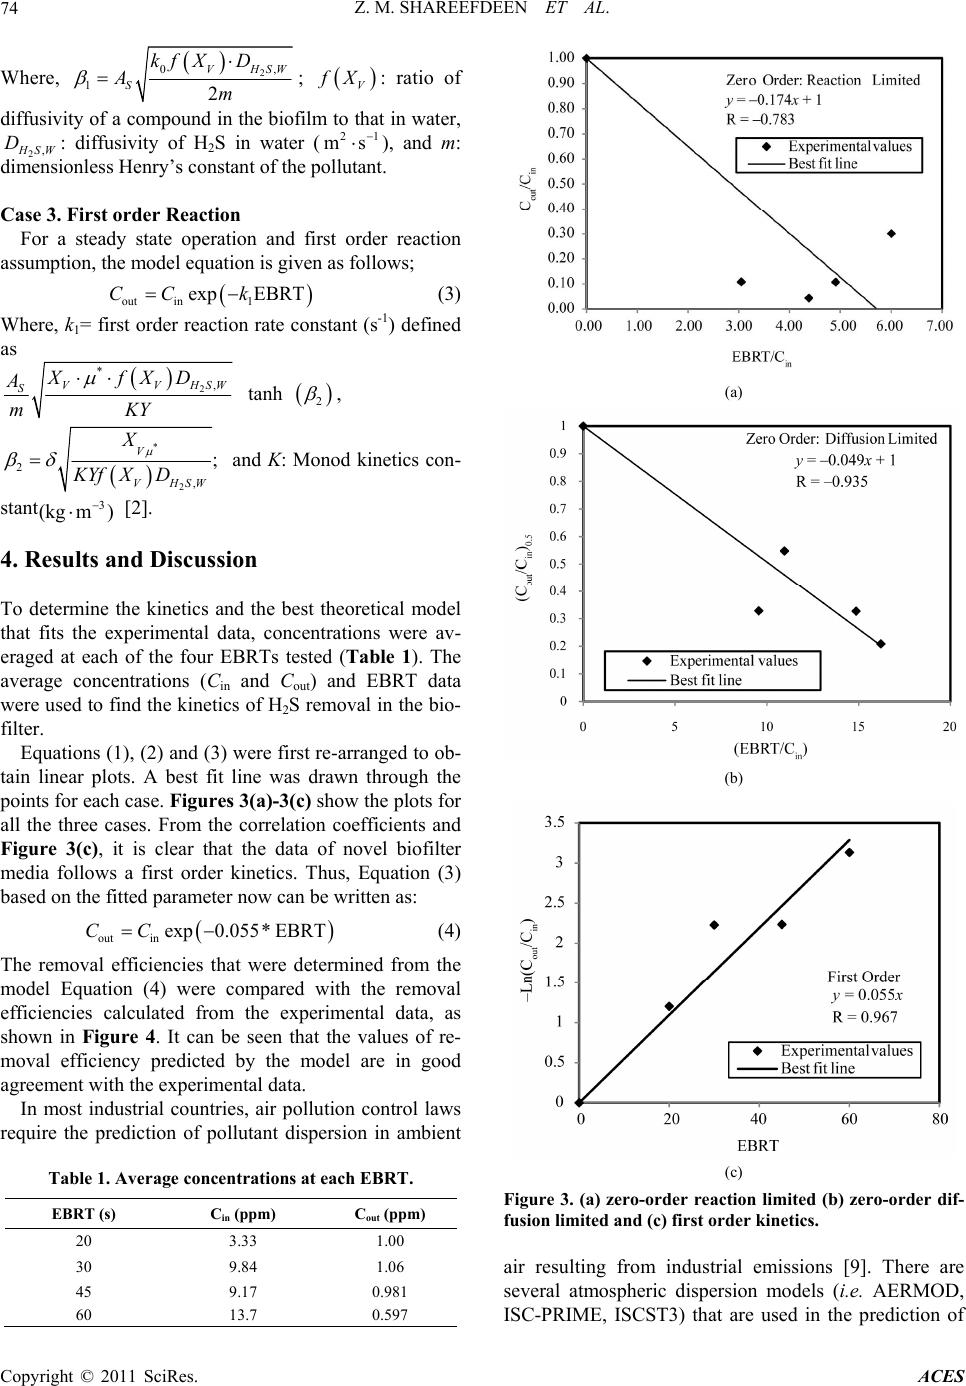 Z. M. SHAREEFDEEN ET AL. Copyright © 2011 SciRes. ACES 74 Where, 2 0, 12 VHSW S kf XD Am ; V f X: ratio of diffusivity of a compound in the biofilm to that in water, 2, H SW D: diffusivity of H2S in water (21 ms ), and m: dimensionless Henry’s constant of the pollutant. Case 3. First order Reaction For a steady state operation and first order reaction assumption, the model equation is given as follows; out in1 exp EBRTCC k (3) Where, k1= first order reaction rate constant (s-1) defined as 2 * ,VVHSW SXfXD A mKY tanh 2 , * 2 2 , ; V VHSW X KYf XD and K: Monod kinetics con- stant 3 (kg m) [2]. 4. Results and Discussion To determine the kinetics and the best theoretical model that fits the experimental data, concentrations were av- eraged at each of the four EBRTs tested (Table 1). The average concentrations (Cin and Cout) and EBRT data were used to find the kinetics of H2S removal in the bio- filter. Equations (1), (2) and (3) were first re-arranged to ob- tain linear plots. A best fit line was drawn through the points for each case. Figures 3(a)-3(c) show the plots for all the three cases. From the correlation coefficients and Figure 3(c), it is clear that the data of novel biofilter media follows a first order kinetics. Thus, Equation (3) based on the fitted parameter now can be written as: outin exp0.055*EBRTCC (4) The removal efficiencies that were determined from the model Equation (4) were compared with the removal efficiencies calculated from the experimental data, as shown in Figure 4. It can be seen that the values of re- moval efficiency predicted by the model are in good agreement with the experimental data. In most industrial countries, air pollution control laws require the prediction of pollutant dispersion in ambient Table 1. Average concentrations at each EBRT. EBRT (s) Cin (ppm) Cout (ppm) 20 3.33 1.00 30 9.84 1.06 45 9.17 0.981 60 13.7 0.597 (a) (b) (c) Figure 3. (a) zero-order reaction limited (b) zero-order dif- fusion limited and (c) first order kinetics. air resulting from industrial emissions [9]. There are several atmospheric dispersion models (i.e. AERMOD, ISC-PRIME, ISCST3) that are used in the prediction of 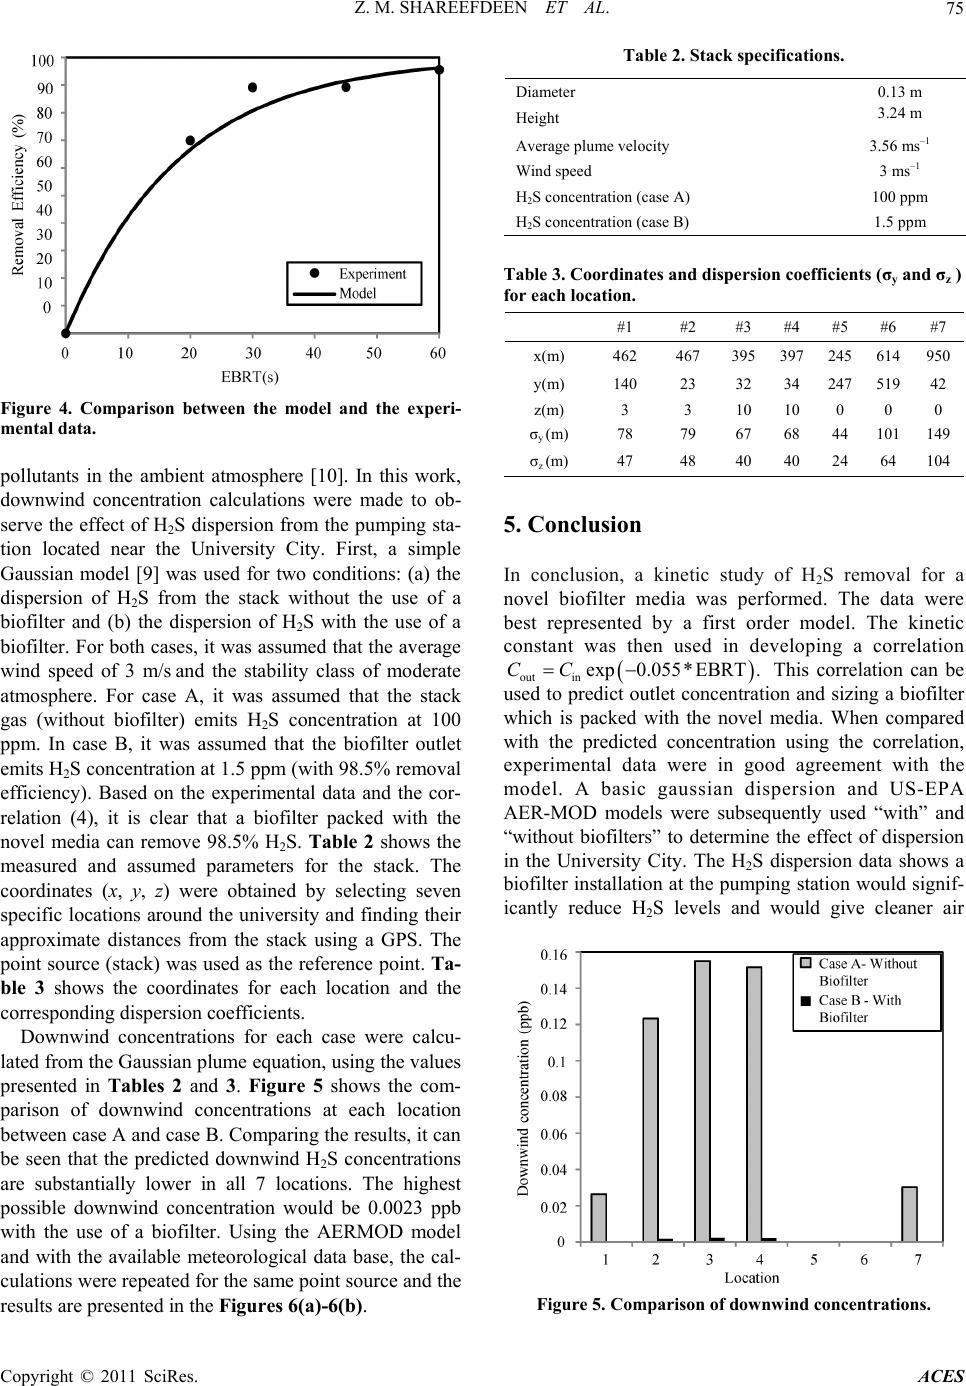 Z. M. SHAREEFDEEN ET AL. Copyright © 2011 SciRes. ACES 75 Figure 4. Comparison between the model and the experi- mental data. pollutants in the ambient atmosphere [10]. In this work, downwind concentration calculations were made to ob- serve the effect of H2S dispersion from the pumping sta- tion located near the University City. First, a simple Gaussian model [9] was used for two conditions: (a) the dispersion of H2S from the stack without the use of a biofilter and (b) the dispersion of H2S with the use of a biofilter. For both cases, it was assumed that the average wind speed of 3 m/s and the stability class of moderate atmosphere. For case A, it was assumed that the stack gas (without biofilter) emits H2S concentration at 100 ppm. In case B, it was assumed that the biofilter outlet emits H2S concentration at 1.5 ppm (with 98.5% removal efficiency). Based on the experimental data and the cor- relation (4), it is clear that a biofilter packed with the novel media can remove 98.5% H2S. Table 2 shows the measured and assumed parameters for the stack. The coordinates (x, y, z) were obtained by selecting seven specific locations around the university and finding their approximate distances from the stack using a GPS. The point source (stack) was used as the reference point. Ta- ble 3 shows the coordinates for each location and the corresponding dispersion coefficients. Downwind concentrations for each case were calcu- lated from the Gaussian plume equation, using the values presented in Tables 2 and 3. Figure 5 shows the com- parison of downwind concentrations at each location between case A and case B. Comparing the results, it can be seen that the predicted downwind H2S concentrations are substantially lower in all 7 locations. The highest possible downwind concentration would be 0.0023 ppb with the use of a biofilter. Using the AERMOD model and with the available meteorological data base, the cal- culations were repeated for the same point source and the results are presented in the Figures 6(a)-6(b). Table 2. Stack specifications. Diameter 0.13 m Height 3.24 m Average plume velocity 3.56 ms–1 Wind speed 3 ms–1 H2S concentration (case A) 100 ppm H2S concentration (case B) 1.5 ppm Table 3. Coordinates and dispersion coefficients (σy and σz ) for each location. #1 #2 #3 #4 #5 #6 #7 x(m) 462 467 395 397 245 614950 y(m) 140 23 32 34 247 51942 z(m) 3 3 10 10 0 0 0 σy (m) 78 79 67 68 44 101149 σz (m) 47 48 40 40 24 64 104 5. Conclusion In conclusion, a kinetic study of H2S removal for a novel biofilter media was performed. The data were best represented by a first order model. The kinetic constant was then used in developing a correlation outin exp0.055* EBRT.CC This correlation can be used to predict outlet concentration and sizing a biofilter which is packed with the novel media. When compared with the predicted concentration using the correlation, experimental data were in good agreement with the model. A basic gaussian dispersion and US-EPA AER-MOD models were subsequently used “with” and “without biofilters” to determine the effect of dispersion in the University City. The H2S dispersion data shows a biofilter installation at the pumping station would signif- icantly reduce H2S levels and would give cleaner air Figure 5. Comparison of downwind concentrations.  Z. M. SHAREEFDEEN ET AL. Copyright © 2011 SciRes. ACES 76 (a) (b) Figure 6. AERMOD model predicted H2S concentration profiles in (μg/m3) (a) without a biofilter (top) and (b) with a biofilter (bottom). to the University community. Based on this study, a local environmental company in UAE has funded a research project for an industrial application. The results of such study will be our future contribution. 6. Acknowledgment The authors acknowledge the support of American Uni- versity of Sharjah, United Arab Emirates (UAE). 7. References [1] Z. Shareefdeen, B. Herner, D. Webb and S. Wilson, “Hy- drogen Sulphide (H2S) Removal in Synthetic Media Bio- filters,” Environmental Progress, Vol. 22, No. 3, 2003, pp. 207-213. [2] Z. Shareefdeen and A. Singh, “Biotechnology for Odor and Air Pollution Control,” Springer, Berlin, 2005. doi:10.1007/b138434 [3] Y. Cohen, “Biofiltration—The Treatment of Fluids by Microorganisms Immobilized into the Filter Bedding Material: A Review,” Bioresource Technology Review, Vol. 77, 2001, pp. 257-254. doi:10.1016/S0960-8524(00)00074-2 [4] A. Martinez, et al., “Biofiltration of Wastewater Lift Sta- tion Emissions: Evaluation,” Clean Technologies and Environmental Policy, Vol. 10, No. 1, 2008, pp. 81-87. doi:10.1007/s10098-007-0110-y [5] D. Ramírez-Sáenz et al., “H2S and Volatile Fatty Acids Elimination by Biofiltration: Clean-Up Process for Bio- gas Potential Use,” Journal of Hazardous Materials, Vol. 163, No. 2-3, 2009, pp. 1272-1281. 10.1016/j.jhazmat.2008.07.129 [6] W. Lia, et al.. “Sulfide Removal by Simultaneous Auto- trophic and Heterotrophic Desulfurization-Denitrification Process,” Journal of Hazardous Materials, Vol. 162, 2009, pp. 848-853. doi:10.1016/j.jhazmat.2008.05.108 [7] Z. Shareefdeen, A. Aidan, W. Ahmed, M. B. Khatri, M. Islam, R. Lecheheb and F. Shams, “Hydrogen Sulphide Removal Using a Novel Biofilter Media,” World Acade- my of Science, Engineering and Technology, Vol. 62, 2010, pp. 13-16. [8] M. A. Deshusses and Z. Shareefdeen, “Modeling of Bio- filters for Odor and VOC Control Applications,” In: Z. Shareefdeen and A. Singh, Ed., Biotechnology for Odor and Air Pollution Control, Springer-Verlag, Berlin, 2005, pp. 213-229. doi:10.1007/3-540-27007-8_10 [9] N. De Nevers, “Air Pollution Control Engineering,” McGraw-Hill, Boston, 2000. [10] L. T. Jesse, L. T. Cristioane and A. J. Michel, “AER- MOD View: Interface for the US EPA AERMOD Mod- el,” 2009. |