Engineering, 2013, 5, 579-583
http://dx.doi.org/10.4236/eng.2013.510B119 Published Online October 2013 (http://www.scirp.org/journal/eng)
Copyright © 2013 SciRes. ENG
Design and Development of a Two Channel Telemedicine
System for Rural Health care
Mitrra Potheri Ramesh, Shruthi Balasubra manian, V arsha Vijayan*,
Geethanjali Balasubramanian, Mahesh Veezhinathan
Department of Bio-Medical Engineering, SSN College of Engineering, Kalavakkam, Chennai, I ndia
Email: *varsha.bme@gmail .com
Received 2013
ABSTRACT
In this work, an attempt has been made to design an Electro Cardio Gram (ECG) and Photo Plethysmo Gram (PPG)
based telemedicine system for rural health care. In India as per the survey conducted by Indian Medical Society in the
year 2009, it has been revealed that only 2% of the qualified doctors practice in rural areas. Also, according to the sta-
tistics taken by the World Health Organization, every year an estimated 17 million people die of various cardio vascular
disea ses. This paper introduces the transmission of ECG and PULSE from remote areas to the specialists’ office. The
ECG and P PG signals are acquired, digitized and processed using LabVIEW for detection of heart and pulse rate. These
data are transmitted using two methods namely Web publishing tool and Shared Variables. The results confirm the
transfer of data with less than millisecond delay.
Keywords: Telemedicine; ECG; LabVIEW; Web Publishing Tool; Shared Variables
1. Introduction
Telemedicine is the process of communication of health-
care related information from one place to another in the
form of interactive audio visual media. The rapid ad-
vancements in information and communication technol-
ogy can be used to bridge the rural urban divide. This
technique proves to be very important during life threat-
ening situatio ns and in places with lack of ava ilability of
specialists.
Various methods of transmission of physiological data
have been carried out previously. One such system uses
Time Division Multiplexing (TDM) to transmit data via
Bluetooth [1]. Another system uses a wearable vital sign
monitor that consists of a transmitter. It transmits the in-
formation via a Home Gateway using a proprietary pro-
tocol nRF24xx, to the central station [2]. The transmission
has also been achieved using RF transmitter and receiver
with slotted ALOHA for access by multiple users [3].
This paper deals with the acquisition, processing and
transmission of ECG and PPG signals from the remote
computer to the client using Web publishing tool and
Shared Variables. Hence, the diagnosis of a rural patient
can be facilitated by a city doctor with access to a com-
puter installed with LabVIEW and Internet. Further, it
eliminates the need for the conventional transmitter-re-
ceiver with limited range. The other applications include
transmission of vital details from ICU to the doctor’s
cabin and future developments can be done in transmit-
ting the parameters to specialist who is based anywhere
in the world.
2. Materials and Methods
2.1. Experimental Setup
The ECG-based telemedicine system [4] mainly consists
of the following five parts1) Data acquisition system;
2) Amplification of the acquired signals using hardware
modules; 3) Physiological signal reception in computer;
4) Signal processing and display; 5) Web publishing tool
and Shared Variables for viewing the signals on a
browser at a remote computer. T he signals can be viewed
and controlled from both the remote computer (server)
and the clients’ s ide.
2.2. Data Acquisition System
The ECG data is acquired from surface electrode using
Standard Recording Protocol. The acquired ECG is then
amplified using a hardware module with IC AD620. The
pulse signal is acquired using a Pulse Oximeter and am-
plified using IC LM324. The amplified signals are then
given as input to the three part NI-ELVIS system, the
NI-ELVIS workstation (prototype board) that interfaces
with the NI-DAQ (data acquisition) device and Lab-
VIEW software. NI ELVIS has a sampling rate of 1.25
*
Corresponding author.
P. R. MITRRA ET AL.
Copyright © 2013 SciRes. ENG
580
MegaSamples/second for single channel and an aggre-
gate of 1.00 MegaSamples/second [5] for multichannel.
The outputs of ECG amplifier and Pulse amplifier chan-
nel are AI-0, AI-1 of NI-ELVIS respectively. NI-DAQ
captures the ECG and pulse signals for analysis in Lab-
VIEW.
2.3. Signal Analysis
Instrumentation amplifier AD620 is used for amplifying
the acquired ECG. The choice of AD620 for this analysis
is due to its low noise, low input bias current and low
power and the use of a single external resistor for Gain
variation from 1 to 10,000 [6]. The gain-setting resistor
(RG) det ermines the gain, give n by Equation (1).
G = 1 + {(49.4) kΩ/R
G} (1)
The CMRR for gain = 10 is about 100 dB. IC LM324
is used for pulse amplification. The analog signals are
then processed in LabVIEW.
2.3.1. ECG Analysis
ECG acquired from healthy subjects using surface elec-
trodes is pr eprocessed prior to d etailed analysis. Initially,
raw ECG is preprocessed for noise and baseline drift
removal. This is done using Wavelet Denoising tool.
Daubechies 6 (db6) [7] wavelet is suitable because its
shape r esemble s tha t of ECG . Fo r better b alance between
smoothness and accuracy when compared to Discrete
Wavelet Transform (DWT), Undecimated Wavelet Tran-
sform (UWT) [8] of level 8 is applied. T he choice of this
level is because the noise removal efficiency is propor-
tional to the increase in levels. In addition, a sampling
rate of 1000 Hz is used; level 8 accounts for 7 Hz which
falls within QRS co mplex ran ge. Pa n To mpkins [9] algo-
rithm is then implemented for Heart Rate estimation.
Finite Impulse Response band pass filter of order 30,
with cut off frequency of 5 - 11 Hz is used for allowing
QRS complex. The filtered ECG is then differentiated
and sq uared t o enhance the high freque ncy R-wave s pr e-
sent. The peaks are then smoothened using moving-
window integrator which is essential to avoid multiple-
counting. Tone measurements block is used to compute
the freque ncy and eventually, the time interval and heart
rate are calculated and displayed. Two abnormal condi-
tions prominent in ECG viz. Bradycardia (below 30 beats)
and Tachycardia (above 100 beats) are simulated using
the rate adjustable ECG simulator Cardiosim. Boolean
indicators for these conditions are applied. The flow
char t of the p roce s s is shown i n t he Figure 1.
2.3.2. Pulse Measurement
Pulse signals are acquired using infrared LED pulse oxi-
metry type sensor. LM 324 amplifier is used for ampli-
fying the pulse signal acquired from subjects. The ampli-
fied signal is filtered using Moving Average Rectangular
Smoothing filter. Tone measurements tool is used for
meas urin g the amplit ude and frequency. Time period and
pulse rate are determined from the frequency obtained.
Flow chart for pulse analysis is shown in Figure 2.
The block diagra m of the entire system is as shown in
Figure 3.
The block diagram of the entire system is as shown in
Figure 4.
3. Telemedicine Module
The acquired data has been transmitted using two methods,
Web Publishing tool and Shared Variables available in
Figure 1. Block diagram for heart rate detection.
Figure 2. Block diagram for pulse rate detect ion.
Figure 3. Block diagram of telemedicine system.
P. R. MITRRA ET AL.
Copyright © 2013 SciRes. ENG
581
LabVIEW. The above stated methods utilize TCP/IP to
transfer the data via the Internet.
3.1. Web Publishing Tool
LabVIEW has a built in Web Server that can be used to
publish front panel images by creating a HTML docu-
ment. This tool produces Joint Photographic Experts
Group (JPEG) and Portable Network Graphics (PNG)
image formats of the front panel. There are three modes
for displaying the images of the front panel, “snapshot”
mode for publishing static images, “monitoring” mode
for publishing animated images with a configurable re-
fresh interval and the “embedded” mode which enables
the viewing and control of the webpage by the end user
[10].
The Front Panel of the real time ECG and Pulse moni-
toring system is selected in the embedded mode in the
web publishing tool to allow viewing and control by the
end use r. Add itional in format ion othe r than the inclusion
of front panel can be specified before the generation of
the HTML document. The URL of the generated HTML
document is then created. This URL can be used in other
computers connected via the LabVIEW Web Server to
view the front panel. Also, the client can request for
access to control the Front panel.
3.2. Shared Variables
Shared Variables available in LabVIEW is used to share
data across the web using NI Distribution System Man-
ager. This method necessitates the availability of the
Shared Variable engine in both the remote and client
computer. From among the three types of Shared Va-
riables that can be used viz. Single process, Network and
Time Triggered, Network type is used in this work. Net-
work Shared Variables are used to read and write data
via Ethernet, using NI Publish and Subscribe Protocol
(NI-PSP).
Shared variable engine is used to host the variables on
network after deployment. The shared variables can be
transferred in a local network connected by a LAN and
Wi-Fi. Two separate variables are to be created, one on
the server side and the other on the client side. The va-
riables can be viewed using NI Distribution System
Manager and can be continuously refreshed. Numeric
data along with its trend can be shared using the above
process.
4. Results and Discussion
The ECG and PPG VIs have been combined into a single
Telemedicine System using Sub-VIs in LabVIEW. Fig-
ure 5 shows the front panel of the consolidated system.
Figure 4. Simulation for abnormal condition.
Figure 5. Final front panel of telemedicine system (TRAN- SMISSION SIDE).
P. R. MITRRA ET AL.
Copyright © 2013 SciRes. ENG
582
Figure 6 shows the output in a web browser obtained
using Web Publishing Tool. The client computer dis-
playing the output of numerical value of Heart Rate
transmission using Shared Variables is shown in Fig ure
7. Similarly, the Pulse Rate transmission output using
Shared Variables can be seen by altering the view in the
same window. The output of Web Publishing Tool is
viewed using any web browser with the URL of the VI.
The numerical values such as the Heart and the Pulse
Rates are transmitted efficiently using Shared Variables,
thus savi ng bandwidt h.
The results obtained are compared with previously ex-
isting systems. One such system [11] uses TCP/IP pro-
gramming in LabVIEW to transmit a single channel of
ECG. This s ystem proves to be more efficient in ter ms of
transmitting multiple parameters with minimum delay.
The proposed method deploying Shared Variables saves
more bandwidth when compared to the previous system
[4]. The range of Wi-Fi used is 100 m radius [12], which
is better when compared to Bluetooth [1] range of 10 m.
Figure 6. Web brows er s howing the front panel (RECE IVING SIDE).
Figure 7. Transmitting heart rate using shared variables.
P. R. MITRRA ET AL.
Copyright © 2013 SciRes. ENG
583
Also, Web Publishing tool output can be published on
any system with LabVIEW Web Server. Since the pro-
posed system uses LabVIEW for signal processing, it is
easy to use and maintain with low energy consumption,
unlike the system [2] which uses a high end ARM pro-
cessor.
5. Conclusion
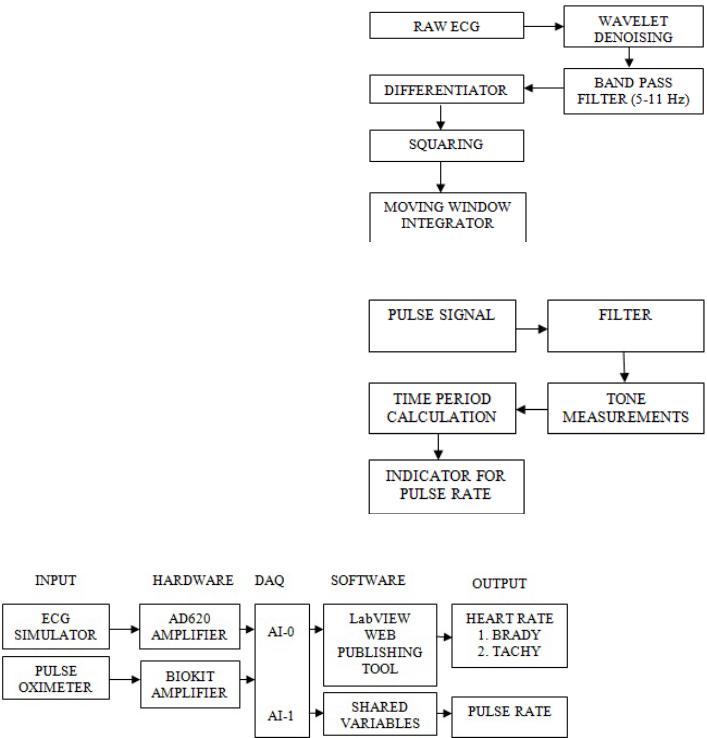
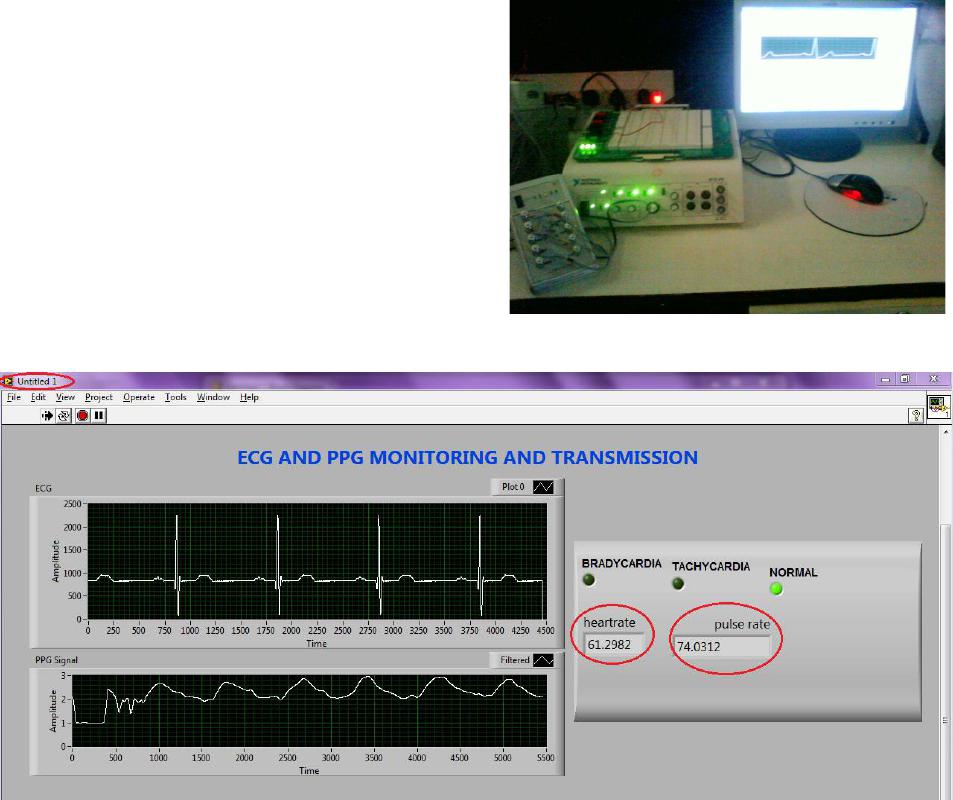
The ECG and Pulse signals were successfully acquired,
preprocessed and transmitted using the transmission me-
thods available in LabVIEW viz. Web Publishing tool
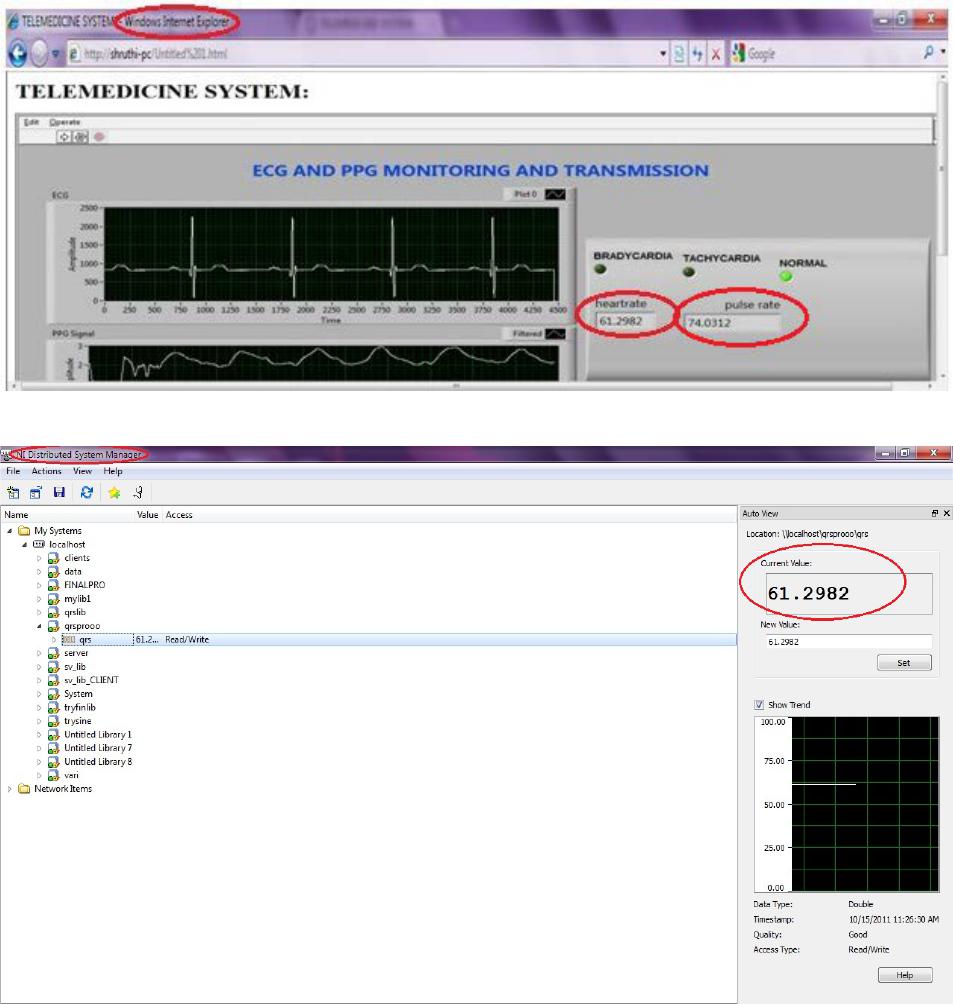
and Shared Variables. The output of Web Publishing
Tool is viewed using any web browser and numerical
values such as the Heart and the Pulse Rates are trans-
mitted efficiently, thus saving bandwidth. The potential
usefulness of this two channel low-cost, low-power te-
lemedicine system is aimed for improving rural health
monitoring. Further enhancement of this work would be
to extend it to a multiple physiological parameter trans-
mission module with provision for storage of waveforms
and other data.
REFERENCES
[1] M. J. Deghani, A. R. Shahabina and A. A. Safari, “Imple-
mentation of wireless based Bluetooth technology for
Biosignal Monitoring,” World Applied Sciences Journal,
Vol. 3, 2010,pp. 287-293.
[2] X. B. Shen, J. P. Zeng and T. D. Hin, “Remote Healt hcare
Monitoring System,” International Conference on Bio-
medical Engineering and Informatics, Vol. 3, 2010, pp.
1901-1905.
[3] H.-L. Chan, C.-Y. Lu, C.-H. Liu and M.-A. Lin, “Low-
Power Wireless Transmission of Biosignals Using the
Stotted ALOHA Mechanism,” IEEE International Con-
ference on Systems, Man and Cybernetics, Vol. 1, 2006,
pp. 513-517.
[4] X. Tan, X.-M. Guo, M. Cheng, Y. Yan, College of Bio-
engineering, Chongqing University, Chongqing,Wireless
Telemedicine Physiological Monitoring Center Based on
Virtual Instruments,The 1st International on Bioinfor-
mati cs an d Biomedical Engineering, Wuhan, 6-8 July 2007,
pp. 1157-1160.
[5] National Instruments, “Integrated Suite of 12 Instruments
for Interative, Cost-Effecti ve, Multidisciplinary, Hands-
On Learning [Data File],” 2008.
http://www.addlink.es/pdf/AGDWeb1711.pdf
[6] Low Cost Low Power Instrumentation Amplifier AD620
[Data File]. 1999.
http://www.stanford.edu
http://www.stanford.edu/class/ee122/Parts_Info/datasheet
s/ad620.pdf
[7] P. Sauravh and M. Madhuchhanda, “Detection of ECG
Characteristic Points Using Multiresolution Wavelet
Anaylsis Based Selective Coefficient Method,” Elsevier
Measurement, Vol. 43, No. 2, 2010, pp. 255-261.
[8] N. Akshay, N. A. V. Jonnabhotla, N. Sad am and N. D.
Yeddanapudi, “ECG Noise Removal and QRS Complex
Detection Using UWT,” IEEE International Conference
on Electronics and Information Engineering (ICEIE),
Kyoto, 1-3 August 2010, pp. 438-442.
[9] M. R. Rangaraj , Biomedical Signal Analysis—A Case
Study Approach,” IEEE Press, Calgary, 2002, pp. 187-
190.
[10] P. F. Li and L. H. Nie, “Remote control Laboratory based
on LabVIEW,” 2nd International Conference on Intelli-
gent Computation Technology and Automation, Vol . 4,
2009, pp. 84-87.
[11] H. Shekhar, J. S. J. Kumar, V. Ashok and A. V. Juliet,
Applied Medical Informatics Using LabVIEW,” 2nd In-
ternational Conference on Intelligent Systems, Modelling
and Simulation, Vol. 2, 2010, pp. 198-203.
[12] B. Sidhu, H. S ingh and A. Chhabra, “Emerging Wireless
StandardsWiFi, Zi gB ee and WiMAX,” World Academy
of Science, Engineering and Technology, Vol. 25, 2007,
pp. 1345-1349.