Paper Menu >>
Journal Menu >>
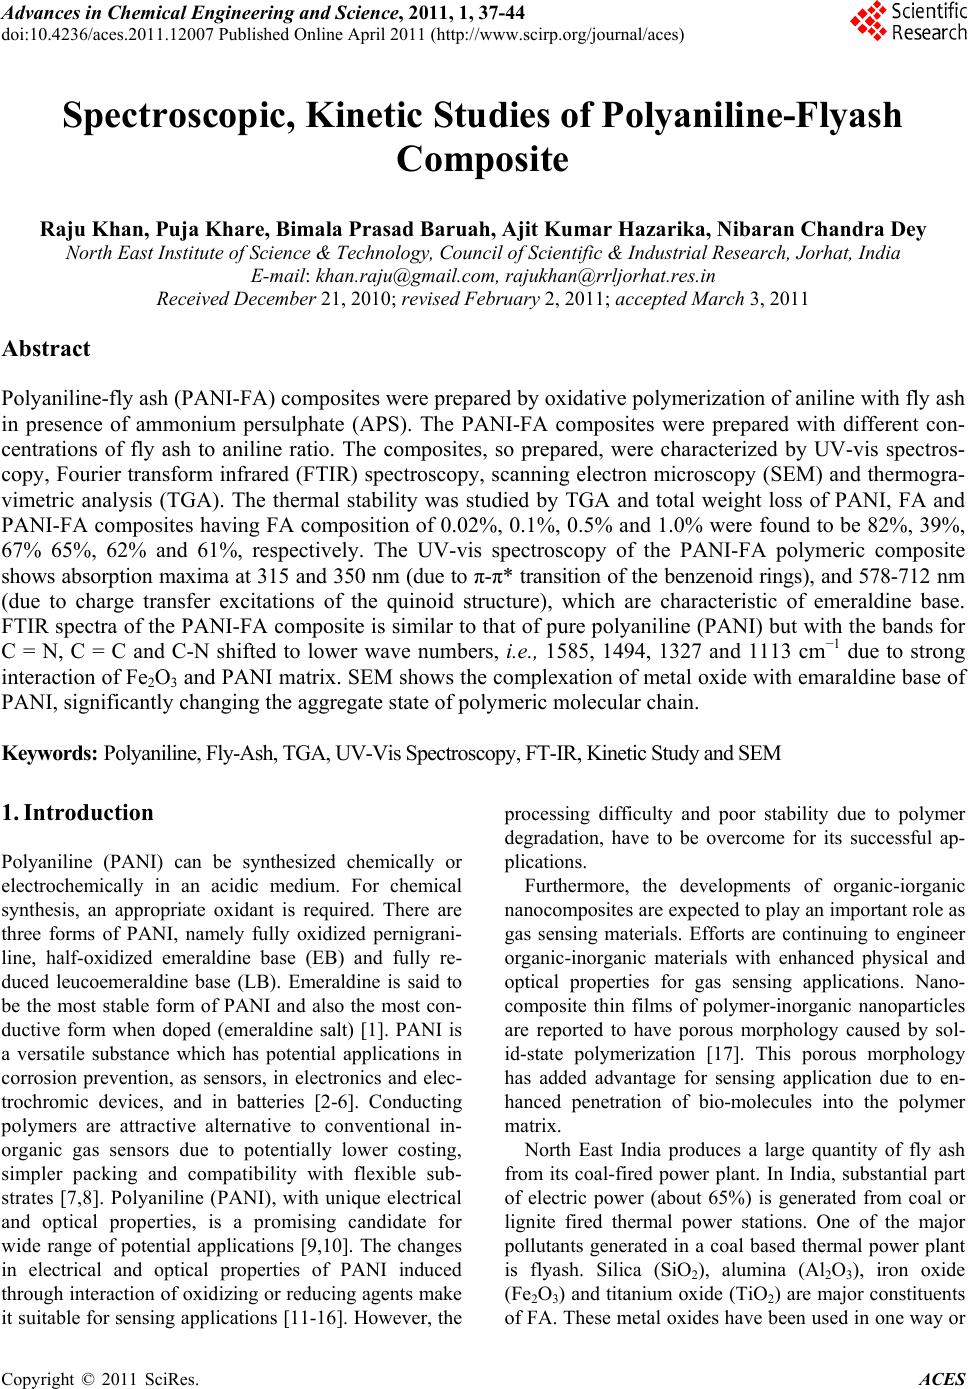 Advances in Chemical Engi neering and Science , 20 1 1, 1, 37-44 doi:10.4236/aces.2011.12007 Published Online April 2011 (http://www.scirp.org/journal/aces) Copyright © 2011 SciRes. ACES Spectroscopic, Kinetic Studies of Polyaniline-Flyash Composite Raju Khan, Puja Khare, Bimala Prasad Baruah, Ajit Kumar Hazarika, Nibaran Chandra Dey North East Institute of Science & Technology, Council of Scientific & Industrial Research, Jorhat, India E-mail: khan.raju@gmail.com , rajukhan@rrljorhat.res.in Received December 21, 2010; revised February 2, 2011; accepted Marc h 3, 2011 Abstract Polyaniline-fly ash (PANI-FA) composites were prepared by oxidative polymerization of aniline with fly ash in presence of ammonium persulphate (APS). The PANI-FA composites were prepared with different con- centrations of fly ash to aniline ratio. The composites, so prepared, were characterized by UV-vis spectros- copy, Fourier transform infrared (FTIR) spectroscopy, scanning electron microscopy (SEM) and thermogra- vimetric analysis (TGA). The thermal stability was studied by TGA and total weight loss of PANI, FA and PANI-FA composites having FA composition of 0.02%, 0.1%, 0.5% and 1.0% were found to be 82%, 39%, 67% 65%, 62% and 61%, respectively. The UV-vis spectroscopy of the PANI-FA polymeric composite shows absorption maxima at 315 and 350 nm (due to π-π* transition of the benzenoid rings), and 578-712 nm (due to charge transfer excitations of the quinoid structure), which are characteristic of emeraldine base. FTIR spectra of the PANI-FA composite is similar to that of pure polyaniline (PANI) but with the bands for C = N, C = C and C-N shifted to lower wave numbers, i.e., 1585, 1494, 1327 and 1113 cm−1 due to strong interaction of Fe2O3 and PANI matrix. SEM shows the complexation of metal oxide with emaraldine base of PANI, significantly changing the aggregate state of polymeric molecular chain. Keywords: Polyaniline, Fly-Ash, TGA, UV-Vis Spectroscopy, FT-IR, Kinetic Study and SEM 1. Introduction Polyaniline (PANI) can be synthesized chemically or electrochemically in an acidic medium. For chemical synthesis, an appropriate oxidant is required. There are three forms of PANI, namely fully oxidized pernigrani- line, half-oxidized emeraldine base (EB) and fully re- duced leucoemeraldine base (LB). Emeraldine is said to be the most stable form of PANI and also the most con- ductive form when doped (emeraldine salt) [1]. PANI is a versatile substance which has potential applications in corrosion prevention, as sensors, in electronics and elec- trochromic devices, and in batteries [2-6]. Conducting polymers are attractive alternative to conventional in- organic gas sensors due to potentially lower costing, simpler packing and compatibility with flexible sub- strates [7,8]. Polyaniline (PANI), with unique electrical and optical properties, is a promising candidate for wide range of potential applications [9,10]. The changes in electrical and optical properties of PANI induced through interaction of oxidizing or reducing agents make it suitable for sensing applications [11-16]. However, the processing difficulty and poor stability due to polymer degradation, have to be overcome for its successful ap- plications. Furthermore, the developments of organic-iorganic nanocomposites are expected to play an important role as gas sensing materials. Efforts are continuing to engineer organic-inorganic materials with enhanced physical and optical properties for gas sensing applications. Nano- composite thin films of polymer-inorganic nanoparticles are reported to have porous morphology caused by sol- id-state polymerization [17]. This porous morphology has added advantage for sensing application due to en- hanced penetration of bio-molecules into the polymer matrix. North East India produces a large quantity of fly ash from its coal-fired power plant. In India, substantial part of electric power (about 65%) is generated from coal or lignite fired thermal power stations. One of the major pollutants generated in a coal based thermal power plant is flyash. Silica (SiO2), alumina (Al2O3), iron oxide (Fe2O3) and titanium oxide (TiO2) are major constituents of FA. These metal oxides have been used in one way or  R. KHAN ET AL. Copyright © 2011 SciRes. ACES 38 the other in the preparation of nanocomposites. For ex- ample, Al2O3 and Fe2O3 have been used as catalyst sup- port for the production of organic-inorganic porous na- nocomposites. In this paper we are using natural compo- sition of metal oxides for the preparation of PANI-FA composite, which forms morphologically porous marix and have improved thermal stabilty. The incorporation of FA into the polymeric network introduces uniform po- rosity and is expected to be advantageous for gas sensing and biosensing applications. 2. Experimental 2.1. Chemical and Reagents Aniline (25% v/v in water), acetone, ammonium persul- phate, dimethylformamide (DMF) and hydrochloric acid were all products of Sigma-Aldrich Chemicals. Only freshly vacuum-distilled aniline was used for the synthe- sis of PANI. EDX study showed that the main constitu- ents of the FA used in this study are as follows: silica as SiO2 ~ 50%, alumina as Al2O3 ~ 30%, calcium oxide as CaO ~ 5%, iron oxide as Fe2O3 ~ 4%, magnesium oxide as MgO ~ 2% and titanium oxide as TiO2 ~ 2%. 2.2. Synthesis of Polyaniline-Fly Ash Composites For preparation of Polyaniline-Fly Ash (PANI-FA) composite, the procedure for the synthesis of composite was followed [18]. 0.1 M aniline was prepared in 2 M HCl solution. 100 mL of this aniline solution was stirred and FA was added in the solution with vigorous stirring (0%, 10%, 20%, 30%, and 40% FA to aniline w/w ratio). The mixture was kept in an ice bath with continuous stir- ring. Then 0.1 mol of ammonium persulphate (APS) was added slowly to the aniline solution until the reaction mixture turned green. The reaction mixture was then stirred for 8 h. The product was collected by filtration and washed with water and acetone until the washing was colourless. The collected samples were dried at room temperature and preserved for further studies. 2.3. Characterization of PANI, FA and PANI-FA Composites All the UV-vis absorbance experiments were per- formed at room temperature with UV-vis Specord-200 using quartz cuvettes. The UV-vis sample solution was prepared by dissolving 0.005 g of a PANI composite in 10 mL dimethylformamide (DMF) and experimental wavelength scanned between 200 to 800 nm. The infra- red spectra of the PANI, FA and PANI-FA polymer composite were recorded on Perkin Elmer system 2000 FT-IR spectrometer using KBr pallets at room tempera- ture in the region of 3600-4000 cm−1. Scanning electron microscopy (SEM) analysis was performed with a Hita- chi X-650 scanning electron microanalyser which has an operating voltage window of 5 - 40 kV. Micrographs were obtained for samples of the composites mounted on aluminium stubs using conductive glue and coated with a thin layer of gold. Experiments were carried out in a Le- co TGA 701 thermal analysis system with 0.5 gm each of fly-ash samples in a stream of nitrogen with a flow rate of 40 mL·min−1 and linear heating rate of 10℃·min−1. The weight loss (thermogravimetric TG signals) and the rate of weight loss (differential thermogravimetric DTG signals) as a function of time or temperature were rec- orded. 3. Results and Discussion 3.1. FTIR Properties FTIR spectra of PANI, FA & PANI-FA composite are shown in Figure 1. FTIR band at 2982-3463 cm−1 cor- responds to N-H stretching with hydrogen bonded amino groups and free O-H stretching vibration and is attributed to the N-H stretching vibrations of the leucoemeraldine component. The characteristic absorption band observed for PANI-flyash at 3463 cm−1 and 1690 cm−1 are assigned to the N-H stretching vibration mode, and NH2 deforma- tion in aniline unit respectively. The absorption band 2925 cm−1 and 2830 cm−1 are assigned to the aromatic sp2 hybridized C-H stretching vibration mode and aliphatic hydrocarbon C-H stretching due to -CH2- bonded with aniline unit. Strong peak at 2355 cm−1 was associated with -NN in diazonium salts. The absorption bands ob- Figure 1. FTIR spectra of chemically synthesized of (a) PANI; (b) FA; (c) and composite of polyaniline-flyash, PA- NI-FA (0.02); (d) PANI-FA (0.1); (e) PANI-FA (0.5) and (f) PANI-FA (1.0).  R. KHAN ET AL. Copyright © 2011 SciRes. ACES 39 served at 1567 and 1482 cm−1 in PANI is assigned re- spectively to the non-symmetric vibration mode of C=C in quinoid and benzenoid ring system in polyaniline. The C-N stretching vibration mode in aromatic amine nitro- gen (quinoid system) in doped polyaniline is found at 1290 cm−1, corresponding to the oxidation or protonation state. The absorbance peak at 1233 cm−1 is attributed to C-N stretching vibration mode in benzenoid ring system of polyaniline due to the conducting protonated form. In plane vibration of C-H bending mode in N = Q = N, Q-N+H-B or B-N+H-B (where Q = quinoid and B = ben- zenoid) is observed at 1146 cm−1. The presence of this absorption band is expected due to the polymerization of PANI, i.e., polar structure of the conducting protonated form. The absorption bands at 874 and 799 cm−1 are at- tributed to the aromatic ring and out of plane C-H de- formation vibrations for 1, 4-disubstituted aromatic ring system[19]. In FTIR spectrum of purified FA, the characteristic 3426 cm−1 band indicating the stretching vibration of the -OH group appears due to some components with an -OH group or crystal lattice water on the surface of FA. Broadening in characteristic peaks range 2750 - 3463 cm−1 is associated with N-H stretching vibration of PANI. The decrease in broadening of FTIR bands in the range 2750 - 3463 cm−1 was due to covalent and hy- drogen bonding between –NH2 and –OH group of PANI and FA respectively. The very sharp FTIR peak at 1632 cm−1 was associated with C = O stretch in –HNCOCH3 group of PANI-FA matrix. The IR spectra of PANI composite in presence of FA exhibit new absorption peaks distinctly at 1522, 1447, 1280, 1196 and 641 cm–1 which could be assigned to the presence of various metal oxides in the composite. The peak around 1113 cm−1 may be attributed to the presence of silica within the composite. The FTIR peaks at 1030 cm−1 for the FA corresponds to the internal SiO4 tetrahedra, especially the Si-O-Si chain structure. The peaks at 1030 - 1196 cm−1 of the FA correspond to a cyclic Si-O-Si structure. The FA indicates the FTIR spectra of Fe2O3, where the bands around 540-466 cm−1 are assigned to Fe-O stretch. It can be seen that the FTIR spectra of the PANI-FA composite is similar to that of pure PANI where the bands for C=N, C=C and C-N are all shifted to lower wave numbers, i.e. 1585, 1494, 1327 and 1113 cm−1 due to strong interac- tion of Fe2O3 and PANI [20]. 3.2. UV-Vis Properties The UV-vis absorption spectra of PANI and PANI-FA composite are shown in Figure 2. Two absorption bands are observed in the wavelength region from 315 to 350 nm and a small band at 578 to 712 nm for the PANI (Figure 2(b)). PANI always exhibits a π-π* transition, 300 400 500 600 700 800 0.0 0.5 1.0 0 2 4 6 8 1 dc a b e Absorbance W avelength (nm ) Figure 2. UV-vis spectra of chemically synthesized of (a) PANI-FA (1.0), (b) PANI, (c) PANI-FA (0.5), (d) PANI-FA (0.1) and (e) FA. usually closer to 315 nm [21]. Partially oxidized PANI and its oligomers display an additional absorption at around 712 nm associated with the quinoid (oxidized) units [22]. These peaks are characteristic of the PANI emeraldine base [23,24] and indicate that nanostructured PANI composites are stabilized in the emeraldine base redox state. The peak at 315 nm is attributed to π – π* transition of benzoid rings and the peak at 712 nm is at- tributed to the charge transfer excitation of the quinoid structure. In the spectra of pure FA, peaks are observed in the regions at 258-289 nm but were found absent in the region 600-700 nm (Figure 2(e)). PANI–FA pre- pared without aging show clear similarity in their UV-vis spectra particularly with the complete absence of the absorption maxima at 320 and 630 nm which is asso- ciated with the stabilization of the composite in the eme- raldine form. Comparatively, PANI–FA composite show clear similarity in their UV-vis spectra particularly with the presence of the absorption maxima at 315 and 610 nm which is associated with the stabilization of the composite in the emeraldine form. Comparison of the PANI and PANI-FA composite spectra shows that FA stabilizes the polyanilines in its emeraldine form. 3.3. TGA Properties TGA is widely used to study all physical process involv- ing the weight changes such as to measure the diffusion characteristics and the moisture uptake of a sample. The thermo gravimetric profiles of PANI, FA and PANI-FA polymer composite is shown in Figure 3. Total weight loss of PANI, FA and PANI-FA polymer composite PANI-FA (0.02), PANI-FA (0.1), PANI-FA (0.5) and  R. KHAN ET AL. Copyright © 2011 SciRes. ACES 40 (a) (b) Figure 3. Thermo gravimetric analysis (TGA) of chemically synthesized of (Figure 3(a)) and DTG of (Figure 3(b)) PANI, FA and composite of polyaniline-flyash PANI-FA (0.02), PANI-FA (0.1) PANI-FA (0.5) and PANI-FA (1.0). PANI-FA (1.0) are 82%, 39%, 67%, 65%, 62% and 61%, respectively. Decrease in ultimate weight loss indicates the interaction of PANI with the metal oxides such as Al2O3, Ti-O-Ti and SiO2 present in FA. FTIR spectra of these composites also show strong interaction of SiO2, Fe2O3 and PANI. This may be due to the Van der-Walls binding of PANI-FA polymer composites. The thermogram of PANI indicates three major stages of weight loss. In the first stage, 3% - 4% weight loss at temperature up to 125˚C is associated with the loss of water molecules from the polymer matrix [1]. The weight loss at second stage that commences after 125˚C until 225˚C (about 9-12%) is due to the removal of the acid dopant bound to the polyaniline chain and low molecular weight oligomers. A slow and somewhat gradual weight loss profile observed starting at 225˚C onward, represent degradation of the skeletal polyaniline chain structure after the dopant has been removed [25]. Above 600℃, the results obtained are associated with the residues only. The thermogram of fly ash indicates four major stages of weight loss (Figure 3(b)). PANI and composite PANI- FA(0.02) and PANI-FA(0.1) exhibit similar pattern, with a small variation in degradation temperature, while ther- mograms of PANI-FA(0.5) and PANI-FA (1.0) show similar pattern with FA. In the first stage, 3-4% weight loss at temperature up to 125˚C is associated with the loss of water molecules [26]. In the second stage corres- ponding to temperature zone 125º - 400˚C, the weight loss (about 9-12%) is due to the evolution of thermally labile compounds and the breaking of aliphatic structures with low dissociation bonds in the carbonaceous matrix of FA. In the third stage that commences after 400˚C until 700˚C, maximum weight loss occurs (21%) due to release of shoot particles attached with SiO2 system of FA [9,16]. Above, 700˚C gradual decreases were ob- served due to thermal degradation of mineral matter of fly ash. The weight loss of PANI, fly-ash and composi- tions of PANI-FA (0.02), PANI-FA (0.1), PANI-FA (0.5) PANI-FA (1.0) have been found 82%, 38.9%, 67% 65%, 62% and 61%, respectively. A decrease in weight loss of composite is observed with the increasing FA content. It indicates the interaction of polyaniline with mineral matter of the FA. As indicated earlier, SiO2, Fe2O3 and Al2O3 are the major oxides present in the FA. FTIR spectra of these composites confirm strong interactions with metal oxides SiO2, Fe2O3 and polyaniline in the composite matrix. 3.4. Kinetic Properties The activation energies of PANI, FA and PANI-FA composites were determined by the integral method [27]. It is assumed a first order reaction [28,29]. Applying Arr- henius equation for reactions, it can be expressed as dd exp1 x tAERT x (1) where A is pre-exponential factor, E is the activation energy, T is temperature in K, R is gas constant, t is time and x is weight loss fraction or decomposition during pyrolysis which can be calculated by 00tf x WW WW (2) where W0 is the original mass of the test sample, Wt is the mass at time t or at temperature T and Wf is the final mass at the end of pyrolysis. The constant heating rate during pyrolysis is H = dT/dt for H being the heating rate. Rearranging the Equation (1) and integration gives 2 lnln 1ln12 x TARHERTEERT (3) 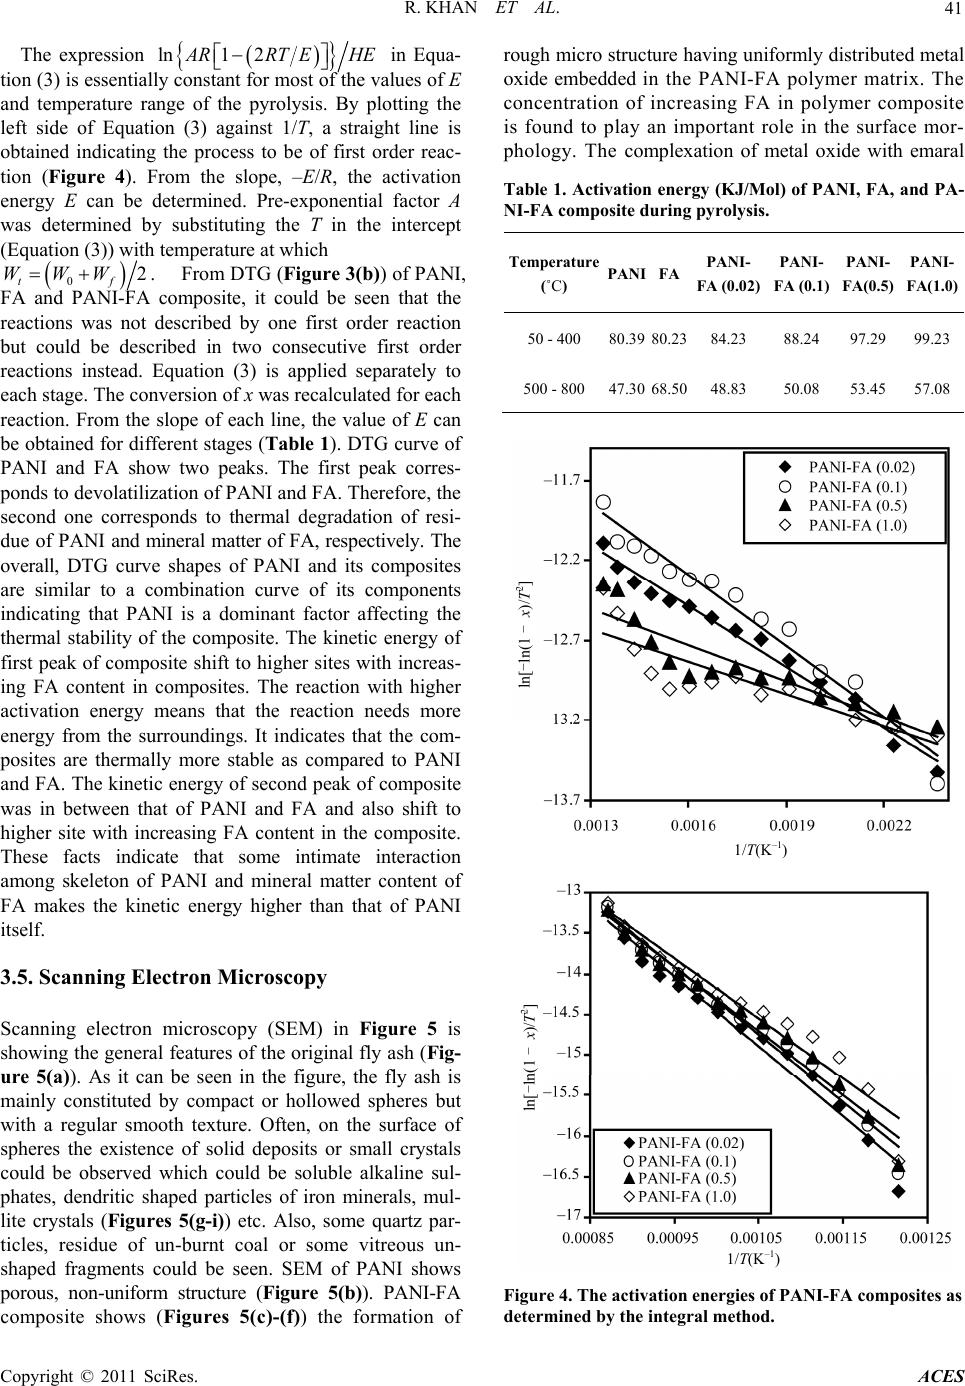 R. KHAN ET AL. Copyright © 2011 SciRes. ACES 41 The expression ln1 2 A RRTEHE in Equa- tion (3) is essentially constant for most of the values of E and temperature range of the pyrolysis. By plotting the left side of Equation (3) against 1/T, a straight line is obtained indicating the process to be of first order reac- tion (Figure 4). From the slope, –E/R, the activation energy E can be determined. Pre-exponential factor A was determined by substituting the T in the intercept (Equation (3)) with temperature at which 02 tf WWW . From DTG (Figure 3(b)) of PANI, FA and PANI-FA composite, it could be seen that the reactions was not described by one first order reaction but could be described in two consecutive first order reactions instead. Equation (3) is applied separately to each stage. The conversion of x was recalculated for each reaction. From the slope of each line, the value of E can be obtained for different stages (Table 1). DTG curve of PANI and FA show two peaks. The first peak corres- ponds to devolatilization of PANI and FA. Therefore, the second one corresponds to thermal degradation of resi- due of PANI and mineral matter of FA, respectively. The overall, DTG curve shapes of PANI and its composites are similar to a combination curve of its components indicating that PANI is a dominant factor affecting the thermal stability of the composite. The kinetic energy of first peak of composite shift to higher sites with increas- ing FA content in composites. The reaction with higher activation energy means that the reaction needs more energy from the surroundings. It indicates that the com- posites are thermally more stable as compared to PANI and FA. The kinetic energy of second peak of composite was in between that of PANI and FA and also shift to higher site with increasing FA content in the composite. These facts indicate that some intimate interaction among skeleton of PANI and mineral matter content of FA makes the kinetic energy higher than that of PANI itself. 3.5. Scanning Electron Microscopy Scanning electron microscopy (SEM) in Figure 5 is showing the general features of the original fly ash (Fig- ure 5(a)). As it can be seen in the figure, the fly ash is mainly constituted by compact or hollowed spheres but with a regular smooth texture. Often, on the surface of spheres the existence of solid deposits or small crystals could be observed which could be soluble alkaline sul- phates, dendritic shaped particles of iron minerals, mul- lite crystals (Figures 5(g-i)) etc. Also, some quartz par- ticles, residue of un-burnt coal or some vitreous un- shaped fragments could be seen. SEM of PANI shows porous, non-uniform structure (Figure 5(b)). PANI-FA composite shows (Figures 5(c)-(f)) the formation of rough micro structure having uniformly distributed metal oxide embedded in the PANI-FA polymer matrix. The concentration of increasing FA in polymer composite is found to play an important role in the surface mor- phology. The complexation of metal oxide with emaral Table 1. Activation energy (KJ/Mol) of PANI, FA, and PA- NI-FA composite during pyrolysis. Temperature (˚C) PANI FAPANI- FA (0.02) PANI- FA (0.1) PANI- FA(0.5) PANI- FA(1.0) 50 - 400 80.3980.2384.23 88.24 97.2999.23 500 - 800 47.3068.5048.83 50.08 53.4557.08 Figure 4. The activation energies of PANI-FA composites as determined by the integral method. 1/T(K–1) ln[-ln(1 - x)/T2] 1/T(K–1) ln[-ln(1 - x)/T2]  R. KHAN ET AL. Copyright © 2011 SciRes. ACES 42 (a) (b) (c) (d) (e) (f) (g) (h) (i) Figure 5. Scanning electron micrograph (SEM) of chemical synthesized of (a) FA (b) PANI and (c-f) composite of polyani- line-flyash PANI-FA (0.02), PANI-FA (0.1), PANI-FA (0.5) and PANI-FA (1.0), EDXA spectra from (g-i) composite of polya- niline-flyash PANI-FA (0.1), PANI-FA (0.5) and PANI-FA (1.0). dine base form of PANI significantly changes the aggre- gate state of polymeric molecular chain. The incorpora- tion of metal oxides into the polymeric network induces uniform porosity and is expected to be advantageous for gas and biosensing applications. 4. Conclusions In this study we demonstrated a way to use the toxic waste like fly ash (FA) to enhance the characteristic pro- perties of polyaniline (PANI). Polyaniline fly-ash (PA- NI-FA) composites were prepared by oxidative polyme- rization of aniline with fly ash in presence of ammonium persulphate. The morphology of new composite mate- rials was studied by scanning electron microscopy (SEM). SEM and EDXA pictures have been confirmed the complexation of metal oxide with emaraldine base form of PANI, significantly changing the aggregate state of polymeric molecular chain. The increase of kinetic energy as seen from TGA for the PANI-FA composite compared to PANI and FA indicate strong complexation of metal oxide with PANI emaraldine base. 5. Acknowledgements Raju Khan is thankful to the Department of Science & Technology (DST), Govt. of India, for financial support under the Young Scientist Scheme project No. SR/FT- P/CS-77/2007. 6. References [1] R. L. N Chandrakanthi and M. A. Careem, “Preparation and Characterization of CdS and Cu 2S Nanopar- ticle/Polyaniline Composite Films,” Thin Solid Films, Vol. 417, 2002, pp. 51-56. doi:10.1016/S0040-6090(02)00600-4 [2] J. E. Albuquerque, L. H. C. Mattoso, D. T. Balogh, R. M.  R. KHAN ET AL. Copyright © 2011 SciRes. ACES 43 Faria, J. G. Masters and A. G. MacDiarmid, “A Simple Method to Estimate the Oxidation State of Polyanilines,” Synthetic Metals, Vol. 113, 2000, pp. 19-22. doi:10.1016/S0379-6779(99)00299-4 [3] D. C. Schnitzler, M. S. Meruvia, I. A. H. Mmelgen and A. J. G. Zarbin, “Preparation and Characterization of Novel Hybrid Materials Formed from (Ti,Sn)O2 Nano-Particles and Polyaniline,” Chemistry of Materials, Vol. 15, No. 24, 2003, pp. 4658-4665. doi:10.1021/cm034292p [4] F. Huguenin, G. M. Janete, E. A. Ticianelli and R. M. Torresi, “Structural and Electrochemical Properties of Nanocomposites Formed by V2O5 and Poly (3-Alkyl- pyrroles),” Journal Power Sources, Vol. 103, 2001, pp. 113-136. doi:10.1016/S0378-7753(01)00851-5 [5] V. A. Samoylov, Q. Hao, M. Y. Shirshov, C. Swart, E. Pringsheim, M. V. Mirsky and O. S. Wolfbeis, “Nano- meter-Thick SPR Sensor for Gaseous HCl,” Sensors & Actuators, Vol. 106, 2005, pp. 369-372. doi:10.1016/j.snb.2004.08.029 [6] M. Ando, C. Swart, E. Pringsheim, M. V. Mirsky and O. S. Wolfbeis, “Optical Ozone-Sensing Properties of Poly (2-Chloroaniline), Poly (N-Methylaniline) and Polyani- line Films,” Sensors & Actuators B, Vol. 108, 2005, pp. 528-534. doi:10.1016/j.snb.2004.12.083 [7] W. Schultze and H. Karabalut, “Electrochemical Copo- lymerization of M-Toluidine and O-Phenylenediamin,” Electrochimica Acta, Vol. 50, 2005, pp. 1739-1745. doi:10.1016/j.electacta.2004.10.023 [8] H. Bai and G. Shi, “Gas Sensors Based on Conducting Polymers,” Sensor, Vol. 2, 2007, pp. 267-307. doi:10.3390/s7030267 [9] B. D. Malhotra, A. Chaubey and S. P. Singh, “Prospects of Conducting Polymers in Biosensors,” Analytica Chi- mica Acta, Vol. 578, 2006, pp. 59-74. [10] D. C. Trivedi, “Handbook of Organic Conductive Mole- cules and Polymers,” Wiley, Chichester, 1997, pp. 505- 572. [11] R. Khan and M. Dhayal, “Chitosan/Polyaniline Hybrid Conducting Biopolymer Base Impedimetric Immunosen- sor to Detect Ochratoxin-A,” Biosensors & Bioelectron- ics, Vol. 24, 2009, pp.1700-1705. doi:10.1016/j.bios.2008.08.046 [12] R. Khan, A.Kaushik and A. P. Mishra, “Immobilization of Cholesterol Oxidase onto Electrochemically Polyme- rized Film of Biocompatible Polyaniline-Triton X-100,” Materials Science and Engineering: C, Vol. 29, 2009, pp. 1399-1403. doi:10.1016/j.msec.2008.11.001 [13] R. Khan, P. R. Solanki, A. Kaushik, S. P. Singh, S.Ahmad and B. D. Malhotra, “Cholesterol Biosensor Based on Electrochemically Prepared Polyaniline Con- ducting Polymer Film in Presence of a Nonionic Surfac- tant,” Journal of Polymer Research, Vol. 16, 2009, pp. 363-373. doi:10.1007/s10965-008-9237-8 [14] A. Ansari, R. Khan, K. N. Sood and B. D. Malhotra, “Polyaniline-Cerium Oxide Nanocomposite for Hydrogen Peroxide Sensor,” Journal of Nanoscience & Nanotech- nology, Vol. 9, 2009, pp. 4679-4685. doi:10.1166/jnn.2009.1085 [15] A. Kaushik, J. Kumar, M. K. Tiwari, R. Khan, B. D. Malhotra, V. Gupta and S. P. Singh, “Fabrication and Characterization of Polyaniline – ZnO Hybrid Nano- composite Thin Film,” Journal of Nanoscience & Nano- technology, Vol. 8, 2008, pp. 1757-1761. doi:10.1166/jnn.2008.006 [16] A. Kaushik, R. Khan, V. Gupta, B. D. Malhotra and S. P. Singh, “Hybrid Cross-Linked Polyaniline -WO3 Nano- Composite Thin Film Using Thermal Vacuum Deposition Technique for NOx Gas Sensing,” Journal of Nanos- cience & Nanotechnology, Vol.9, 2009, pp. 1792-1796. doi:10.1166/jnn.2009.417 [17] D. Y. Godovsky, A. E. Vorfolomeer, D. F. Zaretskya and R. L. N. Chandrakanthi, “Preparation of Nanocomposites of Polyaniline and Inorganic Semiconductors,” Journal of Material Chemistry, Vol. 11, 2005, pp. 2465-2469. doi:10.1039/b103048p [18] E. I. Iwuoha, S. E. Mavundla, V. S. Somerset, L. F. Petrik, M. J. Klink, M. Sekota and P. Bakers, “Electrochemical and Spectroscopic Properties of Fly Ash-Polyaniline Ma- trix Nanorod Composites,” Microchimica Acta, Vol. 155, 2006, pp. 453-458. doi:10.1007/s00604-006-0584-z [19] C. A. Rees, J. L. Provis, G. C. Lukeya and J. S. J. van Deventer, “Attenuated Total Reflectance Fourier Trans- form Infrared Analysis of Fly Ash Geopolymer Gel Ag- ing,” Langmuir, Vol. 23, 2007, pp. 8170-8179. doi:10.1021/la700713g [20] S. Sathiyanarayanan, S. S. Azim and G. Venkatachari, “Preparation of Polyaniline–Fe2O3 Composite and Its An- ticorrosion Performance,” Synthetic Metats, Vol. 157, 2007, pp. 751-757. doi:10.1016/j.synthmet.2007.08.004 [21] Y. Cao, S. Z. Li, Z. J. Xuea and D. Guo, “Spectroscopic and Electrical Characterization of Some Aniline Oligo- mers and Polyaniline,” Synthetic Metats, Vol. 16, No. 3, 1986, pp. 305-315. doi:10.1016/0379-6779(86)90167-0 [22] J. Libert, J. Cornil, D. A. dos Santos and J. L. Bredas, “A Theoretical Investigation of from Neutral Oligoanilines to Polyanilines: The Chain-Length Dependence of the Elec- tronic and Optical Properties,” Physical Review B, Vol. 56, No. 14, 1997, pp. 8638-8650. doi:10.1103/PhysRevB.56.8638 [23] M. S. Cho, S. Y. Park, J. Y. Hwang and H. J. Choi, “Synthesis and Electrical Properties of Polymer Compo- sites with Polyaniline Nanoparticles,” Materials Science and Engineering: C, Vol. 24, 2004, pp. 15-18. doi:10.1016/j.msec.2003.09.003 [24] H.-J. Glasel, E. Hartmann and J. Hormes “Preparation of Barium Titanate Ultrafine Powders from a Monomeric Metallo-Organic Precursor by Combined Solid-State Po- lymerisation and Pyrolysis,” Journal of Materials Science, Vol. 34, 1999, pp. 1-5. doi:10.1023/A:1004533926099 [25] G. D. La Puente, G. Marban and E. Fuente, “Modelling of Volatile Product Evolution in Coal Pyrolysis. The Role of Aerial Oxidation,” Journal of Analytical and Applied Pyrolysis, Vol. 44, 1998, pp. 205-218. doi:10.1016/S0165-2370(97)00078-8 [26] A. Arenillas, F. Rubiera, J. J. Pis, M. J. Cuesta, M. J. Iglesias, A. Jimenez and I. Suarez-Ruiz, “Thermal Beha-  R. KHAN ET AL. Copyright © 2011 SciRes. ACES 44 viour during the Pyrolysis of Low Rank Perhydrous Coals,” Journal of Analytical and Applied Pyrolysis, Vol. 68-69, 2003, p. 371. doi:10.1016/S0165-2370(03)00031-7 [27] A. W. Coats and J. R. Redfern, “Kinetic Parameters from Thermogravimetric Data,” Nature, Vol. 201, 1964, pp. 68-69. doi:10.1038/201068a0 [28] M. V. Kok, E. Ozbas, O. Karacan and C. Hicyilmaz, “Effect of Particle Size on Coal Pyrolysis,” Journal of Analytical and Applied Pyrolysis, Vol. 45, 1998, pp. 103- 110. doi:10.1016/S0165-2370(98)00063-1 [29] P. R. Soloman, M. A. Serio, R. M. Carangelo and J. R. Markham, “Very Rapid Coal Pyrolysis,” Fuel, Vol. 65, 1986, pp. 182-194. doi:10.1016/0016-2361(86)90005-0 |