Paper Menu >>
Journal Menu >>
 J. Service Science & Management, 2009, 2: 71-79 Published Online June 2009 in SciRes (www.SciRP.org/journal/jssm) Copyright © 2009 SciRes JSSM Evaluation and Analysis: Development Trend of China’s Logistics Industry under Supply Chain Globalization Environments Juping Shao1,2, Tianyun Ma3, Shaohua Dong2, Xianghua Meng1 1School of Management, Ludong University, Yantai, Shandong Province, China; 2Department of Logistics Engineering, University of Science and Technology, Beijing, China; 3School of Civil Engineering, Ludong University, Yantai, Shandong Province, China. Email: wlustbshao@163.com, ytmty2477@126.com, dsh_dle@me.ustb.edu.cn, daitoue0279@vip.sina.com Received February 20th, 2009; revised April 21st, 2009; accepted May 25th, 2009. ABSTRACT First in this paper a systematic and comprehensive hybrid index evaluation system of regional logistics competitiveness is designed according to the characteristics of China’s regional logistics system under supply chain globalization envi- ronments, and systematic analysis and discussion of the connotation of the various factors in the index evaluation sys- tem are made. Then based on hierarchy analysis thought and fuzzy decision-making principles, the development trend of China’s regional logistics industry is assessed systematically and comprehensively. With the result of the above as- sessment, the key factors and the gradual evolution process of promoting regional logistics industry competitiveness under supply chain globalization environments are discussed. Also, in this paper it points out that enhancing the strength of urban logistic enterprises will promote the competitiveness of regional logistics industry. And the logistics competitiveness of a few major economic zones in China is discussed with conclusion that discrepancy exists in terms of China’s provincial capital city’s logistics development. At last, development strategies for regional logistics are put forward aimed at the west regions of China which have weak competitiveness in logistics industry. Keywords: supply chain globalization environment, regional logistics, developmental trend, evaluation and analysis 1. Introduction From the late 1990s, a new round of international indus- trial transfer, which is characterized by the transfer of manufacturing industry from developed countries to China as well as other eastern Asian countries, has been on the increase with the rise of knowledge economy and the acceleration of global economy. This has accelerated the globalization of supply chains, and hence has made regional logistics more demanding [1]. The level of lo- gistics industry development has become an important indicator, which is used to measure the quality of the regional investment environment, but also becomes an accelerator to the regional economy. To enhance the ca- pability of regional logistics system under supply chain globalization environments and to improve the invest- ment environment so that to attract more investment capital, each region should accelerate the construction of infrastructure investment, based on the scientific and rational planning of the regional logistics development, and integrate and optimize the traditional logistics indus- try and improve the concentration of regional logistics industry, which plays an important role in enhancing the regional comprehensive competitiveness and the sus- tainable development of regional economy under supply chain globalization environments. Based on the statistical data of China’s four munici- palities and 27 provincial capital cities related to the lo- gistics industry in 2007 and a tentative construction of the assessment index system for regional logistics de- velopment, applying the thought of hierarchy analysis [2] , fuzzy pattern recognition principles and fuzzy con- sistent judgment matrix [3,4,5,6], the article offers the hybrid index hierarchy fuzzy decision-making method to synthetically analyze and evaluate the development trend of Chinese regional logistics. 2. The Construction of Evaluation Index and the Data Standardization Processing 2.1 The Construction of Evaluation Index The competitiveness of area logistics is the joint force from the interplay of various factors. According to the 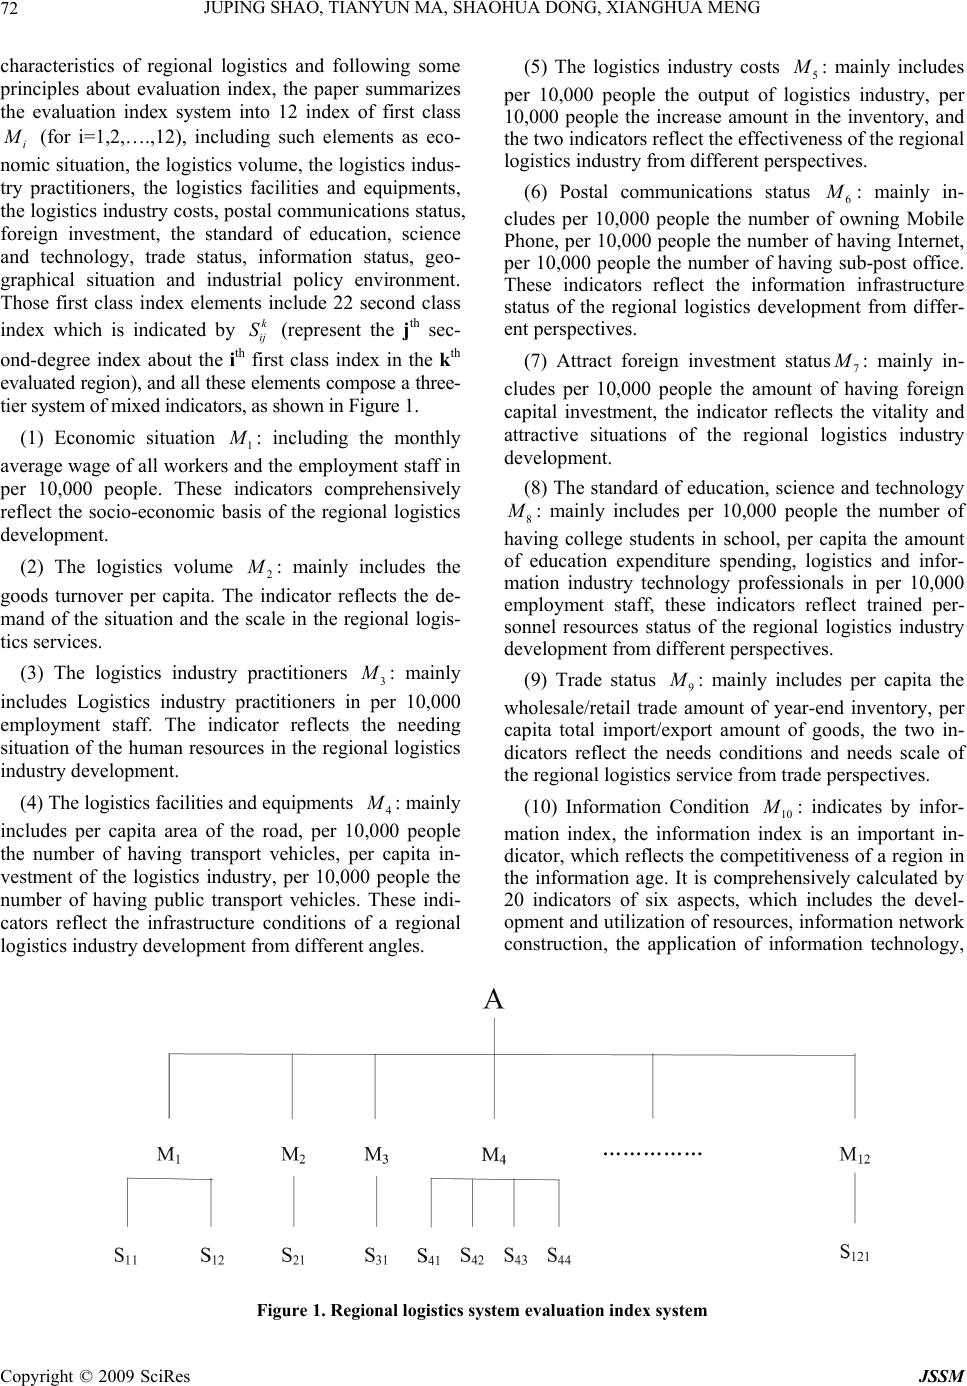 JUPING SHAO, TIANYUN MA, SHAOHUA DONG, XIANGHUA MENG 72 characteristics of regional logistics and following some principles about evaluation index, the paper summarizes the evaluation index system into 12 index of first class i M (for i=1,2,….,12), including such elements as eco- nomic situation, the logistics volume, the logistics indus- try practitioners, the logistics facilities and equipments, the logistics industry costs, postal communications status, foreign investment, the standard of education, science and technology, trade status, information status, geo- graphical situation and industrial policy environment. Those first class index elements include 22 second class index which is indicated by (represent the jth sec- ond-degree index about the ith first class index in the kth evaluated region), and all these elements compose a three- tier system of mixed indicators, as shown in Figure 1. k ij S (1) Economic situation 1 M : including the monthly average wage of all workers and the employment staff in per 10,000 people. These indicators comprehensively reflect the socio-economic basis of the regional logistics development. (2) The logistics volume 2 M : mainly includes the goods turnover per capita. The indicator reflects the de- mand of the situation and the scale in the regional logis- tics services. (3) The logistics industry practitioners 3 M : mainly includes Logistics industry practitioners in per 10,000 employment staff. The indicator reflects the needing situation of the human resources in the regional logistics industry development. (4) The logistics facilities and equipments 4 M : mainly includes per capita area of the road, per 10,000 people the number of having transport vehicles, per capita in- vestment of the logistics industry, per 10,000 people the number of having public transport vehicles. These indi- cators reflect the infrastructure conditions of a regional logistics industry development from different angles. (5) The logistics industry costs 5 M : mainly includes per 10,000 people the output of logistics industry, per 10,000 people the increase amount in the inventory, and the two indicators reflect the effectiveness of the regional logistics industry from different perspectives. (6) Postal communications status 6 M : mainly in- cludes per 10,000 people the number of owning Mobile Phone, per 10,000 people the number of having Internet, per 10,000 people the number of having sub-post office. These indicators reflect the information infrastructure status of the regional logistics development from differ- ent perspectives. (7) Attract foreign investment status7 M : mainly in- cludes per 10,000 people the amount of having foreign capital investment, the indicator reflects the vitality and attractive situations of the regional logistics industry development. (8) The standard of education, science and technology 8 M : mainly includes per 10,000 people the number of having college students in school, per capita the amount of education expenditure spending, logistics and infor- mation industry technology professionals in per 10,000 employment staff, these indicators reflect trained per- sonnel resources status of the regional logistics industry development from different perspectives. (9) Trade status 9 M : mainly includes per capita the wholesale/retail trade amount of year-end inventory, per capita total import/export amount of goods, the two in- dicators reflect the needs conditions and needs scale of the regional logistics service from trade perspectives. (10) Information Condition 10 M : indicates by infor- mation index, the information index is an important in- dicator, which reflects the competitiveness of a region in the information age. It is comprehensively calculated by 20 indicators of six aspects, which includes the devel- opment and utilization of resources, information network construction, the application of information technology, Figure 1. Regional logistics system evaluation index system Copyright © 2009 SciRes JSSM  JUPING SHAO, TIANYUN MA, SHAOHUA DONG, XIANGHUA MENG73 information products and services, information human resources and the development environment of informa- tion. (11) Geographical condition11 M : geographic location is obviously one of the important factors influencing the development of the logistics industry. (12) Industrial policy environment12 M : the local in- dustry system, industrial policies and market economy atmosphere and the idea and consciousness of the local people have a wide impact on the development of logis- tics industry, so industrial policy environment also af- fects the development of the logistics industry as one of the important factors. 2.2 Determine Evaluation Index Set According to AHP, Figure 1 shows the evaluation index system, which consists of the target layer A , middle layer (first class index) i M ,and the bottom layer (sec- ond-degree index) (represent the jth second-degree index about the ith first class index in the kth evaluated region). k ij S A is the set of first class index i M , of which the notation is . 12 , ,......,M M{AM } m i M (for i=1,2,…,m) is the set of second-degree index (for , and is the number of second-degree index in the ith first class index) , and use the set k ij S 1, 2, , i ..., i jn { i n ..., 12 ,... ii kk } in k i M SSSto represent. Then 1 m A Mi i , ij M Mij (1) , xy kk ijijx y SS jj 1, 2,...., x i jni n (2) 1, 2,...., y j 2.3 Handle the Mixed Indicator k ij S Let’s suppose that the number of evaluated region is n and the number of first class index is m. For an evaluated region k, () ij k f x () is the jth value of the second-degree index in the ith first class index 1, 2,,k k ij S n i M . Now define the target characteristic matrix of the ith first class index by (()) ij i k in Xfx n . We compute quantitative indexes by basic date. As for the qualitative index in the article, the set of fuzzy lan- guage is defined as, in which, EG=extremely good, VG=very good, G=good, F=fair, P=poor. The definite value is determined by experts giv- ing a mark according to actual circumstance. Fuzzy value is indicated with (0, 1). In the article, the “geo- graphic situation” and the “industrial policy environ- ment” are two qualitative indicators in first class index, and the definition of evaluation indicators for the as- sessment as VG value of 0.95, evaluation indicators as- sessed as G value 0.85, evaluation indicators assessed value of 0.75 for F and evaluation indicators for the as- sessment of P value was 0.65, for the VP to inform the evaluation index value of 0.55. The final value of each qualitative index is the average points of all the experts’ points. L = {EG,VG,G,F,P} 2.4 The Data Standardization Processing To eliminate the effect of different indexes unit, and to integrate quantitative indexes and qualitative indexes, we need to process all indexes data so that they are stan- dardization data. For each index, k ij S() ij k x is the standardization value of the jth second-degree index about the ith first class index in the kth evaluated region .When the index original data is () ij k f x, the definition of standardization value () ij k x is determined by the following equation () () () 1, 2,...., 1, 2,...., 1, 2,, ij ij ij kk k i f xfx xs im jn kn (3) In the equation, 2 1 (() ()) ij ij n kk k f xfx sn (4) 1 () () ij ij n k kk f x fx n (5) From Formula (3), the standardization evaluation ma- trix of all indexes is obtained. This is written as follows: (()) ij i k in Rx n . Applying Formulae (3), (4) and (5), the original data of China’s four municipalities and 27 province capital cities can be processed and standardized. The processing results are shown in Table 1. 3. Fuzzy Subset of Index Weight To avoid the problem of poor uniformity of judgment matrix in the process of computing weight in AHP, we use fuzzy consistent judgment matrix G which exist in fuzzy consistent relations to obtain weight. Suppose that Copyright © 2009 SciRes JSSM  JUPING SHAO, TIANYUN MA, SHAOHUA DONG, XIANGHUA MENG 74 Table 1. The results of data standardization processing Note: The source of statistical original data is rooted in the reference literature [7], [8] and [9] which were computed simply. Because there were a large number of statistical indexes and original data, but the paper length is limited, so only part of the results of data standardization proc- essing was shown in table1 in the article. i (for ) is first class indexes weight, and 1,...,im ij (for,and ) is second-degree index weight; We have 1, ..,im1, 2,....,i jn 1 j 11 1 i n m ii ij (6) Computing the index weight process is as follows: Step 1 Establish optimal choice relationship matrix () ii p qnn F The value of p q in this matrix separately is 0.5 (the importance of the two indexes is on the same level), 0.0 (one index is less importance than another), 1.0 (one index is more importance than another). The relative importance degree of the index is given by the experts beforehand. According to the relevant data and the experts’ judg- ment, establish the optimal choice relationship matrix F of the first class indexes are shown as follows: 0.511111111111 00.51011100000 000.5001100000 0110.511111111 00100.51100000 000000.5100000 0000000.500000 01101110.51111 011011100.5111 0110111000.500 01101110010.51 011011100100.5 F In addition, according to the actual situation of evalua- tion indexes design, the second class indexes which are related with a first class index are of same importance, that is, the value of p q in optimal choice relationship matrix () ii p qnn F is 0.5. Thus the optimal choice relationship matrix of the second class index is omitted. Step 2 Establish fuzzy consistent judgment matrix () ii p qnn Gr Region 11 12 21 31 41 42 43 44 ij Peking 2.29 0.70 -0.63 -0.21 0.36 0.09 -0.34 3.25 … Tianjin 0.91 -0.82 2.70 -0.19 -0.03 -0.38 -0.59 0.09 … Shanghai 2.70 -0.06 3.79 0.01 1.76 0.86 0.37 1.47 … Nanjing 0.30 1.29 0.09 -0.40 2.28 0.98 2.97 -0.31 … Hangzhou 1.47 0.20 0.24 -0.29 1.91 3.42 1.62 0.19 … Hefei -0.76 0.00 -0.15 -0.31 0.45 -0.99 -0.29 -0.49 … Fuzhou 0.01 -0.05 -0.21 -0.36 0.25 -0.82 -0.07 0.10 … Nanchang -0.77 -0.44 -0.46 -0.22 -0.35 -1.19 0.25 -0.39 … Jinan -0.35 2.15 1.27 -0.36 0.82 -0.27 0.05 -0.73 … Zhengzhou -0.72 1.76 0.16 -0.31 -0.37 -1.17 1.51 -0.43 … Wuhan -0.74 0.75 -0.21 -0.18 -0.06 -0.88 0.56 -0.39 … Changsha -0.42 0.24 -0.14 0.58 -0.47 -0.98 0.33 -0.25 … Guangzhou 1.19 2.16 0.85 -0.24 0.20 0.34 2.51 -0.70 … Chongqing -0.38 -0.73 -0.68 -0.12 -1.47 0.64 -0.66 -0.50 k … … … … … … … … … Copyright © 2009 SciRes JSSM 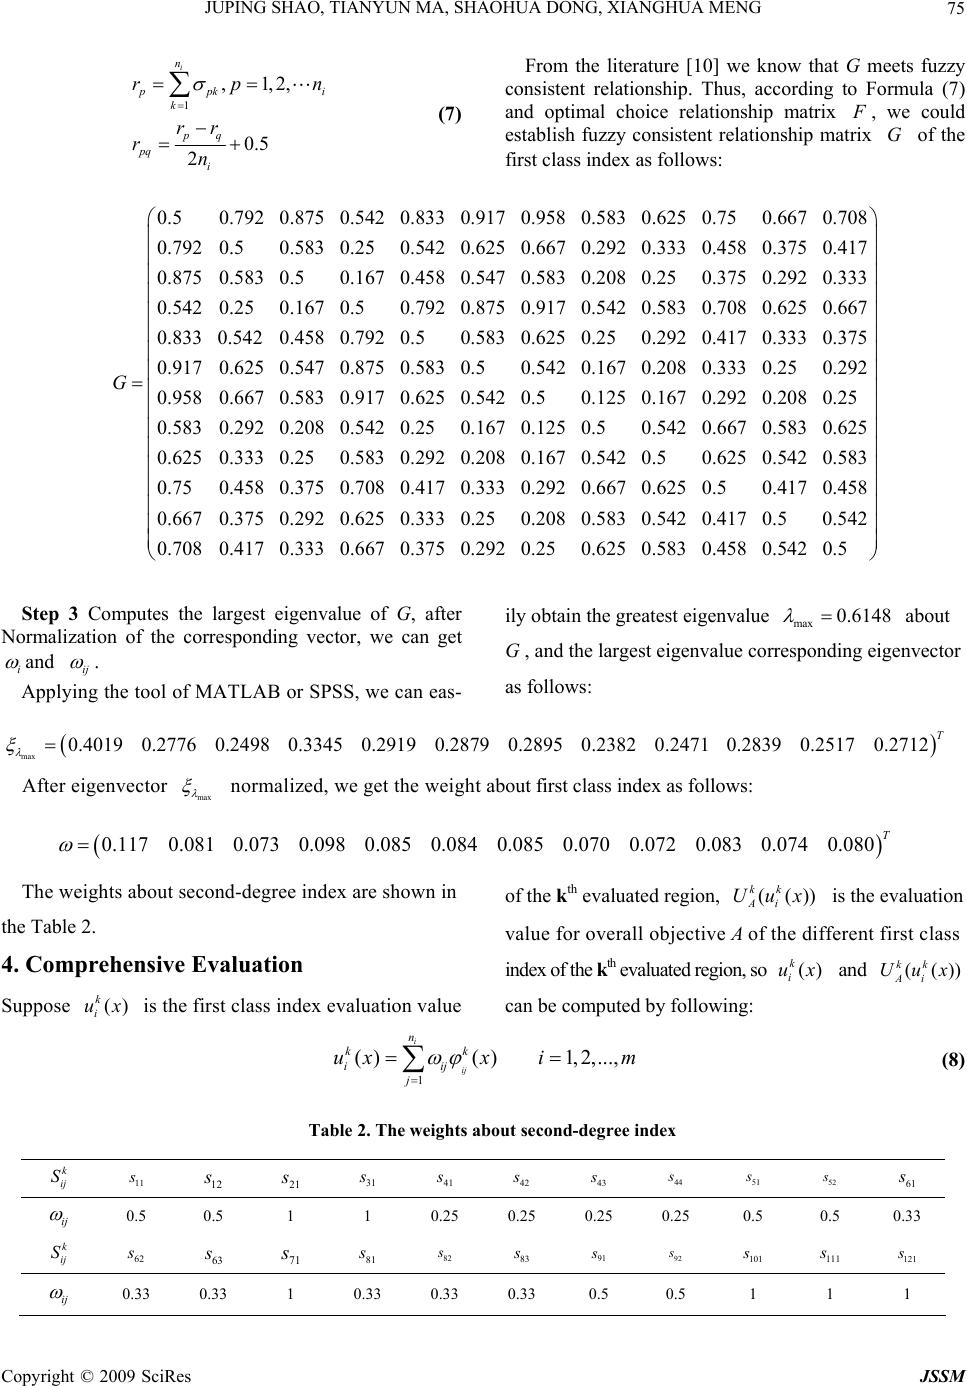 JUPING SHAO, TIANYUN MA, SHAOHUA DONG, XIANGHUA MENG75 1 ,1,2, 0.5 2 i n p pk i k pq pq i rp rr rn From the literature [10] we know that G meets fuzzy consistent relationship. Thus, according to Formula (7) and optimal choice relationship matrix F , we could establish fuzzy consistent relationship matrix of the first class index as follows: G n (7) 0.50.792 0.875 0.542 0.8330.917 0.9580.583 0.6250.750.667 0.708 0.7920.50.583 0.250.542 0.6250.667 0.292 0.3330.458 0.375 0.417 0.8750.583 0.50.167 0.458 0.5470.5830.208 0.250.375 0.292 0.333 0.5420.250.167 0.50.7920.875 G 0.9170.542 0.5830.708 0.625 0.667 0.833 0.5420.4580.7920.50.5830.6250.250.2920.4170.3330.375 0.9170.625 0.5470.875 0.5830.50.542 0.1670.2080.333 0.250.292 0.9580.667 0.5830.917 0.6250.542 0.50.1250.1670.292 0.2080.25 0.5830.292 0.2080.542 0.250.167 0.1250.50.5420.667 0.5830.625 0.6250.333 0.250.583 0.292 0.2080.1670.542 0.50.6250.542 0.583 0.750.4580.375 0.708 0.4170.333 0.2920.667 0.6250.50.4170.458 0.6670.375 0.2920.625 0.333 0.250.2080.583 0.5420.417 0.50.542 0.7080.417 0.3330.667 0.3750.292 0.250.625 0.5830.458 0.542 0.5 Step 3 Computes the largest eigenvalue of G, after Normalization of the corresponding vector, we can get i and ij . Applying the tool of MATLAB or SPSS, we can eas- ily obtain the greatest eigenvalue max 0.6148 about G , and the largest eigenvalue corresponding eigenvector as follows: max 0.40190.27760.24980.33450.29190.28790.28950.23820.24710.28390.25170.2712 T After eigenvector max normalized, we get the weight about first class index as follows: 0.1170.081 0.0730.0980.0850.0840.0850.0700.0720.0830.0740.080 T The weights about second-degree index are shown in the Table 2. 4. Comprehensive Evaluation Suppose is the first class index evaluation value () k i ux of the kth evaluated region, is the evaluation (()) kk Ai Uux value for overall objective A of the different first class index of the kth evaluated region, so and () k i ux (()) kk Ai Uux can be computed by following: 1 ( )( )1,2,..., i ij n kk iij j uxx im (8) Table 2. The weights about second-degree index k ij S 11 s 12 s 21 s 31 s 41 s 42 s 43 s 44 s 51 s 52 s 61 s ij 0.5 0.5 1 1 0.25 0.25 0.25 0.25 0.5 0.5 0.33 k ij S 62 s 63 s 71 s 81 s 82 s 83 s 91 s 92 s 101 s 111 s 121 s ij 0.33 0.33 1 0.33 0.33 0.33 0.5 0.5 1 1 1 Copyright © 2009 SciRes JSSM 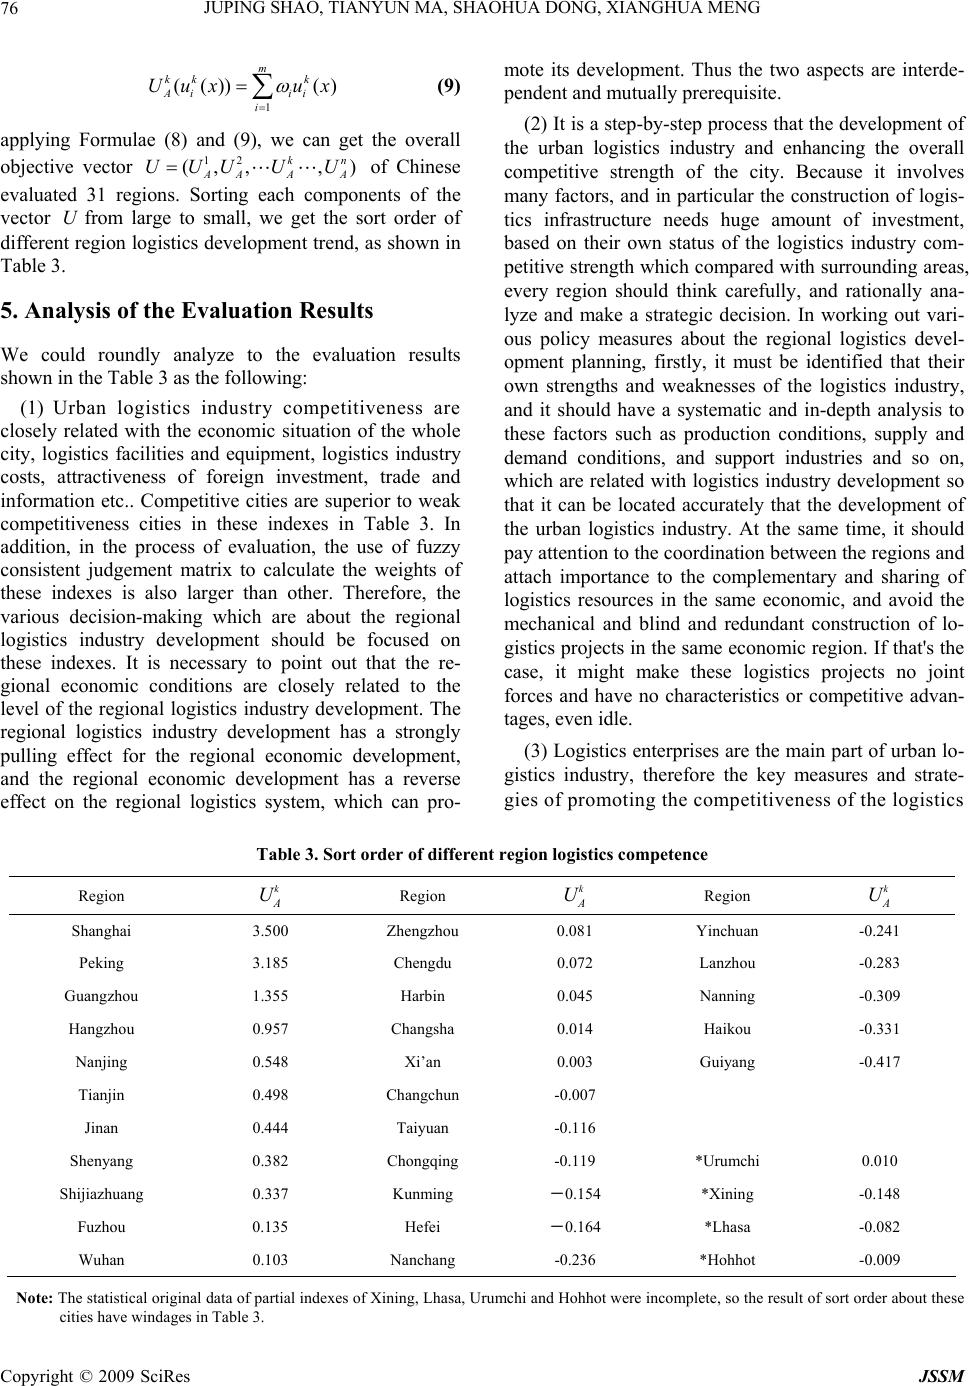 JUPING SHAO, TIANYUN MA, SHAOHUA DONG, XIANGHUA MENG 76 1 (()) () m kk k Ai ii i Uux ux (9) applying Formulae (8) and (9), we can get the overall objective vector of Chinese evaluated 31 regions. Sorting each components of the vector from large to small, we get the sort order of different region logistics development trend, as shown in Table 3. 12 (,, ,) k AA AA UUUUU n U 5. Analysis of the Evaluation Results We could roundly analyze to the evaluation results shown in the Table 3 as the following: (1) Urban logistics industry competitiveness are closely related with the economic situation of the whole city, logistics facilities and equipment, logistics industry costs, attractiveness of foreign investment, trade and information etc.. Competitive cities are superior to weak competitiveness cities in these indexes in Table 3. In addition, in the process of evaluation, the use of fuzzy consistent judgement matrix to calculate the weights of these indexes is also larger than other. Therefore, the various decision-making which are about the regional logistics industry development should be focused on these indexes. It is necessary to point out that the re- gional economic conditions are closely related to the level of the regional logistics industry development. The regional logistics industry development has a strongly pulling effect for the regional economic development, and the regional economic development has a reverse effect on the regional logistics system, which can pro- mote its development. Thus the two aspects are interde- pendent and mutually prerequisite. (2) It is a step-by-step process that the development of the urban logistics industry and enhancing the overall competitive strength of the city. Because it involves many factors, and in particular the construction of logis- tics infrastructure needs huge amount of investment, based on their own status of the logistics industry com- petitive strength which compared with surrounding areas, every region should think carefully, and rationally ana- lyze and make a strategic decision. In working out vari- ous policy measures about the regional logistics devel- opment planning, firstly, it must be identified that their own strengths and weaknesses of the logistics industry, and it should have a systematic and in-depth analysis to these factors such as production conditions, supply and demand conditions, and support industries and so on, which are related with logistics industry development so that it can be located accurately that the development of the urban logistics industry. At the same time, it should pay attention to the coordination between the regions and attach importance to the complementary and sharing of logistics resources in the same economic, and avoid the mechanical and blind and redundant construction of lo- gistics projects in the same economic region. If that's the case, it might make these logistics projects no joint forces and have no characteristics or competitive advan- tages, even idle. (3) Logistics enterprises are the main part of urban lo- gistics industry, therefore the key measures and strate- gies of promoting the competitiveness of the logistics Table 3. Sort order of different region logistics competence Region k A U Region k A U Region k A U Shanghai 3.500 Zhengzhou 0.081 Yinchuan -0.241 Peking 3.185 Chengdu 0.072 Lanzhou -0.283 Guangzhou 1.355 Harbin 0.045 Nanning -0.309 Hangzhou 0.957 Changsha 0.014 Haikou -0.331 Nanjing 0.548 Xi’an 0.003 Guiyang -0.417 Tianjin 0.498 Changchun -0.007 Jinan 0.444 Taiyuan -0.116 Shenyang 0.382 Chongqing -0.119 *Urumchi 0.010 Shijiazhuang 0.337 Kunming -0.154 *Xining -0.148 Fuzhou 0.135 Hefei -0.164 *Lhasa -0.082 Wuhan 0.103 Nanchang -0.236 *Hohhot -0.009 Note: The statistical original data of partial indexes of Xining, Lhasa, Urumchi and Hohhot were incomplete, so the result of sort order about these cities have windages in Table 3. Copyright © 2009 SciRes JSSM 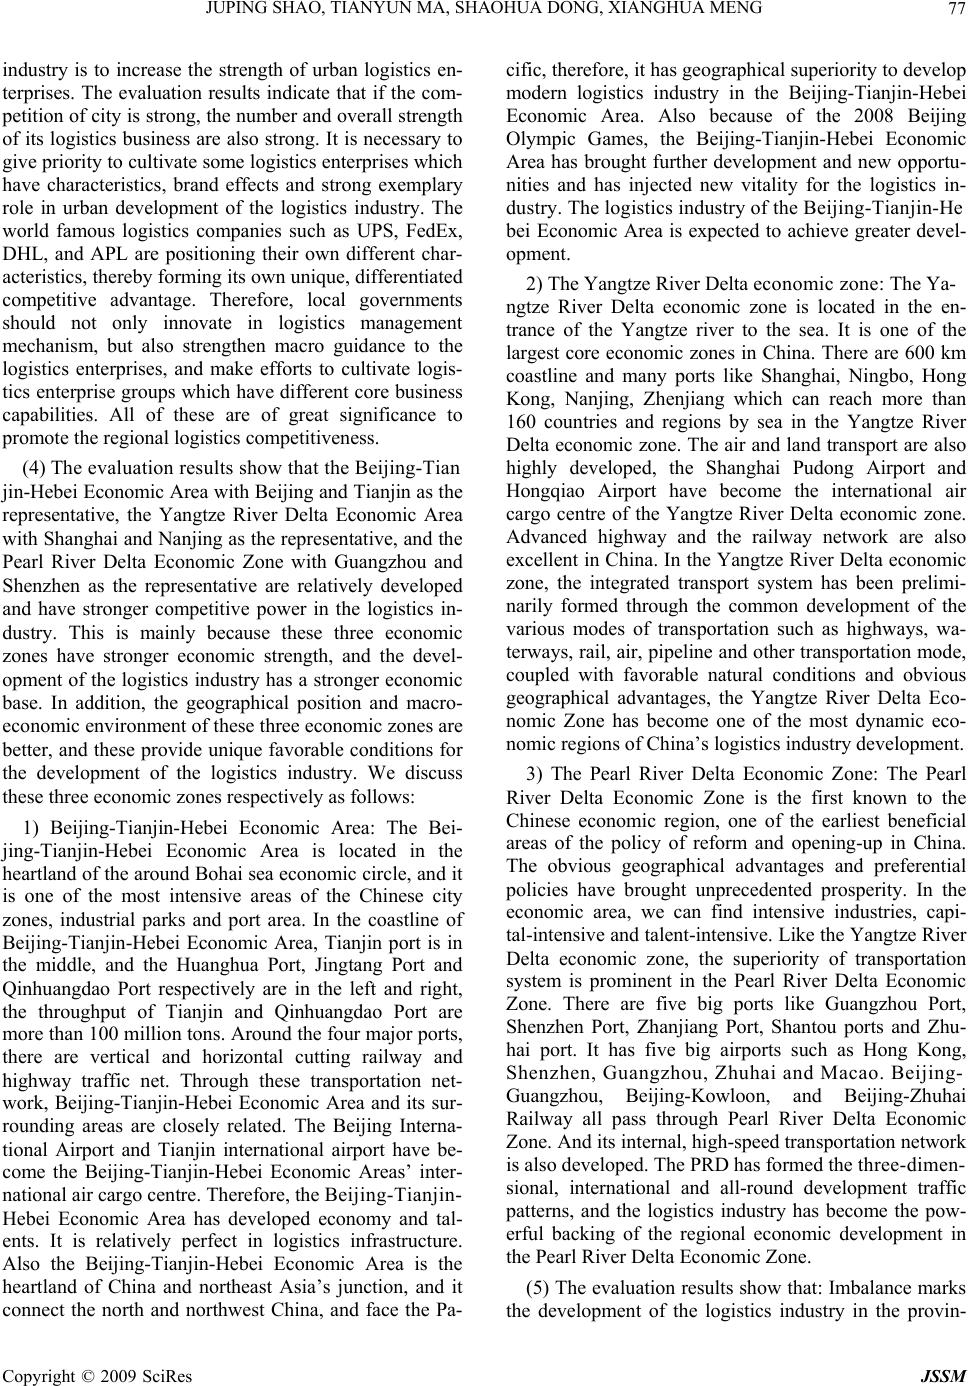 JUPING SHAO, TIANYUN MA, SHAOHUA DONG, XIANGHUA MENG77 industry is to increase the strength of urban logistics en- terprises. The evaluation results indicate that if the com- petition of city is strong, the number and overall strength of its logistics business are also strong. It is necessary to give priority to cultivate some logistics enterprises which have characteristics, brand effects and strong exemplary role in urban development of the logistics industry. The world famous logistics companies such as UPS, FedEx, DHL, and APL are positioning their own different char- acteristics, thereby forming its own unique, differentiated competitive advantage. Therefore, local governments should not only innovate in logistics management mechanism, but also strengthen macro guidance to the logistics enterprises, and make efforts to cultivate logis- tics enterprise groups which have different core business capabilities. All of these are of great significance to promote the regional logistics competitiveness. (4) The evaluation results show that the Beijing-Tian jin-Hebei Economic Area with Beijing and Tianjin as the representative, the Yangtze River Delta Economic Area with Shanghai and Nanjing as the representative, and the Pearl River Delta Economic Zone with Guangzhou and Shenzhen as the representative are relatively developed and have stronger competitive power in the logistics in- dustry. This is mainly because these three economic zones have stronger economic strength, and the devel- opment of the logistics industry has a stronger economic base. In addition, the geographical position and macro- economic environment of these three economic zones are better, and these provide unique favorable conditions for the development of the logistics industry. We discuss these three economic zones respectively as follows: 1) Beijing-Tianjin-Hebei Economic Area: The Bei- jing-Tianjin-Hebei Economic Area is located in the heartland of the around Bohai sea economic circle, and it is one of the most intensive areas of the Chinese city zones, industrial parks and port area. In the coastline of Beijing-Tianjin-Hebei Economic Area, Tianjin port is in the middle, and the Huanghua Port, Jingtang Port and Qinhuangdao Port respectively are in the left and right, the throughput of Tianjin and Qinhuangdao Port are more than 100 million tons. Around the four major ports, there are vertical and horizontal cutting railway and highway traffic net. Through these transportation net- work, Beijing-Tianjin-Hebei Economic Area and its sur- rounding areas are closely related. The Beijing Interna- tional Airport and Tianjin international airport have be- come the Beijing-Tianjin-Hebei Economic Areas’ inter- national air cargo centre. Therefore, the Beijing-Tianjin- Hebei Economic Area has developed economy and tal- ents. It is relatively perfect in logistics infrastructure. Also the Beijing-Tianjin-Hebei Economic Area is the heartland of China and northeast Asia’s junction, and it connect the north and northwest China, and face the Pa- cific, therefore, it has geographical superiority to develop modern logistics industry in the Beijing-Tianjin-Hebei Economic Area. Also because of the 2008 Beijing Olympic Games, the Beijing-Tianjin-Hebei Economic Area has brought further development and new opportu- nities and has injected new vitality for the logistics in- dustry. The logistics industry of the Beijing-Tianjin-He bei Economic Area is expected to achieve greater devel- opment. 2) The Yangtze River Delta economic zone: The Ya- ngtze River Delta economic zone is located in the en- trance of the Yangtze river to the sea. It is one of the largest core economic zones in China. There are 600 km coastline and many ports like Shanghai, Ningbo, Hong Kong, Nanjing, Zhenjiang which can reach more than 160 countries and regions by sea in the Yangtze River Delta economic zone. The air and land transport are also highly developed, the Shanghai Pudong Airport and Hongqiao Airport have become the international air cargo centre of the Yangtze River Delta economic zone. Advanced highway and the railway network are also excellent in China. In the Yangtze River Delta economic zone, the integrated transport system has been prelimi- narily formed through the common development of the various modes of transportation such as highways, wa- terways, rail, air, pipeline and other transportation mode, coupled with favorable natural conditions and obvious geographical advantages, the Yangtze River Delta Eco- nomic Zone has become one of the most dynamic eco- nomic regions of China’s logistics industry development. 3) The Pearl River Delta Economic Zone: The Pearl River Delta Economic Zone is the first known to the Chinese economic region, one of the earliest beneficial areas of the policy of reform and opening-up in China. The obvious geographical advantages and preferential policies have brought unprecedented prosperity. In the economic area, we can find intensive industries, capi- tal-intensive and talent-intensive. Like the Yangtze River Delta economic zone, the superiority of transportation system is prominent in the Pearl River Delta Economic Zone. There are five big ports like Guangzhou Port, Shenzhen Port, Zhanjiang Port, Shantou ports and Zhu- hai port. It has five big airports such as Hong Kong, Shenzhen, Guangzhou, Zhuhai and Macao. Beijing- Guangzhou, Beijing-Kowloon, and Beijing-Zhuhai Railway all pass through Pearl River Delta Economic Zone. And its internal, high-speed transportation network is also developed. The PRD has formed the three-dimen- sional, international and all-round development traffic patterns, and the logistics industry has become the pow- erful backing of the regional economic development in the Pearl River Delta Economic Zone. (5) The evaluation results show that: Imbalance marks the development of the logistics industry in the provin- Copyright © 2009 SciRes JSSM 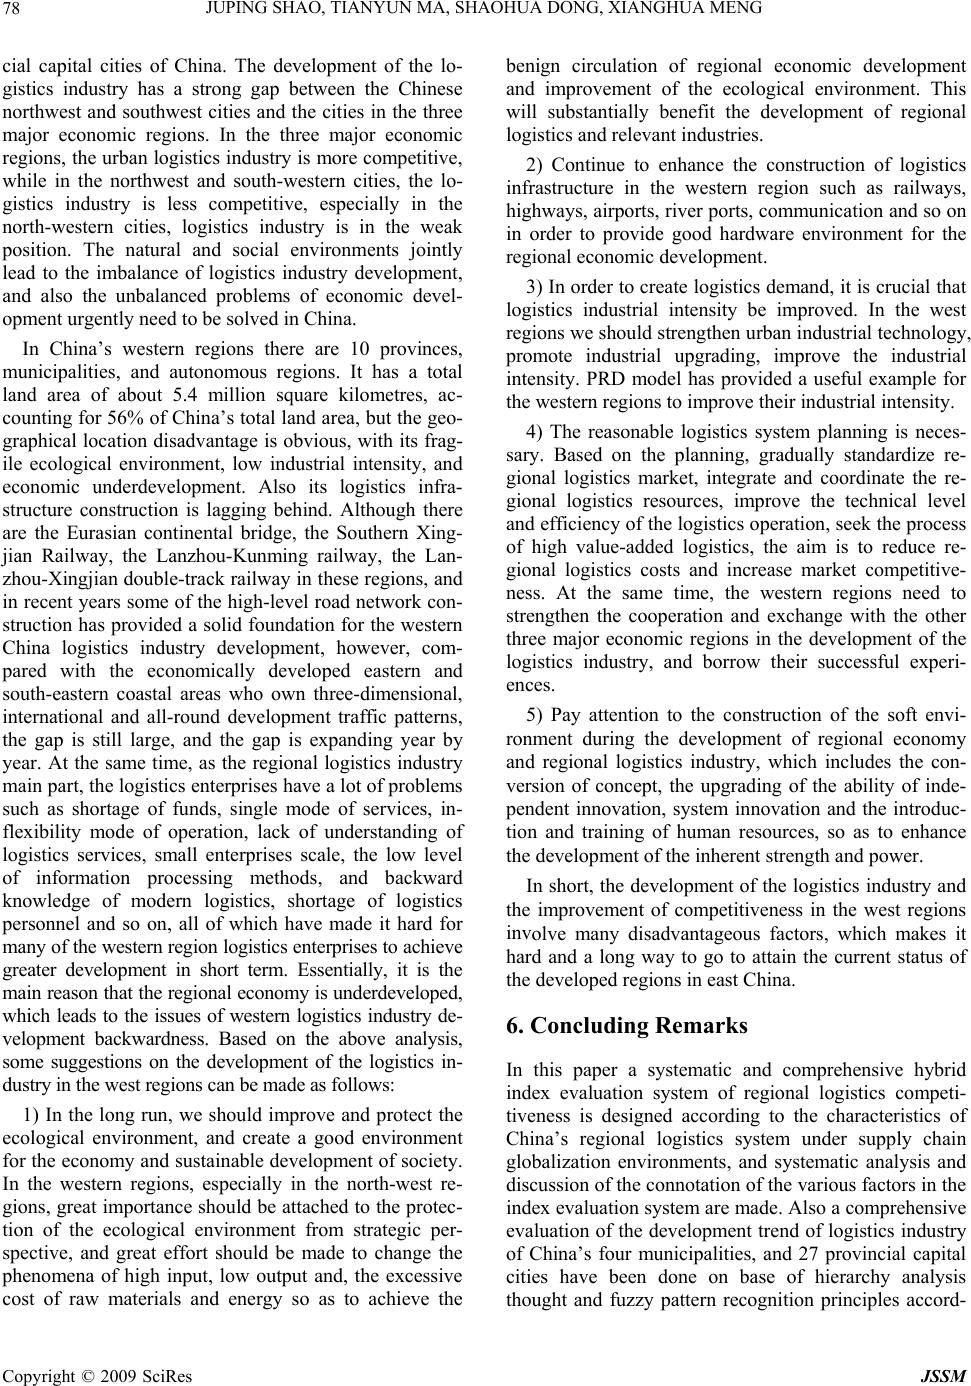 JUPING SHAO, TIANYUN MA, SHAOHUA DONG, XIANGHUA MENG 78 cial capital cities of China. The development of the lo- gistics industry has a strong gap between the Chinese northwest and southwest cities and the cities in the three major economic regions. In the three major economic regions, the urban logistics industry is more competitive, while in the northwest and south-western cities, the lo- gistics industry is less competitive, especially in the north-western cities, logistics industry is in the weak position. The natural and social environments jointly lead to the imbalance of logistics industry development, and also the unbalanced problems of economic devel- opment urgently need to be solved in China. In China’s western regions there are 10 provinces, municipalities, and autonomous regions. It has a total land area of about 5.4 million square kilometres, ac- counting for 56% of China’s total land area, but the geo- graphical location disadvantage is obvious, with its frag- ile ecological environment, low industrial intensity, and economic underdevelopment. Also its logistics infra- structure construction is lagging behind. Although there are the Eurasian continental bridge, the Southern Xing- jian Railway, the Lanzhou-Kunming railway, the Lan- zhou-Xingjian double-track railway in these regions, and in recent years some of the high-level road network con- struction has provided a solid foundation for the western China logistics industry development, however, com- pared with the economically developed eastern and south-eastern coastal areas who own three-dimensional, international and all-round development traffic patterns, the gap is still large, and the gap is expanding year by year. At the same time, as the regional logistics industry main part, the logistics enterprises have a lot of problems such as shortage of funds, single mode of services, in- flexibility mode of operation, lack of understanding of logistics services, small enterprises scale, the low level of information processing methods, and backward knowledge of modern logistics, shortage of logistics personnel and so on, all of which have made it hard for many of the western region logistics enterprises to achieve greater development in short term. Essentially, it is the main reason that the regional economy is underdeveloped, which leads to the issues of western logistics industry de- velopment backwardness. Based on the above analysis, some suggestions on the development of the logistics in- dustry in the west regions can be made as follows: 1) In the long run, we should improve and protect the ecological environment, and create a good environment for the economy and sustainable development of society. In the western regions, especially in the north-west re- gions, great importance should be attached to the protec- tion of the ecological environment from strategic per- spective, and great effort should be made to change the phenomena of high input, low output and, the excessive cost of raw materials and energy so as to achieve the benign circulation of regional economic development and improvement of the ecological environment. This will substantially benefit the development of regional logistics and relevant industries. 2) Continue to enhance the construction of logistics infrastructure in the western region such as railways, highways, airports, river ports, communication and so on in order to provide good hardware environment for the regional economic development. 3) In order to create logistics demand, it is crucial that logistics industrial intensity be improved. In the west regions we should strengthen urban industrial technology, promote industrial upgrading, improve the industrial intensity. PRD model has provided a useful example for the western regions to improve their industrial intensity. 4) The reasonable logistics system planning is neces- sary. Based on the planning, gradually standardize re- gional logistics market, integrate and coordinate the re- gional logistics resources, improve the technical level and efficiency of the logistics operation, seek the process of high value-added logistics, the aim is to reduce re- gional logistics costs and increase market competitive- ness. At the same time, the western regions need to strengthen the cooperation and exchange with the other three major economic regions in the development of the logistics industry, and borrow their successful experi- ences. 5) Pay attention to the construction of the soft envi- ronment during the development of regional economy and regional logistics industry, which includes the con- version of concept, the upgrading of the ability of inde- pendent innovation, system innovation and the introduc- tion and training of human resources, so as to enhance the development of the inherent strength and power. In short, the development of the logistics industry and the improvement of competitiveness in the west regions involve many disadvantageous factors, which makes it hard and a long way to go to attain the current status of the developed regions in east China. 6. Concluding Remarks In this paper a systematic and comprehensive hybrid index evaluation system of regional logistics competi- tiveness is designed according to the characteristics of China’s regional logistics system under supply chain globalization environments, and systematic analysis and discussion of the connotation of the various factors in the index evaluation system are made. Also a comprehensive evaluation of the development trend of logistics industry of China’s four municipalities, and 27 provincial capital cities have been done on base of hierarchy analysis thought and fuzzy pattern recognition principles accord- Copyright © 2009 SciRes JSSM  JUPING SHAO, TIANYUN MA, SHAOHUA DONG, XIANGHUA MENG Copyright © 2009 SciRes JSSM 79 ing to 2007 Statistical Yearbook of the National Bureau of Statistics data. The results showed that: 1) Urban logistics industry competitiveness is close- ly related with the economic situation of the whole city, logistics facilities and equipment, logistics industry costs, attractiveness of foreign investment, trade and informa- tion etc. 2) Overall, the regional logistics industry in China has made gratifying development in recent years, but the development level of logistics industry in the provincial capital cities in China remain seriously unbalanced. The Beijing-Tianjin-Hebei Economic Area with Beijing and Tianjin as the representative, the Yangtze River Delta Economic Area with Shanghai and Nanjing as the repre- sentative, and the Pearl River Delta Economic Zone with Guangzhou and Shenzhen as the representative are rela- tively developed and have stronger competitive power in the logistics industry, but in the cities in northwest and southwest regions, the logistics industry is less competi- tive. And especially in those cities in the northwest re- gions, logistics industry is in the weakest position. 3) The regional economic development is increasingly dependent on the development level of the regional lo- gistics industry system. To enhance the competitiveness of the regional logistics industry has an important strate- gic significance for improving the ability to cope with the rising cost and boosting the regional economic de- velopment. 7. Acknowledgement The authors would like to thank the referees for their helpful suggestions. This research works was supported by the Natural Science Foundation of Shandong Prov. China under Grant No.Y2008H08 and the Soft Science Foundation of Shandong Prov. China named Logistics Service Innovation Tactics and Pattern of Productive Service Enterprise and the Dr Foundation of Shandong Prov. China under Grant No. 2008BS014 and the Excel- lent Teachers of General Institutions of Higher Learning of shandong province international cooperation training Program and the Innovative Team Construction of Lu- dong University under Grant No.22480301. REFERENCES [1] D. Simchi-Levi, P. Kaminsky, and E. Simchi-Levi, “De- signing and managing the supply chain,” Irwin/McGraw- Hill: San Francisco, 2003. [2] T. L. Saaty, “Multicriteria decision making: The analytic hierarchy process [M],” Pittsburgh, PA: RWS Publications, 1988. [3] B. Q. Hu, “Fuzzy theoretical basis (in Chinese),” Wuhan: Wuhan University Press, 2004. [4] J. J. Xie and C. P. Liu, “Fuzzy mathematics method and application,” Wuhan: Huazhong University of Science and Technology Press, 2000. [5] L. A. Zadeh, “Fuzzy sets,” Information and Control, No. 8, pp. 338-353, 1965. [6] R. Bellman and L. A. Zadeh, “Decision making in a fuzzy environment,” Management Science, No. 17, pp. 141-161, 1970. [7] National Bureau of Statistics of China, “China statistical summary in 2007 (in Chinese),” Peking: Statistics of China Press, 2007. [8] China Economic Prosperity Monitoring Center, “2006- 2007 national economic and social development statistical data compilation,” Beijing: China Statistics Press, May 2007. [9] National Bureau of Statistics of China, “China Statistical Yearbook in 2007 (in Chinese),” Peking: Statistics of China Press, 2007. [10] L. S. Li and K. K. Lai, “Fuzzy dynamic programming approach to hybrid multiobjective multistage deci- sion-making problems [J],” Fuzzy Sets and Systems, No. 117, 2001. |