 Journal of Power and Energy Engineering, 2014, 2, 718-728 Published Online April 2014 in SciRes. http://www.scirp.org/journal/jpee http://dx.doi.org/10.4236/jpee.2014.24096 How to cite this paper: Bazyari, S., et al. (2014) A Study on the Effects of Solar Tracking Systems on the Performance of Photovoltaic Power Plants. Journal of Power and Energy Engineering, 2, 718-728. http://dx.doi.org/10.4236/jpee.2014.24096 A Study on the Effects of Solar Tracking Systems on the Performance of Photovoltaic Power Plants Shahriar Bazyari1, Reza Keypour1, Shahrokh Farhangi2, Amir Ghaedi3, Khashayar Bazy ari4 1Semnan University, Semnan, Iran 2University of Tehran, Tehran, Iran 3Darun Branch, Islamic Azad University, Shiraz, Iran 4Sharif University of Technology, Tehran, Iran Email: shahriar.bazyari@gmail.com, reza.keypour@gmail.com, farhangi@ut.ac.ir, amir_ghaedi_63@yahoo.com, khashayarbazyari@yahoo.com Received Dec emb er 2013 Abstract The use of renewable energy resources to produce the electricity is a rising trend in various coun- tries worldwide. This is especially because these energies do not produce the greenhouse gases; therefore, don’t become a destructive factor on the ozone layer and the environment. Besides, the fossil energies are always exposed to price changes and will eventually end, while the renewable energies don’t pose such problems and are freely acquired from the nature. Some of the most im- portant of these reproducible energy resources are the energies of the wind and the solar energy. The generation capability of a photovoltaic power plant is largely dependent on the intensity of the sun radiation. On the other hand, the changing of position causes the sun to have a variable shining intensity in different seasons and different times of the year; therefore, some of the solar power plants possess solar tacking systems. This paper studies the different types of photovoltaic systems including fixed panel, photovoltaic farms equipped to the single axis and double axis tracking systems and their effects on the performance of the solar power plants. In order to de- termine the position of the sun in the sky, the zenith and azimuth angles of it are used to extract the relations between the different parameters of the sun radiation. The resulted parameters are used in the modeling of the single axis and double axis systems. In the paper it is utilized from the sun parameters in Qeshm Island of Iran in the summer of 2011. Keywords Azimuth and Zenith Angles; Photovoltaic Farm; Single and Double Axis Sun Tracker Systems 1. Introduction In the recent years, the use of renewable energy resources, specially sun and wind for the production of electric-  S. Bazyari et al. ity has had an increasing trend. The placement of these energies in the class of green energies is one of the fac- tors increasing their presence in the power networks, in a way that within the recent two years, the utilizations of some photovoltaic power plants with high capacities has begun. From some power plants, it can be pointed the 124 Megawatt “Charenka” power plant in India and the 200 Megawatt “Yuma” power plant in the United States which have started their activities in 2012 [1]. The investment and installment cost of the necessary tools and devices makes the energy produced in such power plants relatively expensive. Since the power generation capa- bility of such systems is dependent on the sun radiation received by the panels, a tracking system that momenta- rily positions these panels plumbing to the direction of the sun rays is very helpful in maximizing their perfor- mance. The angle of the sun differs between different hours of the day and the various seasons of a year and for this reason, some photovoltaic power plants use solar tracking systems to maintain a high level of efficiency. Such systems increase the production rate of the plants compared to those lacking this technology. Figure 1 shows that 27% of the photovoltaic power plants worldwide possess the solar tracking systems [2]. So far, many studies have been conducted on the effect of solar tracking systems on solar power plants. The reference [3] studies a 14 Megawatt solar farm located in “Las Vegas” that uses a solar tracking system. In this paper, the effects of the accessibility of the related components, the single axis tracker and climate changes on this farm have been studied. The reference [4] shows an optimized design for a photovoltaic plant with a tracking system. By adding a mechanical tracking system to the power plant, the output power has increased. But, on the other hand, this sys- tem consumes some of the produced power. The paper studies a photovoltaic system including a tracking system and an energy saving battery and attempts to provide an optimized method to find the appropriate parameters for the design. The parameters meant to be considered the efficiency of the photovoltaic panel, the size of the me- chanical system and the control system that aims to maximize the output power while minimizing the power consumption of the tracking system. The reference [5] shows two photovoltaic power plants connected to the power grid. the first one uses single axis tracking systems and is located in the “Saluzzo” area, while the second uses double axis systems and is located in “Naples, Italy”. The results of this study reveal that although the system located in “Naples” produces a higher output power due to the higher intensity of the sun radiation in that area and the use of a double axis tracking system, the costs of maintenance and installation makes it eco- nomically less efficient. In [6], the sun’s position during different days of a year is determined so that a solar tracking system can be modeled by using of the zenith and azimuth angles of the sun. In [7] a maximum power point tracker system based on the sensitive resistors is designed. These resistors are sensitive to the cadmium sulfide arrays and the fuzzy algorithm is employed for maximum power point tracking. In [8] the sun radiation angle associated to the different hours of the year is determined based on the latitude and longitude of the cor- responding area and the panels are arranged based on these angles in different hours through two tracking sys- tem; north to south and also east to west tracking systems. This study uses the sun radiation data in “Qeshm” island and its azimuth and zenith angles in the year 2011. This paper is organized as below. In the 2nd part, different photovoltaic systems with fixed panels and single axis or double axis solar tracking systems are studied. The 3rd part is dedicated to the position of the sun and how its azimuth and zenith angle changes within the time. In the 4th part, the relations between the different parameters of sun radiation are ex- tracted and used as a basis to investigate the function of single axis and double axis solar trackers in part 5. Fi- nally, the 6th part concludes the study. Figure 1. Penetration level of fixed panels and equipped to the sun tracker solar farms.  S. Bazyari et al. 2. Various Types of the Photovoltaic Systems A solar cell is in fact a p-n junction that produces DC electricity power by absorbing the sun radiation. Since the resulting voltage and output of a single cell is small, a number of these cells are linked together in serial and pa- rallel orders and constitute a solar panel. The current-voltage and power-current characteristic of solar panel are respectively presented in the Figure 2 and Figure 3. As seen in the figures, there is a peak point for the power of the solar panel which is called the maximum power point (MMP). A DC to DC converter is connected to the panels and adjusts the voltage and the current in a way that the panel works within this point. This converter is called the maximum power point tracker (MPPT) and also adjusts the output voltage of the panel. The structure with a MPPT that is connected to a series of panels is called a sub-array. An inverter is utilized to connect the photovoltaic system to the power network and also the AC quantities. Several sub arrays are connected to an inverter and forming a structure named an array. A photovoltaic power plant is also made up of number parallel arrays. Figure 4 shows the structure of a typical photovoltaic power plant [9]. The generated power of a photovoltaic system is based on the amount of the sun radiation received by the pa- nels and since the shining angle varies with days and seasons, some of such power plants use solar trackers ad- justing the panels’ perpendicular to the direction of the sun radiation. In this sense, there are three types of pho- tovoltaic systems namely as: fixed panel system, single axis system and double axis system. Figure 2. Current-Voltage characteris- tic of a typical solar panel. Figure 3. Current-Power characteristic of a typical solar panel. Figure 4. The components of a typical photovoltaic farm.  S. Bazyari et al. 2.1. Fixed Panel Photovoltaic Systems In this type of systems, the panels are positioned with a tilt angle that in the northern hemisphere is faced southward and their position cannot be changed during the day. Of course, it’s possible to change their angular position in different seasons in order to acquire an optimized output. 2.2. Photovoltaic Farm Equipped to the Single Axis Tracker In this type of systems, it’s possible to move the panels on a single path which is usually an east-west direction. During the day, the sun rises from east and sets in the west. In such systems, the panel moves in accordance with the sun’s movement and attempts to stay perpendicular to the angle of the sun rays. But the sun also moves in a nort h-south path. The Figure 5 shows the sun’s movements within a year. In the single axis systems located in the northern hemisphere, the panel is faced southward with an appropriate angle and so as shown in Figure 5, cannot always stay perpendicular to the direction of the sun radiation. Therefore, the double axis trackers are used for maximizing the reception of the sun radiation. 2.3. Photovoltaic Farm Equipped to the Double Axis Tracker In such systems, the panels are able to move along both east-west and north-south directions; therefore, they are always perpendicular to the sun radiation’s direction and receive the maximum amount of the sunray. There are two methods to determine the angle of the panels at every moment. In some of the trackers, there is a pair of optical sensors that in case the panel is not perpendicular to the sun radiation caused an imbalance guiding the controller to rotate the system to the direction that makes the imbalance equal to zero. In some other panels, by utilizing the planetary relations and parameters, the shining angle of the sun for each time during a year is de- termined and then, by feeding this information to a microcontroller, the tracker always positions the panel in the desired angle. 3. Study of Sun Position in the Sk y The sun status is determined based on the angles of zenith and azimuth. The zenith angle is the angle between the sun’s direction and the axis perpendicular to the desired area and upward. The azimuth angle is the angle between the North Pole and the direction of the sun’s projection on the earth in the clockwise direction. The Figure 6 shows these angles. In this figure there is another angle that is complementary to the zenith angle and is called the elevation angle. Geographically, the position of a region on the earth is marked by the parameters of latitude and longitude. The latitude shows the position of an area between the northern and southern poles and the longitude marks it relevant to the east-west direction. Figure 7 illustrates these definitions. According to the planetary relations, it’s rather easy to determine the zenith and azimuth angles of the sun for a specific region annually. This paper refers to the reference [10] for the zenith and azimuth angles of the sun in 2011. Figure 8 shows the sun’s status in different seasons according to the (declination angle). This angle is de- fined as the angle between the equator angle and the sun’s direction at midday. As shown in the figure, for northern hemisphere the declination angle of the sun in summer and winter is respectively toward the north and south and reaches a peak of 23.45 degrees and therefore for the panels a tilt angle toward the south is consi- dered. Figure 5. The path of sun during the different seasons.  S. Bazyari et al. Figure 6. Sun position in the sky. Figure 7. Latitude and longitude. Figure 8. Declination angle for north hemisphere, in winter (left ), spring and autumn (middle) and in summer (right ). The shining angle of the sun at midday of a specific location is determined according to its declination angle and it’s possible to be considered equal to the optimized tilt angle (γ). Therefore, this parameter is acquired by using of Equation (1): latitude angledeclinationangle γ = − (1) The Figure 9 shows the changes of the declination angle during a year and the Figure 10 shows the sun radi- ation angle for locations with various latitudes. In the photovoltaic systems equipped to a double axis tracker, one of the trackers momentarily moves the panel in a way that the tilt angle is in accordance with the Equation (1). While in the fixed panel and single axis tracker systems, the tilt angle of the panel is fixed. If the tilt angle doesn’t change during a year, it’s usually considered to be equal to the latitude of the area [12]. Of course, by the means of simulation, it’s possible to try different tilt angles and select the one yielding the highest yearly shining as the optimized angle. Such simulation can also be used to determine the optimized tilt angles of each season. As such, the angle changes 4 times during each year. In this paper, the southward angle of the fixed pan- el photovoltaic systems is selected as 26.81 degrees and is equal to the latitude of the Qeshm Island. 4. Different Components of Sun Radiation In this part, the amount of the sun radiation received by different surfaces on the earth is determined based on the position of the sun. Figure 11 shows the condition in which the sun shines with a zenith angle of z over the zone o. The maximum shining in this zone is At which is determined based on the zenith angle of the tangential component (Ah) and the normal component (Av) and is acquired as follows:  S. Bazyari et al. Figure 9. The declination angle variation during the year [11]. Figure 10. Optimum tilt angle for different regions during the year [11]. Figure 11. Tangential and normal components of sun radiation. (2) (3)  S. Bazyari et al. Now, the tangential component of the two vectors must be decomposed on the x (Ax) and y (Ay) axis. This process requires the azimuth angle of sun in the desired area. ()cos()sin( )cos() xh t AAaAz a=−=− (4) ()sin()sin( )sin() yh t AAaA za=−− = (5) As seen in Figure 11, the x axis is toward the North Pole, the y axis is westward and the z axis is upward; therefore, the value of the Ax and Ay is acquired by using of (4) and (5). The minus mark is formed in the y component since the positive direction is considered westwards, while the sun radiation component is eastwards according to the definition of the clockwise azimuth angle. Due to the equations above, the parameters of sun radiation in the directions of x, y, z axes are determined as (6). ()sin( )cos()sin( )cos() ()sin( )sin()sin( )sin() ()cos( )cos( ) xt t yt t zt t AAzaAz a AAzaAza A AzAz =− −=− =− −= =−=− (6) Now, the effective shining on a plane that faces southward with an angle of γ is determined. As mentioned before, the x axis is northwards and by giving a southward angle to a plane, a structure like the Figure 12 is formed. Of course, if the plane is rotated northwards, the tilt angle becomes negative. As observed in the Figure 12, a new coordinate system is defined in order to determine the shining component on this plane. This coordi- nate system comprises of the w, y, u axes. The w axis is resulted by shifting the x axis and the u axis by shifting the z axis for a measure equal with the γ angle from north toward south (x to z). The third axis is the y axis. Now, the sun radiation components (Aw, Ay, Az) are decomposed to the components of the three new axes (Aw, Ay, Au). In the new coordinate system, the y component has not changed and the components of the w and u axes are ac- quired from Equations (7) and (8) resulted by Figure 12 and Figure 13. sin( ) cos( ) zw z zu z AA AA γ γ = = (7) cos( ) sin( ) xw x xu x AA AA γ γ = = − (8) Figure 12. New coordinate system and decomposition of z axis component. Figure 13. Decomposition of x axis component.  S. Bazyari et al. According to the equations mentioned in this part, from a maximum radiation on a plane that faces south- wards with an angle of γ and in an area where the sun is in the zenith angle of z and the azimuth angle of a, the amount of the radiation received by different axis of the plane is as follows: sin( )cos()cos()cos( )sin() sin( )sin() sin( )cos()sin()cos( )cos() wt t yt ut t AAzaA z AA za AA zaAz γγ γγ =−− = = − (9) 5. Different Photovoltaic System Performance This study uses the hourly sun radiation data of the sun in “Qeshm” island in 2011 (Figure 14) [13]. It is col- lected from the data that the maximum radiation of the sun on a spherical sensor of a double axis tracking sys- tem. In the fixed panel systems, only the u axis components and in the systems with single axis tracking tech- nology, the components of the u and y axes are absorbed. (10) (sin()cos( )sin( )cos()cos( )) fixed panelut AAA zaz γγ = =− (11) 22 22 sin (sin( )sin())(sin( )cos()cos()cos( )sin()) gle axisyut AAAAz azaz γγ = +=+− (12) According to the radiation data and with the aid of the equations above, the radiation received by each photo- voltaic system per hour is determined. In the Figures 15-18, the effect of the single axis and double axis systems Figure 14. Sun radiation data of Qeshm Island [13]. Figure 15. Received sun radiation density associated to a sample day in spring. 01000 2000 3000 4000 5000 6000 7000 8000 9000 0 200 400 600 800 1000 1200 time (hour) solar radiation (watt per square meter) 700 702 704706708 710 712 714 716 0 200 400 600 800 1000 time (h) solar radiation (watt per square meter) no tracker single axis tracker double tracker 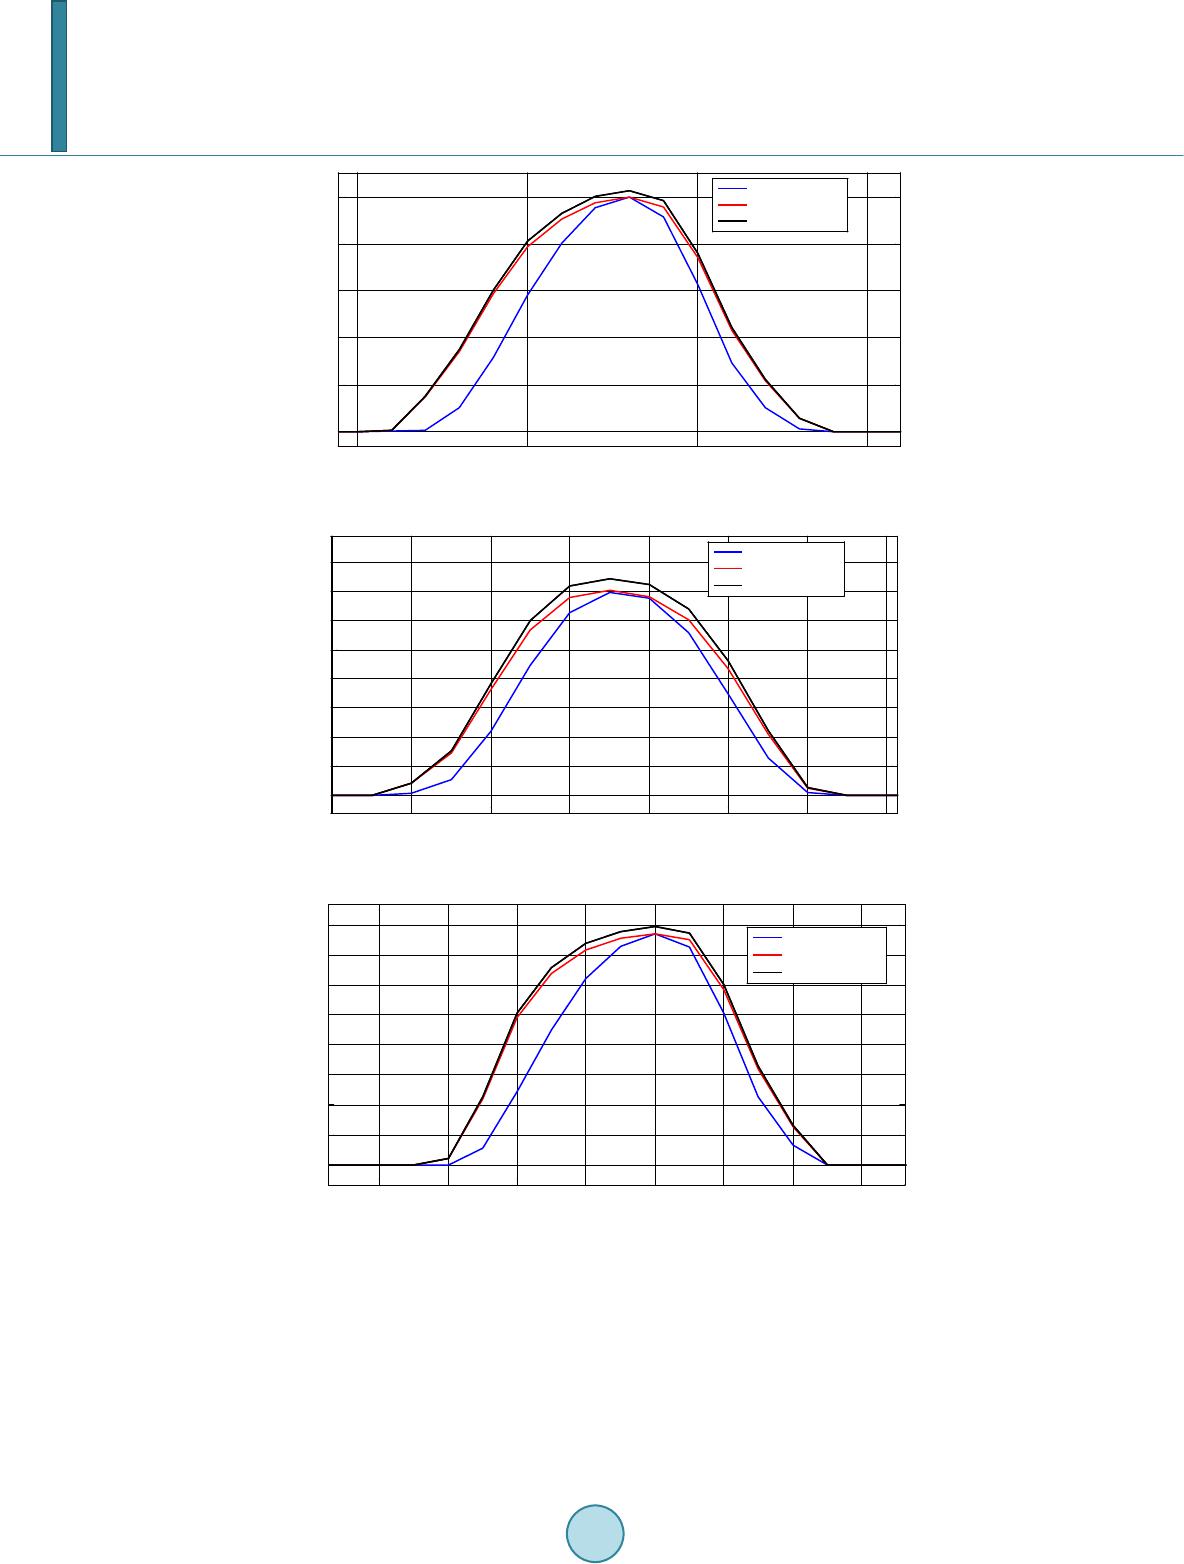 S. Bazyari et al. Figure 16. Received sun radiation density associated to a sample day in summer. Figure 17. Received sun radiation density associated to a sample day in autumn. Figure 18. Received sun radiation density associated to a sample day in winter. on the amount of the received radiation on a sample day in the spring, summer, autumn and winter seasons is il- lustrated. As shown in the figures, the single axis tracker has been able to considerably increase the sun radiation reception while the double axis type does not show any noticeable enhancement compare to the single axis. These results can be better determined by comparing the energy received in different days of a year. In the Fig- ures 19-21, the energy received by different types of photovoltaic systems in different days of the year is illu- strated. The Table 1 shows the average and maximum value of the daily received energy and also the average and maximum value of the density of the received sun radiation for three types of photovoltaic systems. 3630 3635 3640 3645 0 200 400 600 800 1000 time (h) solar radiation (watt per square meter) no tracker single axis tracker double tracker 5838 5840 5842 58445846 5848 5850 5852 0 100 200 300 400 500 600 700 800 time (h) solar radiation (watt per square meter) no tracker single axis tracker double tracker 7902 7904 7906 7908 7910 7912 7914 7916 0 100 200 300 400 500 600 700 800 time (h) solar radiation (watt per square meter) no tracker single axis tracker double tracker 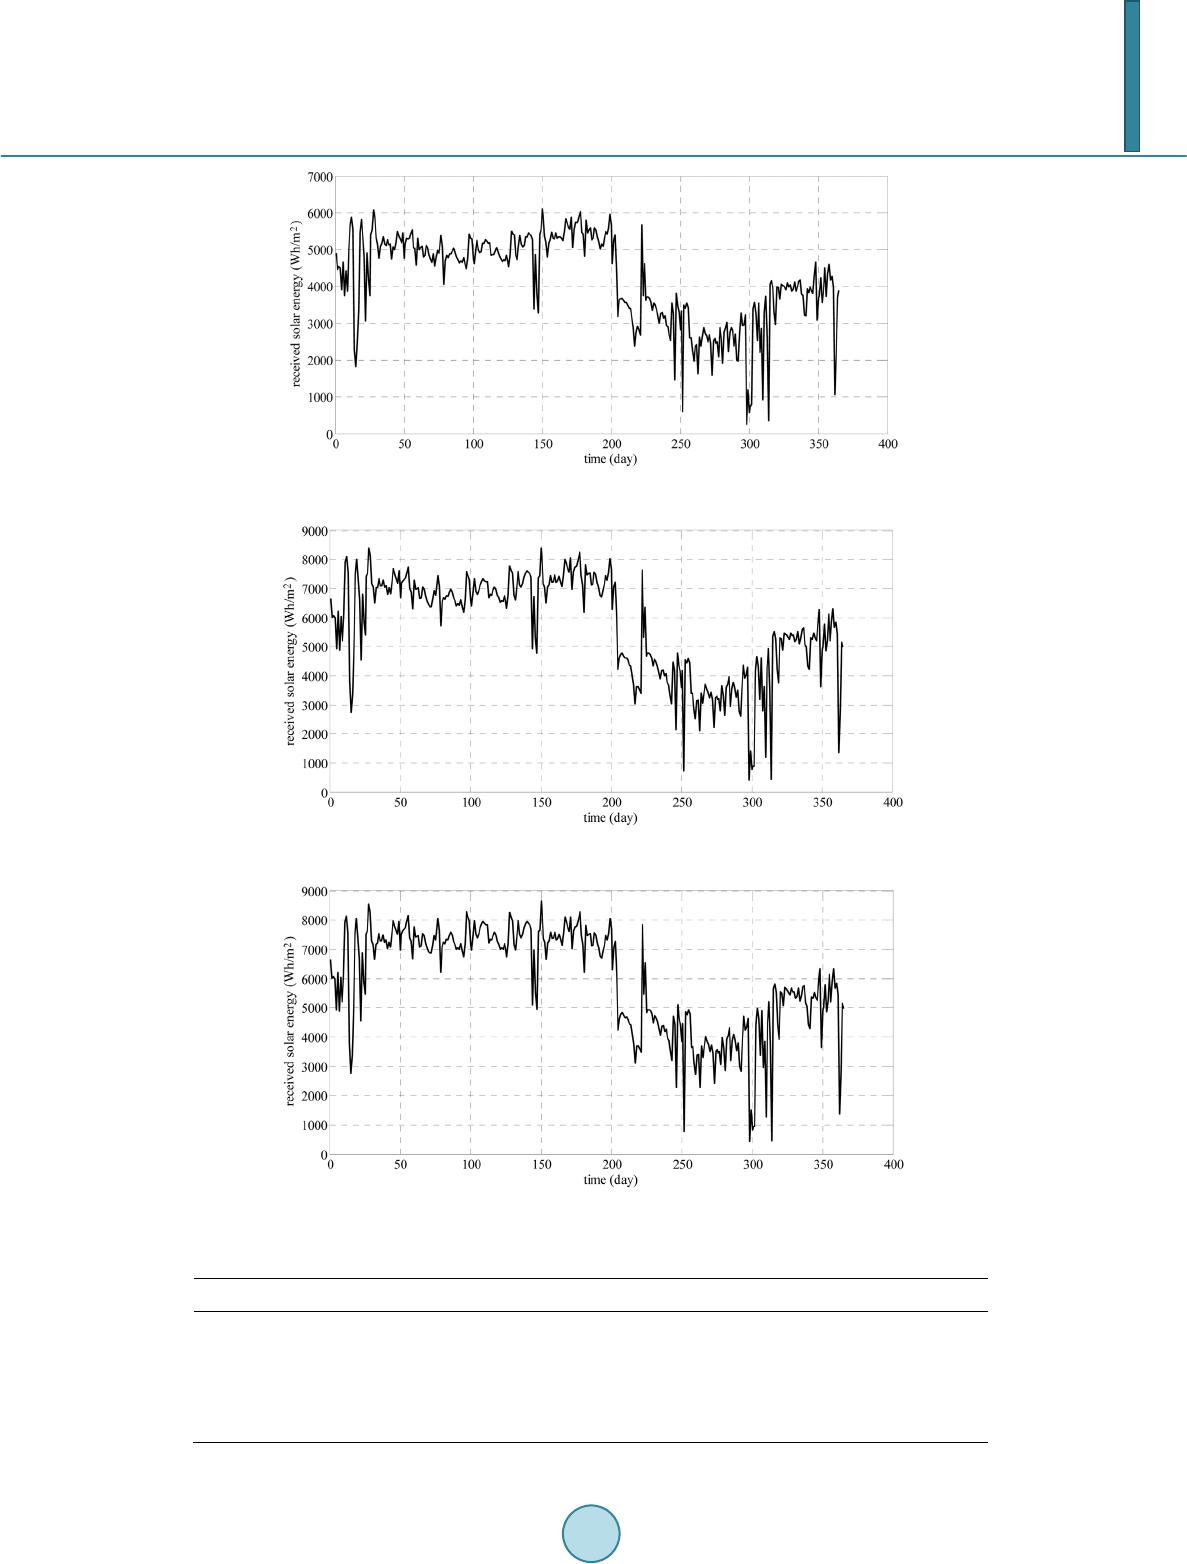 S. Bazyari et al. Figure 19. Daily received energy associated to fixed panel system. Figure 20. Daily received energy associated to system equipped to single axis tracker. Figure 21. Daily received energy associated to system equipped to double axis tracker. Table 1. Received energy and radiation from different types of photovoltaic systems. Type Fixed panel With single axis tracker With double axis tracker Average daily received energy 4205 wh/m2 5694 wh/m2 5926 wh/m2 Maximum daily received energy 6040 hw/m2 8387 wh/m2 8637 wh/m2 Average received density 175 w/m2 237 w/m2 247 w/m2 Maximum received density 1098 w/m2 1120 w/m2 1140 w/m2  S. Bazyari et al. 6. Conclusion This paper compares different photovoltaic systems installed in Qeshm Island from received solar radiation point of view. In order to study the effects of the single axis and double axis trackers, the relations between the solar components are extracted according to its position in the sky and then analyzed by using of the solar data of the island in the year 2011. The results of the analysis show that the average value of the energy received by the panel with single axis tracker was 1.35 times greater than that of a fixed panel system, while the double axis tracker system receives only 1.04 times the received energy of a single axis one. So it can be concluded that making a solar farm equipped to the single axis tracker systems can be a proper option for the generation elec- tricity from the solar energy in Qeshm Island. References [1] www.pvresourdes.com [2] (2009) Combined Mechanical and Electrical Control of Solar Trackers in (C)PV Power Plants. 13th European Confe- rence on Power Electronics and Applications, 1-5. [3] Al ami, A. and Batista, R. (2009) Performance Analysis of a Large Scale Photovoltaic Solar Grid Connected System. 34th IEEE Photovoltaic Specialists Conference (PVSC ). [4] Guo, Y.Z., Cha, J.Z. , Liu , W. and Tian , Y.B. A System Modeling Method for Optimization of a Single Axis Solar Tracker. ICCASM 2010. [5] Boicea, A.V., Di Leo, P., Graditi, G. and Spertino, F. (2010) Comparison of Operating Parameters in Grid Connected Photovoltaic Systems with Single/Double Sun-Trackers at Different Latitudes. International Symposium on Power Electro nics, Electrical Drives, Automation and Motion, 130 -133. [6] Belt rán, J.A., González Rubio, J.L. and García-Beltrán, S.yC.D. (2007) Design, Manufacturing and Performance Test of a Solar Tracker Made by a Embedded Control. Fourth Congress of Electronics, Robotics and Automotive Mechan- ics. [7] Huang, Y.J. , Member, I., Kuo, T.C. , Chen, C.Y . , Chang, C.H., Wu, P.C. and Wu, T. H . (2009) The Design and Imple- mentati on of a Solar Tracking Generating Power System. Engineering Letters. [8] Visconti, P., Ventura, V., Tempest a, F., Romanello, D. and Cavalera, G. (2011) Electronic System for Improvement of Solar Plant Efficiency by Optimized Algorithm Implemented in Biaxial Solar Trackers. 10th International Conference on Environment and Electrical Engineering (EEEIC). [9] Khaligh, A. an d Onar, O.C. (2010) Energy Harvesting, Solar, Wind ans Ocean Energy Conversion Systems. CRC Press . [10] www.solartopo.com [11] www.pveducation.org [12] http://www.macslab.com/optsolar.html [13] Solar Radiation Data Associated to Qeshm Island Collected by Renewable Energies Organization of Iran.
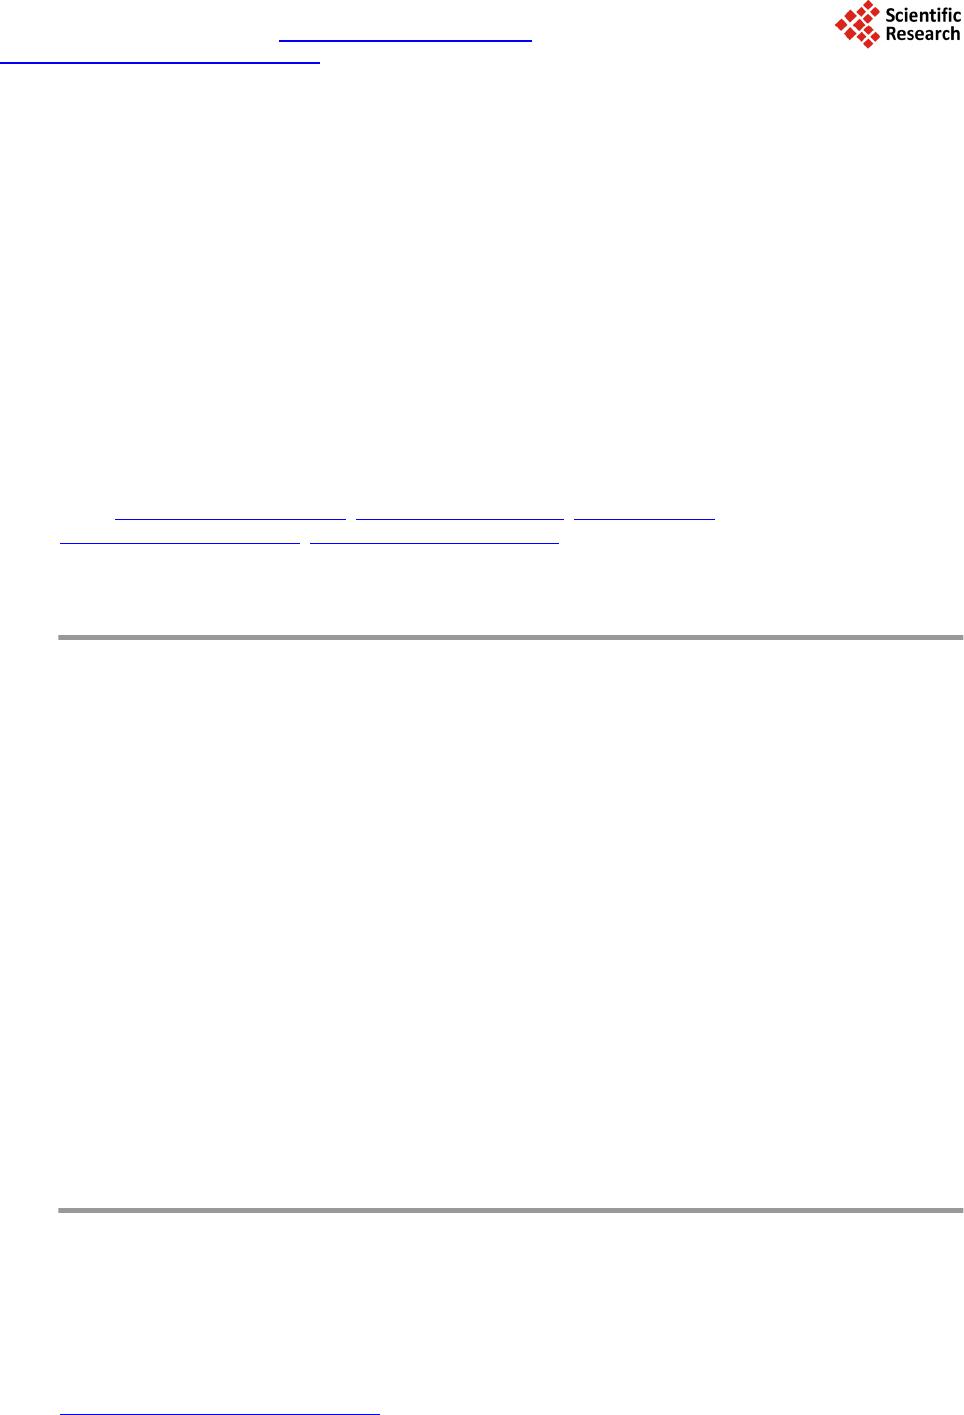
|