Atmospheric and Climate Sciences, 2011, 1, 61-67
doi: 10.4236/acs.2011.12007 Published Online April 2011 (http://www.SciRP.org/journal/acs)
Copyright © 2011 SciRes. ACS
Applications of Satellite Data for Aerosol Optical Depth
(AOD) Retrievals and Validation with AERONET Data
Sunil Bhaskaran1, Neal Phillip1, Atiqur Rahman2, Javed Mallick2
1Department of Chemistry and Chemical Techno logy, Bronx Community Colleg e ,
York College and Earth and Environmental Studies, Graduate Center,
City University of New York, USA
2Urban Environmental Management and Remote Sensing & GIS Division, Department of Geography,
Faculty of Natural Sciences, Jamia Millia Islamia, New Delhi, INDIA
E-mail: Sbhaskaran@gc.cuny.edu
Received February 16, 2011; revised March 8, 2011; accepted March 15, 2011
Abstract
An understanding of the amount and type of aerosols present in the atmosphere is required for the atmos-
pheric correction of satellite imagery. A sensitivity analysis of the atmospheric inputs to the MOD09 soft-
ware has shown that uncertainty in the estimation of Aerosol Optical Depth (AOD) has the greatest impact
on the accuracy of atmospheric correction of MODIS data. The MOD09 software used for the generation of
surface reflectance products estimates the AOD of the atmosphere at the time of image acquisition. AOD
measurements retrieved from MODIS were compared with near-simultaneous AErosol RObotic NETwork
(AERONET) data over three sites in Australia, using time-series of MODIS surface reflectance products.
The results of the study provide an important independent validation of ACRES MODIS Surface Reflectance
Products. This procedure may be applied to long time series MODIS data for estimating the accuracy of
MOD09 retrieved AOD.
Keywords: Aerosol Optical Depth, MODIS Data, Urban Area
1. Introduction
Aerosols are one of those important geophysical pa-
rameters that determine the earth’s energy balance and
hydrological cycle. These suspended airborne particles
scatter solar radiation back, absorb solar radiation in the
atmosphere, and shade the earth’s surface. Light can be
scattered to the sensor through single backscattering by
an aerosol particle or by a series of forward and/or
backward scattering events in the atmosphere. Absorp-
tion by aerosol particles is generally spectrally and
angularly dependent (King et. al, 1999). Furthermore
airborne particles act as cloud condensation nuclei en-
tering into cloud processes and thereby change cloud
reflectivity and the hydrological cycle. Aerosols also
affect human health and reduce visibility. Some aerosol
types are natural, such as wind-blown desert dust or sea
salt caused by breaking waves. Other aerosol types are
created from human activities such as urban/industrial
pollution and biomass burning. Unlike CO2, another at-
mospheric pollutant input into the atmosphere from hu-
man activity, aerosols are not well mixed in the atmos-
phere and, because of their spatial and temporal variabil-
ity, the uncertainty of estimating human-induced aerosol
forcing on climate and the hydrological cycle is on the
order of 2 W m2, which is equal to the estimated forcing
of all the greenhouse gases combined. Therefore, char-
acterizing global AOD presents one of our major chal-
lenges today (Kaufman et. al, 2002). Several interna-
tional agencies such as the Australian Centre for Remote
Sensing (ACRES) are conducting research on reducing
atmospheric attenuations from the image and on im-
proving the MODIS surface reflectance products. Aero-
sols are one of the greatest sources of uncertainty in cli-
mate modeling. Aerosols vary spatially and temporally
leading to variations in cloud microphysics, that could
impact cloud radiative properties and climate. One of the
key objectives of this study is to understand the spa-
tio-temporal dynamics of aerosols over 3 stations in
Australia for the year 2005 by comparing MODIS re-
62 S. BHASKARAN ET AL.
trieved AODs and AERONET collocated aerosol data.
Objectives
The main objective of this study was to compare the
MODIS retrieved spectral AODs at 3 wavelengths on-
board Terra and temporally coincident measurements of
ground truth data obtained from AERONET (Aerosol
Robotic Network) solar direct radiance measurements.
The purpose of validation is to detect biases, if any,
originating from the processes involved in deriving the
products and to establish the accuracy levels of the
products, based on comparison with independent obser-
vations of known accuracy (ground truth).The datasets
were collocated from 3 operational AERONET sites in
Australia Canberra –35˚1615, 149˚0639, Birdsville
–23˚5356, 139˚2049 and Tinga Tingana –28˚5833,
139˚5927and compared with AODs retrieved from
MODIS bi-products. The sun photometers from ground
sites provide unprecedented spectral coverage from visi-
ble (VIS) to the solar near-infrared (NIR) and infrared
(IR) wavelengths.
2. AERONET
The AERONET (AErosol RObotic NETwork) is a
global consortium of ground based sun-sky radiometers
where data is centrally archived and disseminated by
Internet to all users. A sunphotometer is an instrument
which measures the intensity of the Sun’s light, when
pointed directly at the Sun. Any aerosols and gases (haze)
between the Sun and the photometer tend to decrease the
Sun's intensity. A hazy sky would read a lower intensity
of sunlight and give a lower voltage reading on the pho-
tometer. A clear blue sky would result in a greater inten-
sity and a higher voltage reading (URL http: // www.
nasa.gov/vision/earth/everydaylife/aeronet.html,
2-9-2011). The AERONET was originally established by
AERONET and PHOTONS and greatly expanded by
AEROCAN and other agency, institute, and university
partners. The goal of this site is to assess aerosol optical
properties and validate satellite retrievals of aerosol op-
tical properties. The network imposes standardization of
instruments, calibration, and processing. Data from this
collaboration provides globally distributed observations
of spectral AODs, inversion products, and precipitable
water in geographically diverse aerosol regimes. AER-
ONET data is available in 340 nm, 380 nm, 440 nm, 500
nm, 670 nm, 870 nm and 1020 nm. Three levels of data
are available from this website: Level 1.0 (unscreened),
Level 1.5 (cloud-screened), and Level 2.0 (Cloud
-screened and quality-assured) (reference from Aeronet
website). Since the AOD is generally less than unity, a
good calibration of the radiometer is essential for the
successful retrieval of aerosol optical density from
space (Griggs, 1975). Only Level 1.5 cloud screened data
were used since calibrated Level 2.0 data were not
available for the study sites at the time of analysis.
(a)
(b)
(c)
Copyright © 2011 SciRes. ACS
S. BHASKARAN ET AL.
63
(d)
(e)
Figure 1. (a) A view of the instrument and site in Canberra;
(b) A view of the sun photom eter and the sun taken during
a January 2003 firestorm, Site: Canberra; (c) Sun pho-
tometer in a weather station enclosure at a local airport,
Site: Birdsville; (d) A view of the instrument site and sur-
rounding terrain, Site: Birdsville; (e) A close-up view of the
instrument platform and sun photometer, Site: Inga Tin-
gana (with a hawk on top).
3. Study Sites
Canberra (–35˚1615, 149˚0639; Elevation –600 mts)
is located in the Australian Capital Territory, Birdsville
and Tinga Tingana sites in Australia were selected for
the study. The site began collecting data from the
15thJanuary, 2003 and the operational time is 1038 Days
[2.844 years]. The sun photometer is mounted on the
roof of the two-storey CSIRO lab in Australia’s capital
city, Canberra.
Data was collected at the Birdsville (23˚5356, 139˚
2049; Elevation –46.5 mts) site on the 13thAugust, 2005.
The site has been in operational mode for 269 Days.
Birdsville is located near the maximum of dust storm
frequency on the continent. It lies just east of the Simp-
son desert, and to the north of the Strzelecki desert
(where TT is located) so receives dust from the prevail-
ing southerly and westerly winds. The third site selected
for this study in Australia is Tinga Tingana (28˚5833,
139˚5927; Elevation –38.0 mts). Data has been col-
lected from this site since the 3rd January, 1993 and the
site has been in operation for 1727 Days. The Tinga
Tingana site is enclosed within a fence in a desert region
in Tinga Tingana, Australia. The CSIRO is responsible
for the instruments and all AERONET sites in Australia
are managed by a PI from CSIRO, Canberra.
4. Methodology
A spatial-temporal approach demonstrated by Ichoku et.
al. (2002a) was employed for this study. Twenty two (22)
raw Full Swath L1B MODIS packet data sets (pds) were
acquired from the ACRES digital catalogue for the time
period between January, 2005 to December, 2005 over
the three (3) selected study sites in Australia. The
MODIS scenes were acquired by using series of near
coincident Landsat ETM scenes from the ACRES digital
catalogue software. The pds MODIS scenes were proc-
essed by using a modified version of MOD09 atmos-
pheric processing algorithm (originally from NASA).The
product is an estimate of the surface spectral reflectance
for each band as it would have been measured at ground
level if there were no atmospheric scattering or absorp-
tion. It includes corrections for the effect of atmospheric
gases, aerosol, and thin cirrus clouds and provides inputs
to NDVI, EVI and BRDF. MOD09 permits rigorous
temporal comparison and cross calibration with other
sensors including AVHRR, Landsat and ASTER which
leads to better exploitation of ACRES archive. The
MODIS surface reflectance product (MOD09), is a
seven-band product computed from the MODIS Level
1B land bands 1, 2, 3, 4, 5, 6, and 7. Tab le 1 and Tab l e 2
show the number of bands used by MOD09 in the re-
trieval process, and the total number of MODIS passes
used in the study respectively. The entire MOD09 work
flow process is shown on Figure 2.
The AODs were retrieved at 3 wavelengths (Band1:
620 - 670 nm; Band3: 450 - 479 nm and Band8: 405 -
420 nm) respectively from the MOD09 atmospheric cor-
rection algorithm. At ACRES, AOD products are generated
Table 1. MOD09 Bands
• Band1 648 nm • Band2 858 nm
• Band3 470 nm • Band4 555 nm
• Band5 1240 nm • Band6 1640 nm
• Band7 2130 nm
Copyright © 2011 SciRes. ACS
S. BHASKARAN ET AL.
Copyright © 2011 SciRes. ACS
64
Table 2. Time series of MODIS scenes and information.
SNo Acquisition date Orbit No Ancillary data usedAeronet site namesSolar Zenith Angle (sza) Canberra and Birdsville
1 04-03-2005 27707 TOVS Canberra 0.62°
2 08-06-2005 29105 Not Available Canberra 1.96°
3 15-01-2005 27008 TOVS Canberra Geolocation error
4 16-02-2005 27474 TOVS Canberra Geolocation error
5 17-12-2005 31901 TOAST Canberra 3.11°
6 20-03-2005 27940 TOVS Canberra 0.78°
7 23-5-2005 28872 TOVS Canberra 3.65°
8 02-07-2005 29455 TOAST Birdsville/Tinga 6.67°
9 03-08-2005 29921 TOAST Birdsville/Tinga 3.44°
10 04-09-2005 30387 TOAST Birdsville/Tinga 3.33°
11 07-11-2005 31319 TOAST Birdsville/Tinga 2.17°
12 12-03-2005 27824 TOVS Birdsville/Tinga 9.02°
13 13-04-2005 28290 TOVS Birdsville/Tinga 4.05°
14 15-05-2005 28756 TOVS Birdsville/Tinga 6.94°
15 16-06-2005 29222 TOAST Birdsville/Tinga 5.85°
16 18-07-2006 29688 TOAST Birdsville/Tinga 3.54°
17 19-08-2005 30154 TOAST Birdsville/Tinga 7.39°
18 20-09-2005 30620 TOAST Birdsville/Tinga 3.96°
19 22-10-2005 31086 TOAST Birdsville/Tinga 3.88°
20 28-03-2005 28057 TOVS Birdsville/Tinga 5.85°
21 29-04-2005 28523 TOVS Birdsville/Tinga 4.23°
22 31-05-2005 28989 TOVS Birdsville/Tinga 4.51°
Figure 2. MOD09 Atmospheric correction process work
flow to generate a full single swath at ACRES, Australia.
in 3 different formats - ER Mapper he differences in their
data structures. MODIS covers an extensive area across a
given AERONET instrument site almost in an instant,
whereas the AERONET sun photometer takes point
measurements several times during the daytime. MODIS
expresses spatial variability, AERONET expresses tem-
poral variability (Ichoku et.al, 2004). The AOD values
for all the 3 sites were collocated and extracted over all 3
sites at a coarse and fine spatial resolution by using both
spatial windows of 50 km by 50 km and 10 km by 10 km
(Kaufman et.al, 2000). The MODIS retrieved AODs
were then compared by plotting them against the AODs
retrieved from AERONET for all 3 sites for the year
2005.
PDS Attitude and Ephemeris
Seadas Level 1 Processor
5. Aerosol Comparison - Results and
Discussions:
GDAS-Surface Pressure and
Temperature TOASTS and
TOVS - Ozone
MOD09
Spatial and temporal distribution of MODIS and Aeronet
AODs over Canberra, Birdsville and Tinga Tingana for
the year 2005
A spatial-temporal approach based on Ichoku (2002a)
was employed to validate MODIS AOD retrievals in this
study. MODIS retrieved AODs for 3 wavelengths (405 -
420 nm, 450 - 479 nm and 620 - 670 nm) were plotted
against temporally coincident AERONET retrieved
AODs. Figures 3 (a)-(d) below shows the graphs for the
3 sites for the year 2005. Spatial and temporal trends of
aerosol retrievals from MODIS and AERONET for
Canberra, Birdsville and Tinga Tingana sites in Australia
for year 2005 are described in the following paragraphs.
A generally observation is that MODIS retrievals overes-
timates for low aerosols and underestimates for higher
AOD. AODs were extracted for variable spatial windows
of 50 km by 50 km and 10 km by 10 km from the
MODIS scenes. The solar zenith angle (sza) of each
scenes were recorded to provide a qualitative estimate of
the angular variations of AOD retrievals. The statistics
(mean, median, standard deviation) were generated for
GeoTIFF Map O
r
iented
MRT Swath Map Projection
MOD09 HDF
Swath
S. BHASKARAN ET AL.
65
each scenes and were plotted against the 3 wavelengths
of AERONET (380 nm, 440 nm and 675 nm) and MODIS
spectral bands (center wavelengths). The distribution of
AODs (MODIS retrievals) were also mapped for all
scenes to display the concentrations of high and low
aerosol depths over the 3 study sites.
5.1. Spatio-temporal Distribution of AOD in
Canberra – 2005
Yearly trend in spectral AODs retrieved by both MODIS
and Aeronet over Canberra shows that AOD is low in the
beginning of year and peaks during mid year period
(May-June, 2005). High concentrations of AERONET
AODs (0.40 and 0.10) are found in the months of May
and June which reduces towards the end of the year. For
these two months AERONET sun photometer estimates
are significantly higher compared to MODIS retrieved
AODs. This may be attributed to the increase in mid year
bush fires which engulfed Canberra in 2005. The
MODIS retrievals generally are overestimated for all the
months compared to the AODs retrieved by the sun pho-
tometer instrument in Canberra. Overall estimates for
both MODIS and AERONET are generally low for
(a)
(b)
(c)
(d)
(e)
Figure 3. (a) Spatial distribution of AOD retrievals from
MODIS: Band 1 over Canberra – 4 March, 2005. (b) Spa-
tial distribution of AOD retrievals from MODIS: Band 1
over Canberra – 23rd March, 2005. (c) Spatial distribution
of AOD retrievals from MODIS: Band 1 over Canberra –
8th June, 2005. (d) Spatial distribution of AOD retrievals
from MODIS: Band 1 over Birdsville – 12th March, 2005.(e)
Spatial distribution of AOD retrievals from MODIS: Band
1 over Birdsville – 12th March, 2005.
Canberra expect for May, 2005 where the MODIS and
Aeronet AODs reach a peak of 0.60 and 0.40 respec-
tively.
Copyright © 2011 SciRes. ACS
66 S. BHASKARAN ET AL.
5.2. Spatio-temporal Distribution of AOD in
Birdsville, 2005
For Birsdville in general MODIS retrievals overestimate
AODs. For instance for 12th March, 2005 MODIS more
than Aeronet retrievals by 0.02 except at 440 nm - 470
nm where MODIS retrievals are underestimated to the
Aeronet AODs. 28thMarch, 2005: MODIS retrievals
overestimate AOD at 470 nm but run close to Aeronet
retrievals for the other wavelengths. 13thApril, 2006
MODIS retrievals overestimate AODs at 412 nm and
470 nm but underestimate at 659 nm. 29th April:
MODIS retrievals underestimate AODs at 412 nm and
659 nm, but overestimate at 470 nm.15thMay, 2005:
MODIS retrievals underestimate AODs at 412 nm and
659 nm but overestimate at 470 nm 31stMay, 2005:
MODIS retrievals underestimate AOD at 412 nm and
659 nm but overestimate at 470 nm MODIS retrievals
underestimate at all wavelengths. 2ndJuly,2005: MODIS
underestimates at 412 nm and 470 nm but overestimates
at 675 nm marginally. 18th July,2005: MODIS retrievals
underestimate AODs at 412 nm and 659 nm but overes-
timate at 470 nm. For the months of August, September,
and October MODIS retrievals underestimate Aeronet
retrievals at all the wavelengths.
5.3. Spatio-temporal Distribution of AOD in
Tinga Tingana – 2005
MODIS retrievals overestimate Aeronet retrievals for all
wavelengths but for certain months the opposite trend is
observed particularly for in the months of October and
November, 2005 where the MODIS retrievals are under-
estimated by Aeronet estimates. Some months the
MODIS and Aeronet estimates underestimate at some
wavelengths but overestimate at others. For instance on
12th March, 2005 the MODIS retrievals match Aeronet at
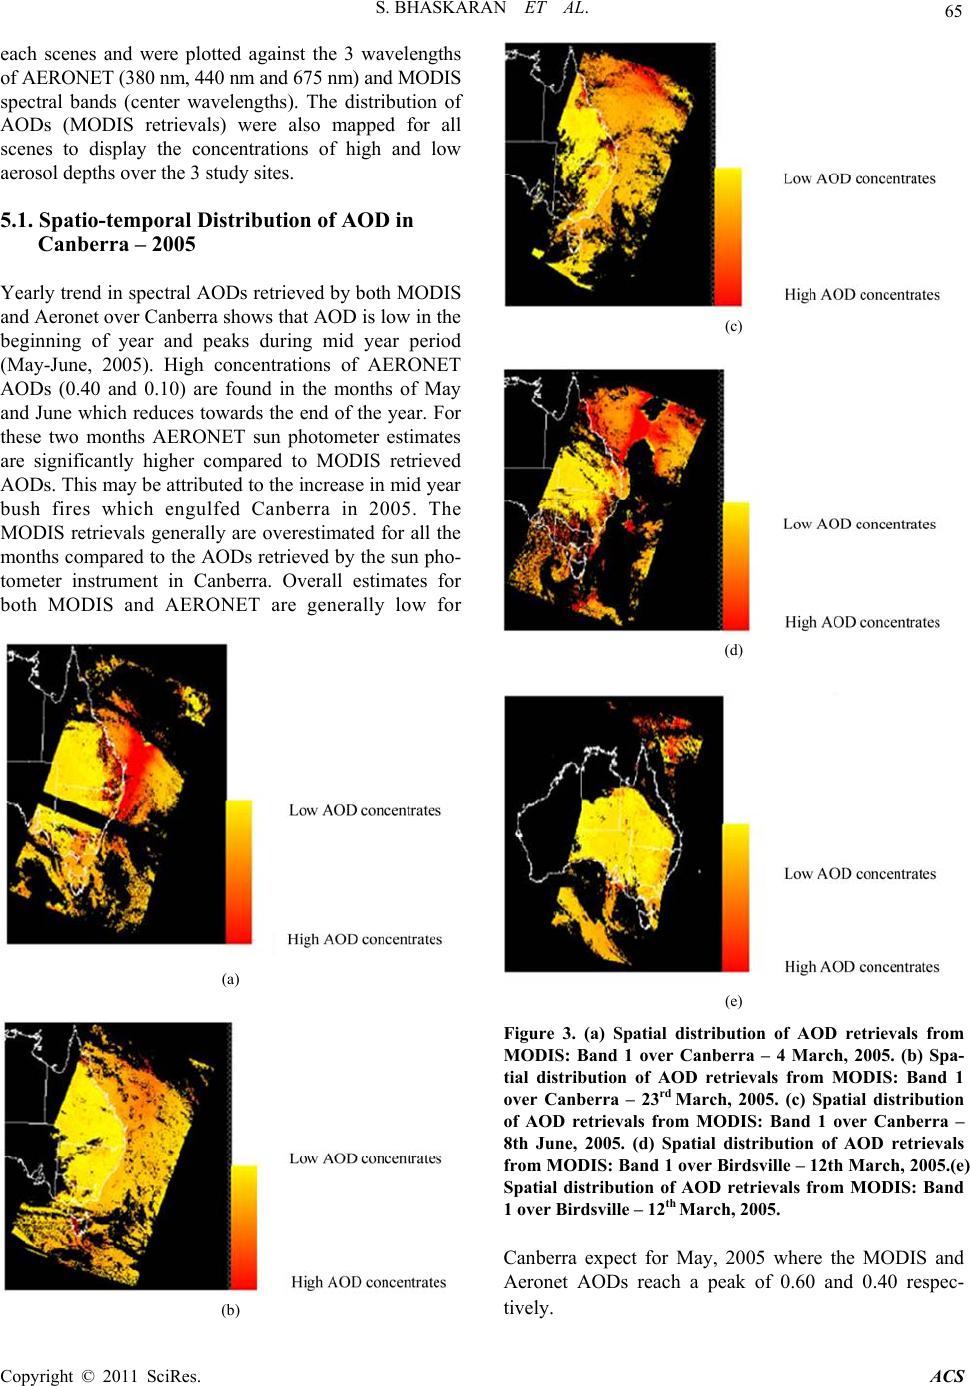
380 - 412 nm (Figure 3 (e)) but overestimates at 440 -
470 nm and underestimates at 659 - 675 nm wavelength.
On 28th March, 2005 the MODIS retrievals overestimate
the Aeronet retrievals at all wavelengths. On the 13th
April, 2005 the MODIS retrievals underestimate the
Aeronet estimates at 380 - 412 nm and 659 - 675 nm
wavelengths, but between 440 – 470 nm wavelengths the
MODIS retrievals match the Aeronet retrievals. On 15th
May,2005 the MODIS retrievals overestimate the Aer-
onet retrievals at all wavelengths and on the 2ndJuly,
2005 the MODIS retrievals underestimate at 380 - 412
wavelength, but overestimate the Aeronet retrievals at
the 440 - 470 nm and 659 - 675 nm wavelengths. On the
18thJuly, 2005 the MODIS retrievals underestimate
AODs at 412 nm and 659 nm but overestimate at 470 nm.
On 3rdAugust, 2005 the MODIS retrievals overestimate
Aeronet retrievals for all the wavelengths.
On the 4thSeptember, 2005 the MODIS retrievals un-
derestimate the Aeronet retrievals for all wavelengths.
On 22ndOctober and 7thNovember, 2005 the MODIS re-
trievals underestimate the Aeronet retrievals for all
wavelengths.
6. Conclusions
Yearly data sets were compared in this study over three
sites in Australia using level 1.5 cloud free data. The
MODIS retrieved AOD overestimates compared with the
Aeronet retrievals. The results also may be affected by
the numerous problems posed to aerosol retrieval by the
surface background over land and the potential sampling
mismatch in comparing averages from MODIS spatially
variable data space and AERONET temporally variable
data space. There were some limitations that may have
contributed to the accuracy of validation. AOD is gener-
ally less than unity, a good calibration of the radiometer
is essential for the successful retrieval of aerosol optical
density from space. Calibrated Aeronet data (Level 2.0)
was not available over the 3 study sites which further
reduced the accuracy of the study. It is important to un-
derstand the proportion of trace gases like water vapour,
carbon dioxide which absorb solar radiation in the 1600,
2100 nm wavelengths. Estimating AODs is a challenging
research investigation due to the highly variable spatial
and temporal dimensions of AODs. Some changes in the
internal instrument temperature are also some cause of
false signals in sun photometers. Calibration of sites is a
complex process and efforts are underway in Australia to
provide calibrated AOD data which we hope this will
further enhance the accuracy of results presented in this
study.
Despite these limitations in the assessment a general
conclusion is that MODIS AODs tend to overestimate
the AODs particularly over land.
7. Acknowledgements
The authors would like to thank the PI and staff at
CSIRO for establishing and maintaining the AERONET
sites used in this study.
8. References
[1] Griggs, M., 1975: Measurement of atmospheric aerosol
optical thickness over water using ERTS-1 data. J.Air
Pollut.Contr. Assoc., 25, 622-626.
[2] Hauser, A., Oesch, D., Foppa, N., Aerosol optical depth
over land: Comparing AERONET, AVHRR and MODIS.
Geophysical Research Letters, Vol. 32, LXXXXX, doi:
10.1029/2005GL023579, 2005
Copyright © 2011 SciRes. ACS
S. BHASKARAN ET AL.
Copyright © 2011 SciRes. ACS
67
[3] Ichoku, C., D. A. Chu, S.Matoo, Y.J. Kaufman,
L.A.Remer, D.Tanre, I.Slutsker, and B.N.Holben, 2002a:
A spatio-temporal approach for global validation and
analysis of MODIS aerosol products. Geophys. Res, Lett.,
29, 8006, doi:10.1029/2001GL013206.
[4] Ichoku, C., Remer, L.A., Eck, F.T, 2004. Quantitative
evaluation and intercomparison of morning and afternoon
MODIS aerosol measurements from Terra and Aqua Sat-
ellites. Journal of Geophysical Research, JGR (Special
Issue on: “Global Aerosol System”.
[5] King, D, M., Kaufman, Y.J., Tanre, D., Nakajima, T,
1999, Remote sensing of tropospheric aerosols from
space: past, present and future. Bulletin of the American
Meteorological Society.
[6] Kaufman, Y.J., B.N.Holben., D, Tanre., i.Slutsker., a.
Smirnov., and T.F. Eck, 2000, Will aerosol measurements
from Terra and Aqua polar orbiting satellites represent
the daily aerosol abundance and properties, Geophys. Res.
Letters, 27, 3861-3864, 2000.
[7] Kaufman, Y.J., B.N.Holben., D. Tanre., and O.
Boucher, A satellite view of aerosols in the climate
system, Nature, 419, 215-223, 2002